I’ve just written an interesting analysis tool that hopefully Nicolas will be posting in the library soon and while testing it out an interesting fact came to light so I wrote it into the simplest possible strategy ever and I am posting it here for discussion.
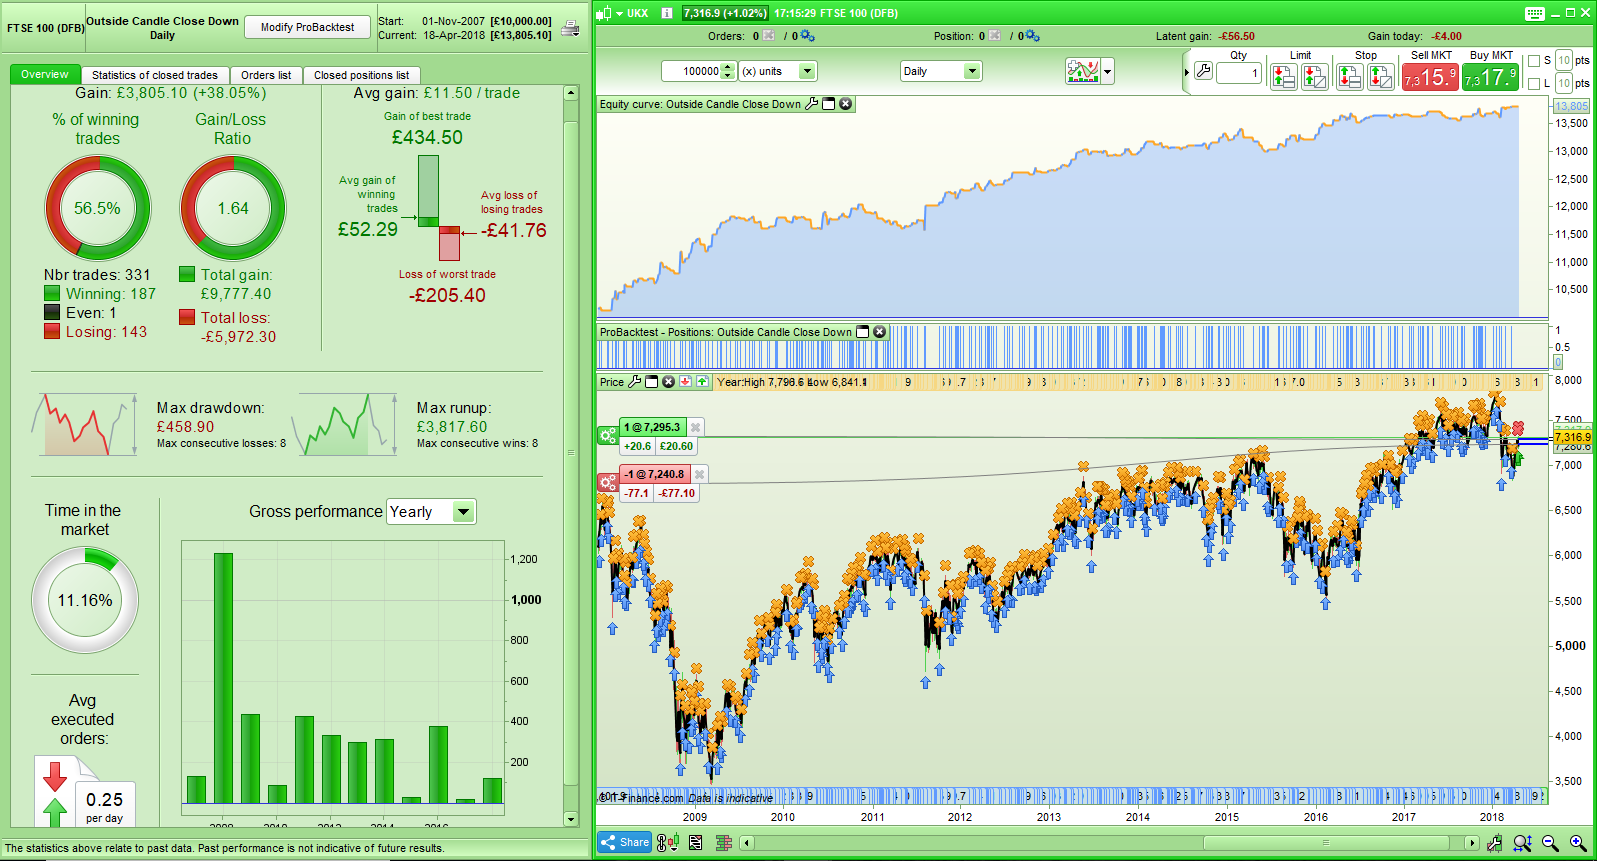
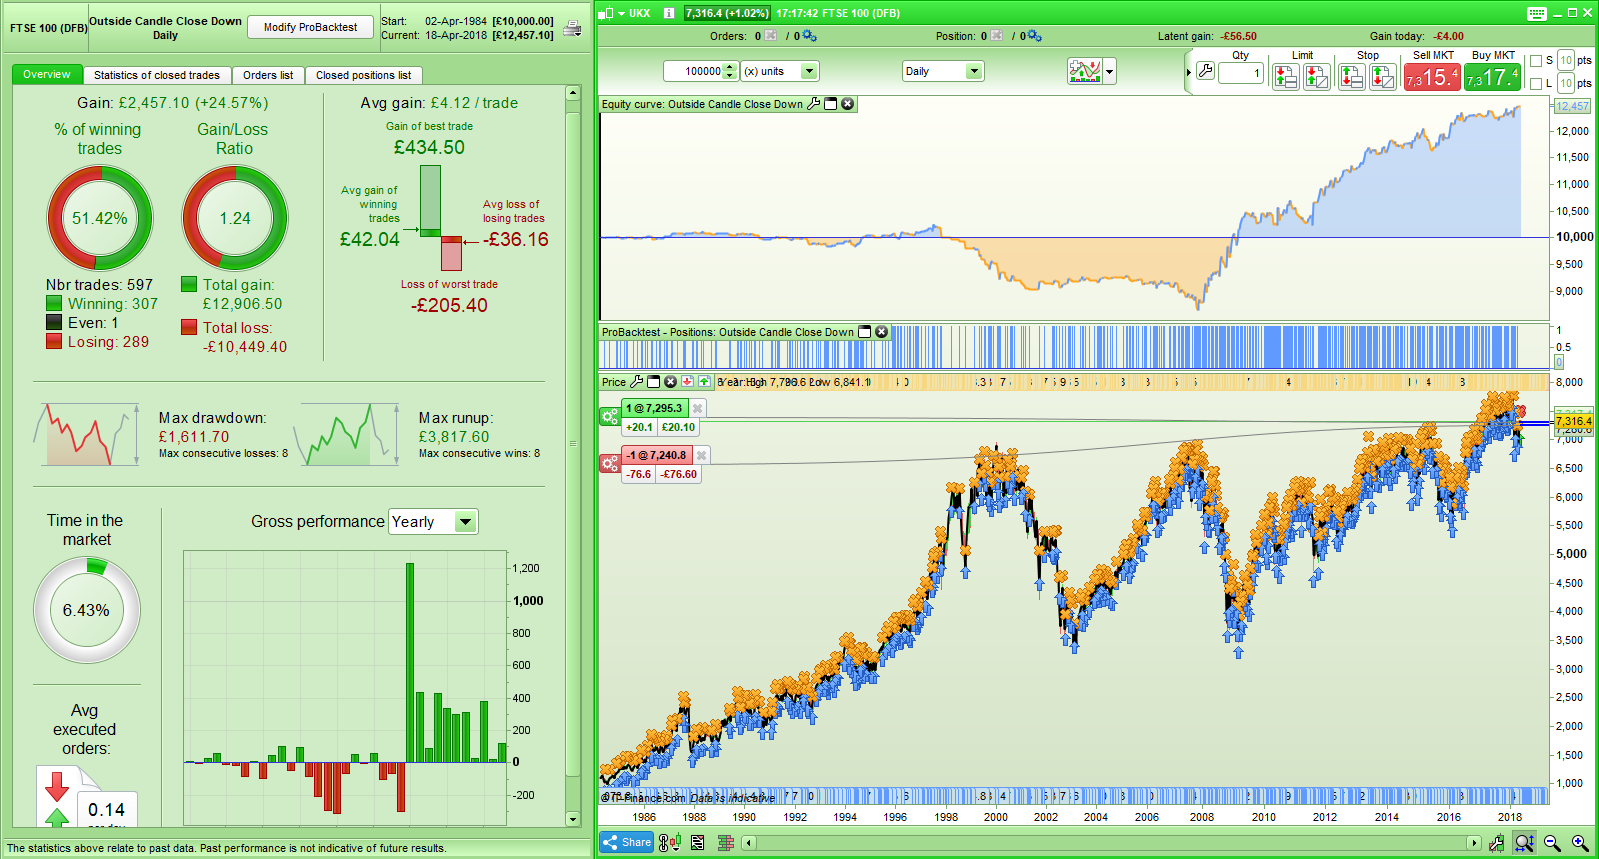
Basically if from the beginning of November 2007 you had bought the FTSE100 every time that there was a daily candle whose high was higher than the previous day’s and whose low was lower than the previous day’s low and the close was lower than the open and then held that position for just one day then you would have a consistently profitable strategy. Before Nov 2007 it does not work but it has been very consistent since around that date.
Interestingly this has worked through the 2008 recession period and all the ups and downs since then and the drawdown is tiny at just under £459 for a level £1 stake with just three losses in a row.
Over ten years is quite some time for such simple entry criteria to work whose only variable is basically the start date.
So I guess the big question is would you dare to trade it considering that it does not work prior to Nov 2007 but has worked so well since then?
Tests were done with a spread of 2.
[attachment file=68704]
[attachment file=68705]
DEFPARAM CumulateOrders = False

IF High > High[1] and Low < Low[1] and close < open THEN
BUY 1 contract at Market
ENDIF

IF OnMarket THEN
Sell at Market
ENDIF
 Leo
LeoParticipant
Veteran
What about short positions? Still working? Does the short strategy works before nov 2007? Does the result depend in the colour of the previous bar? Does it work in other time frame?
Very interesting what you discover, how do you get to this idea?
Thanks i.a.
I try not to get involved in shorting indices as you are fighting a long term trend but it is interesting that this theory of buying only has worked in down trends since Nov 2007.
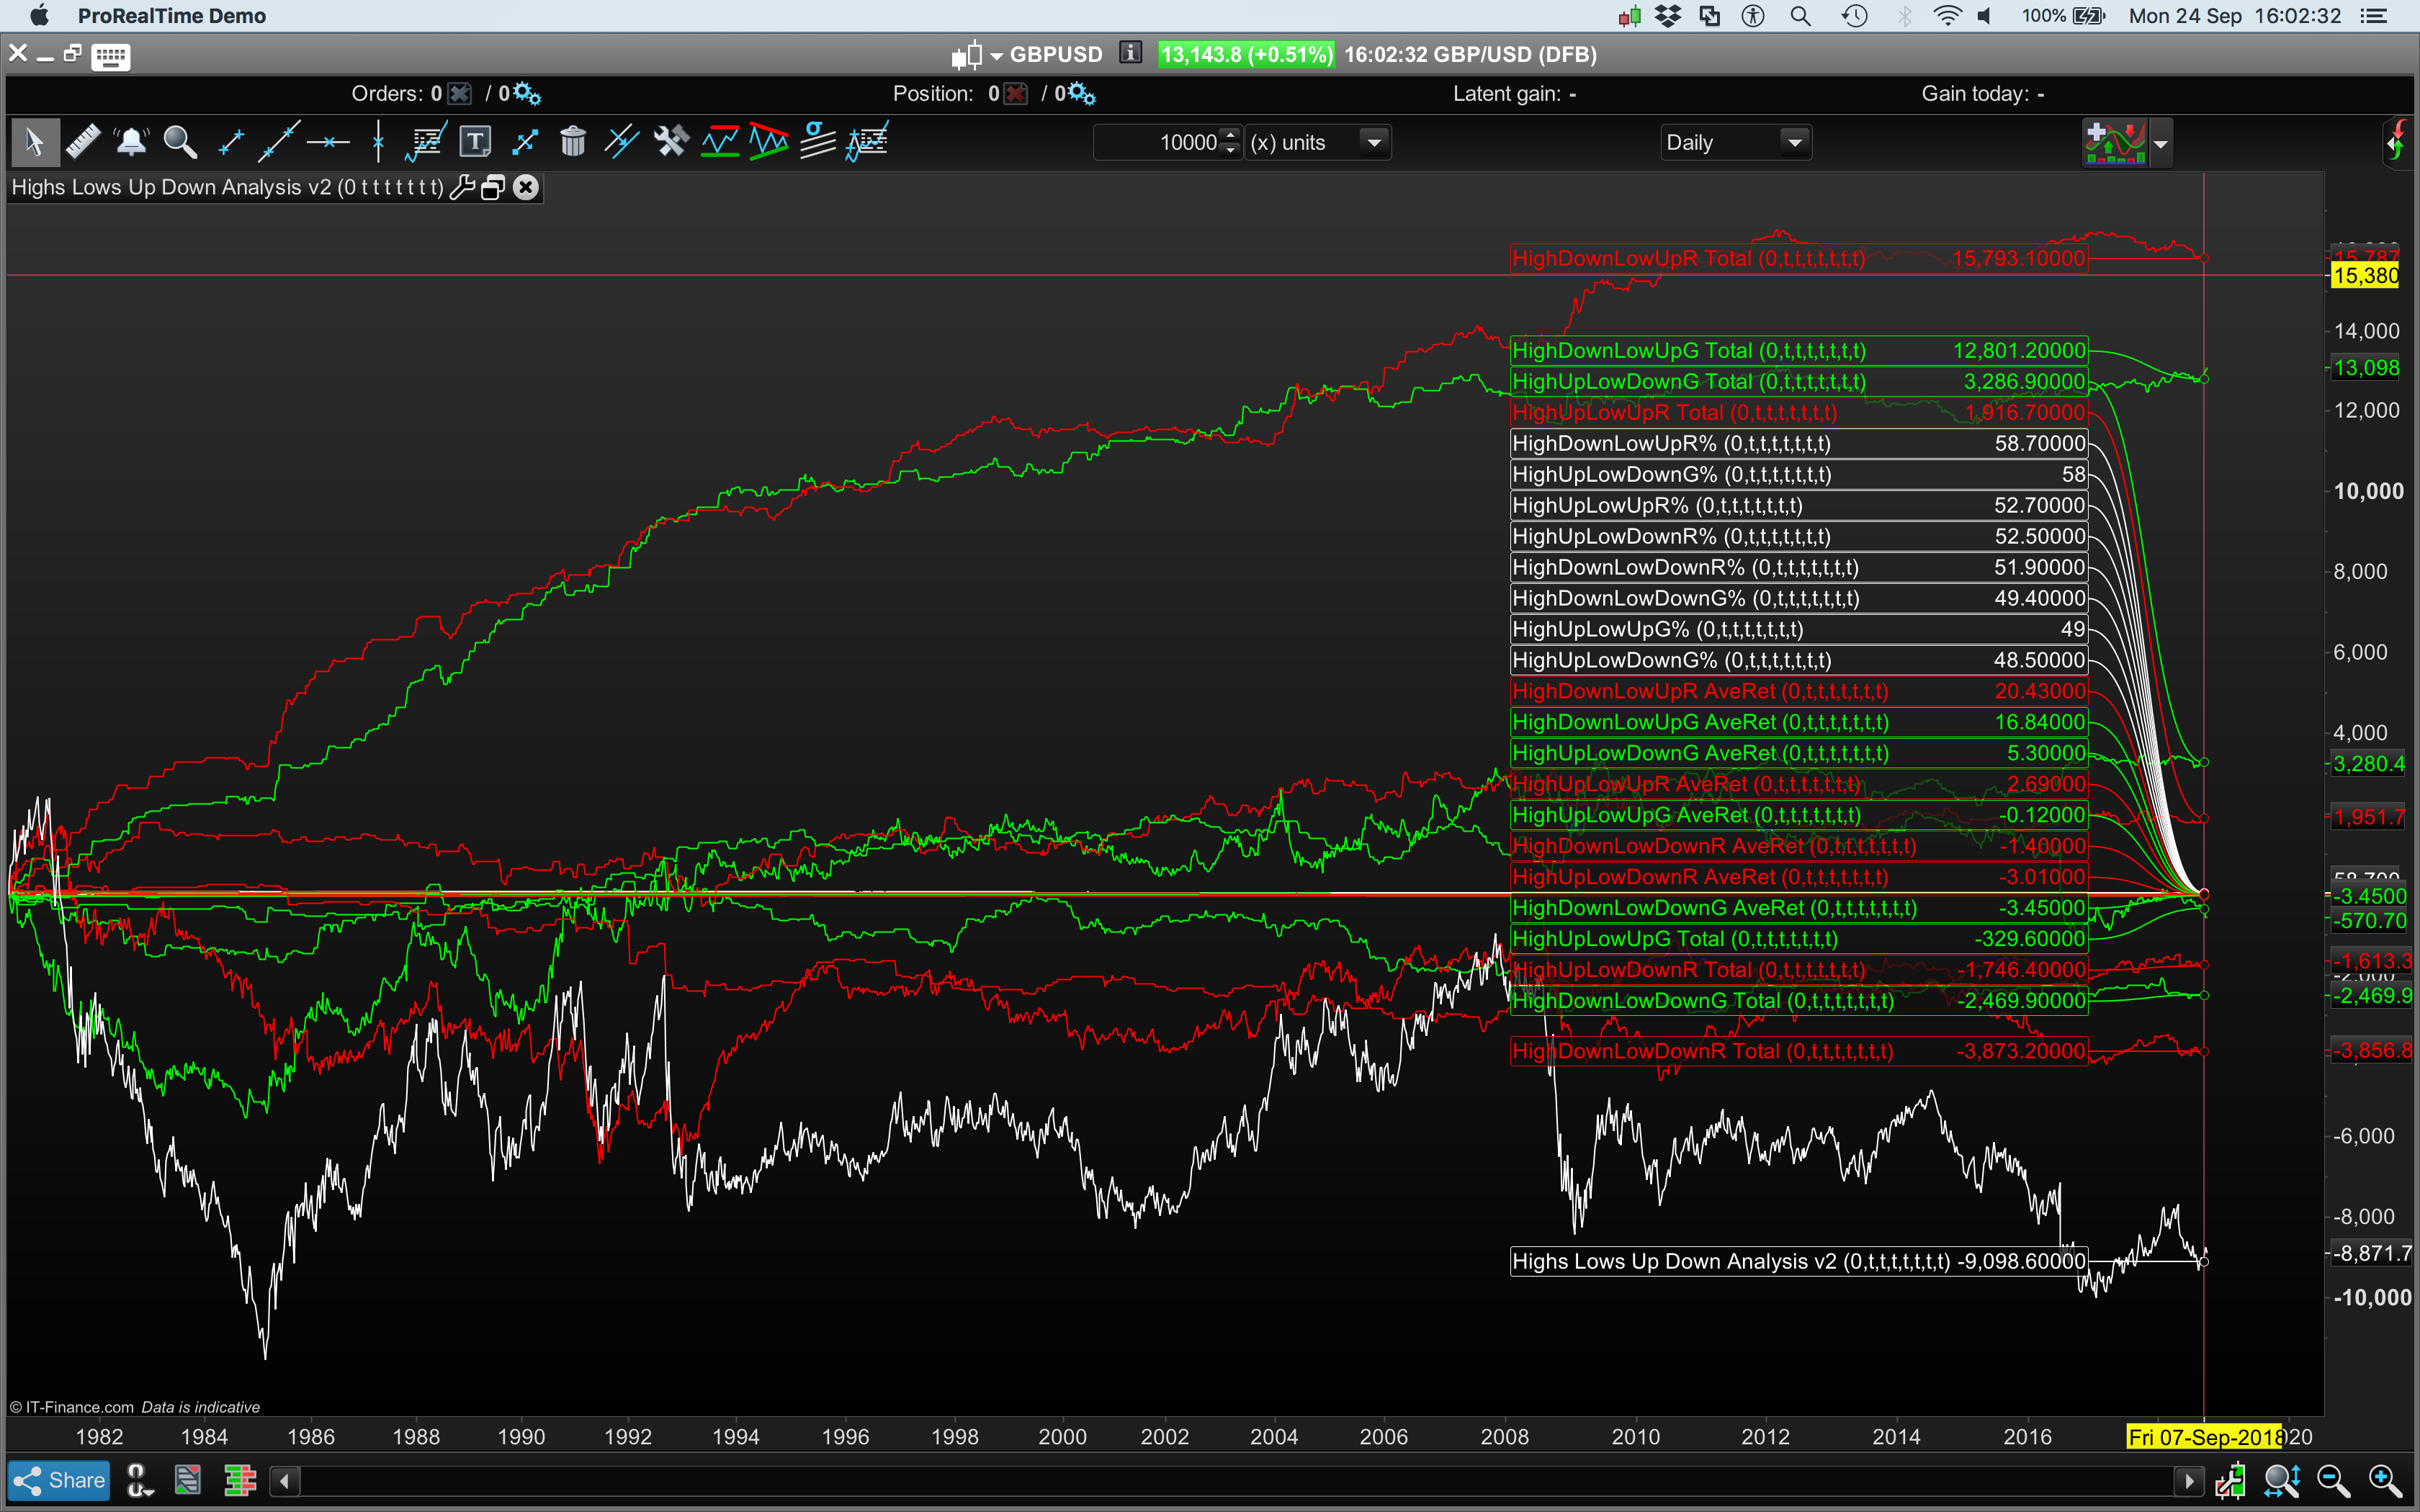
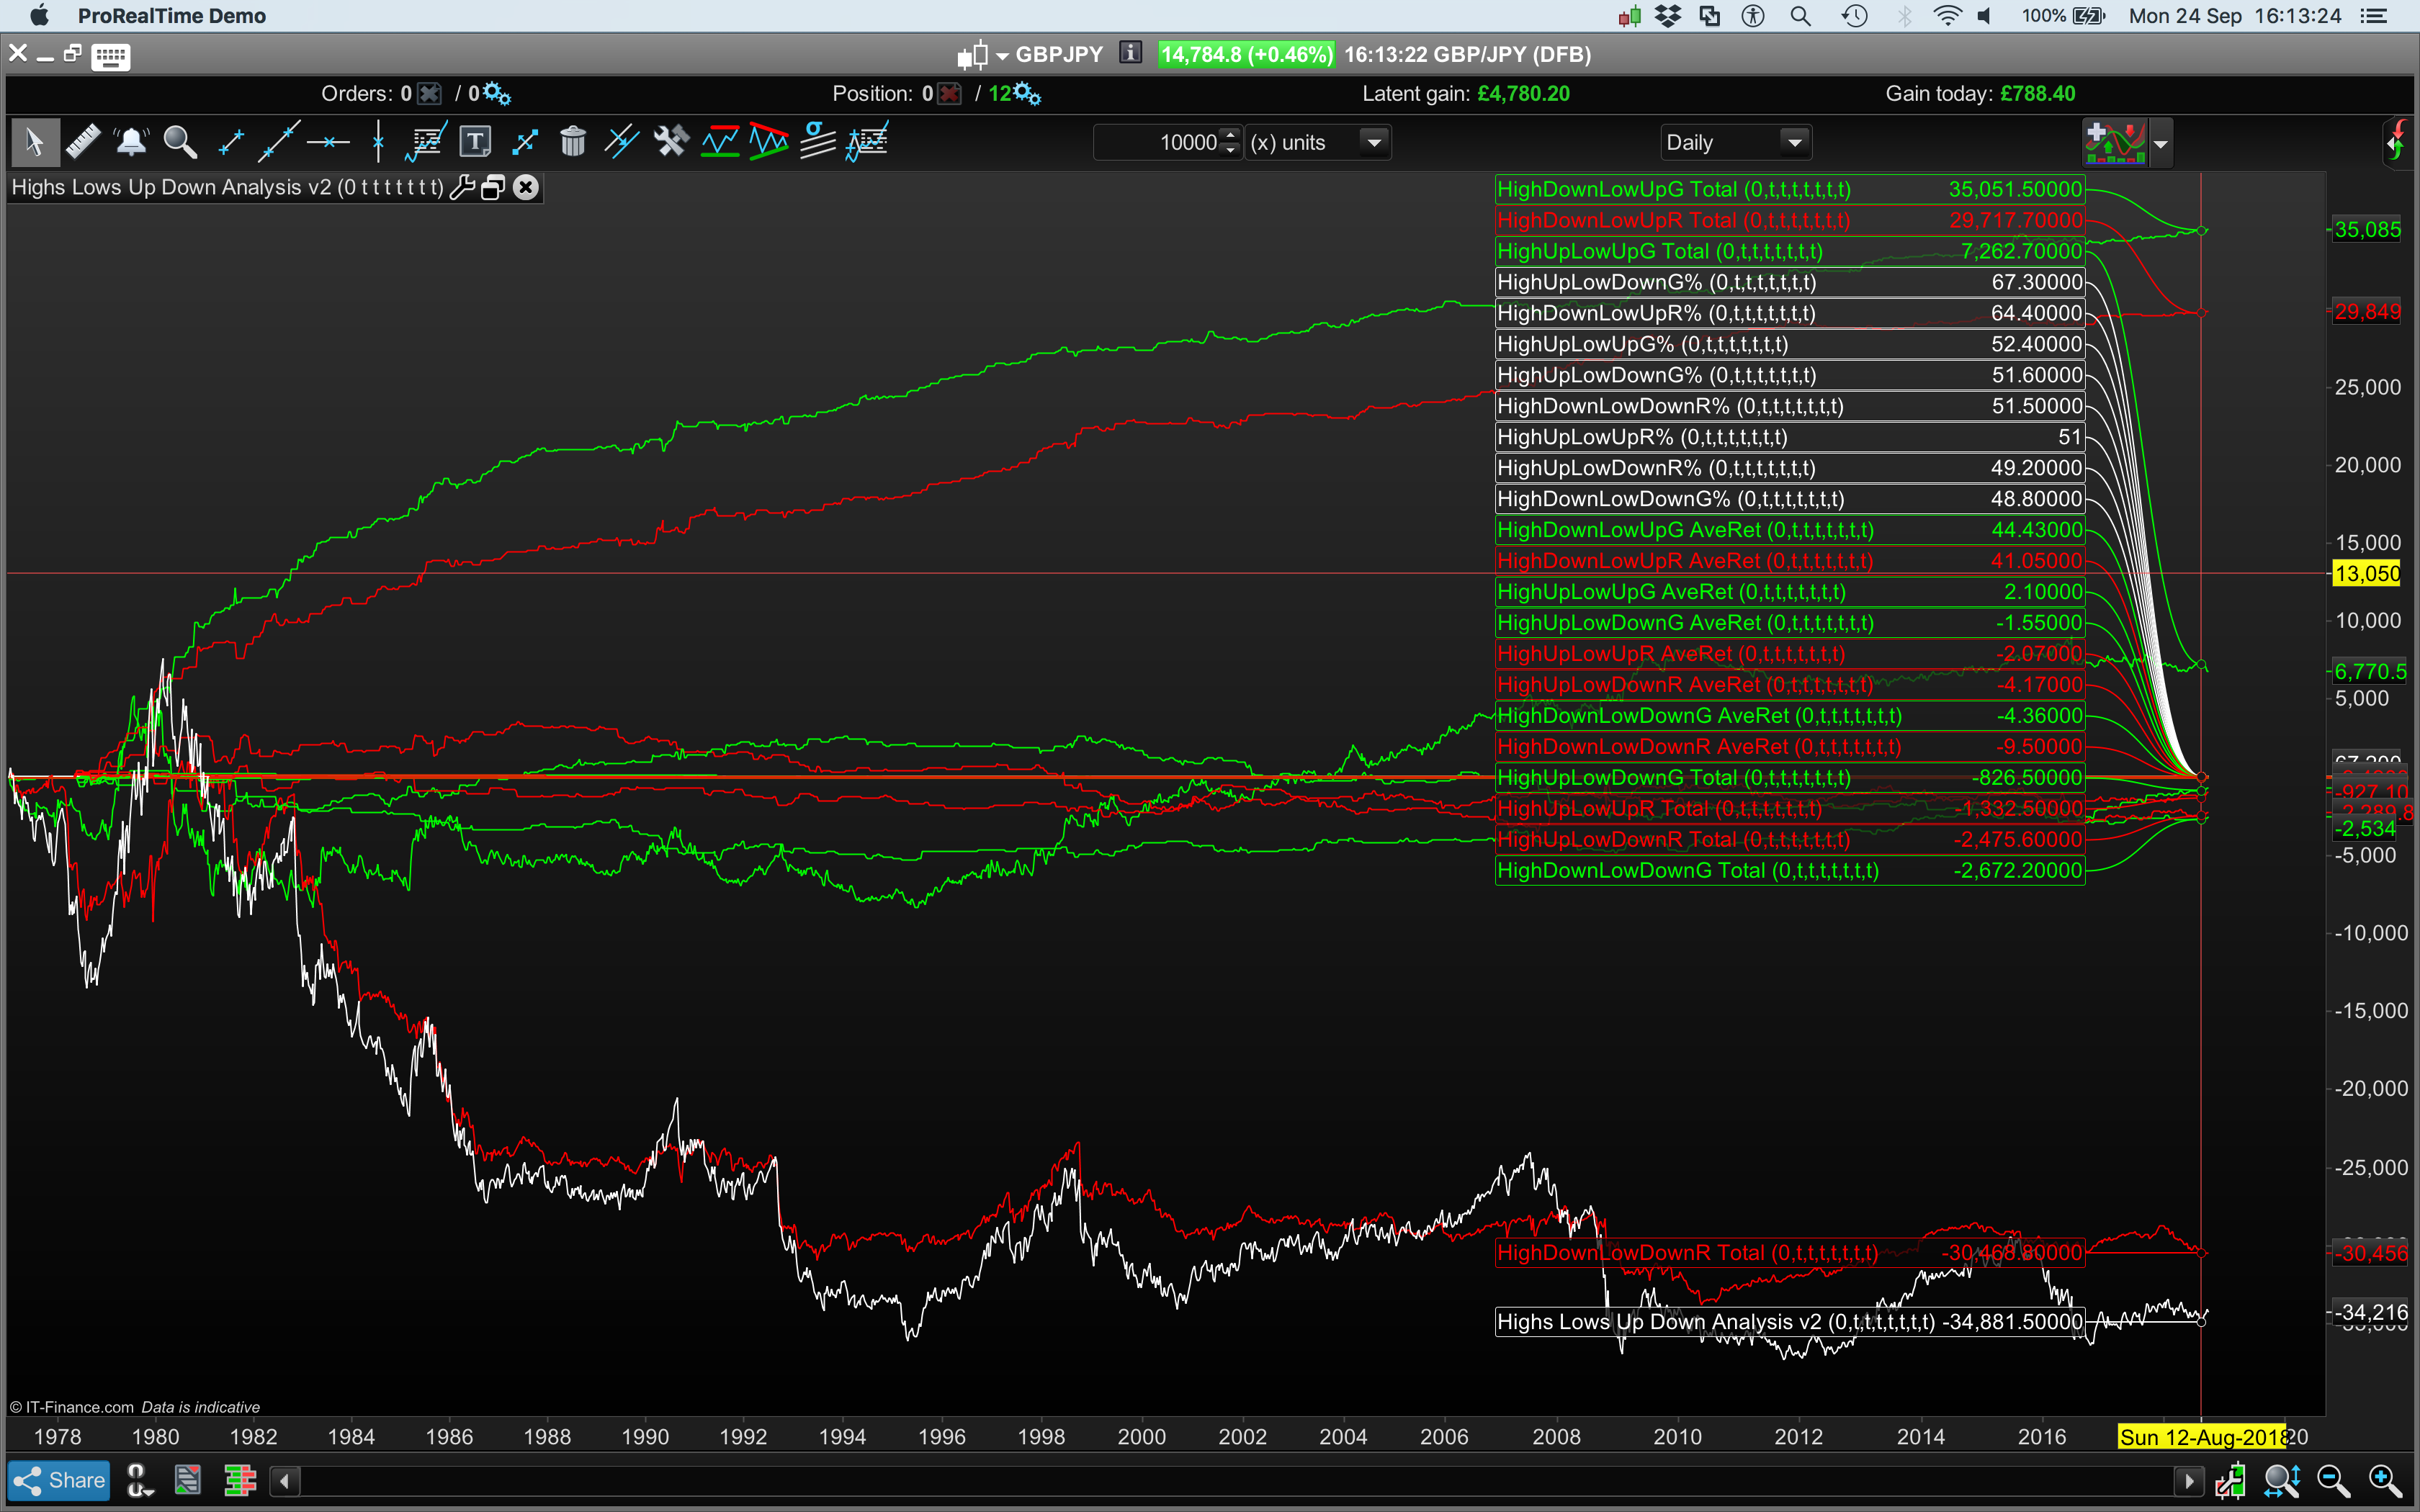
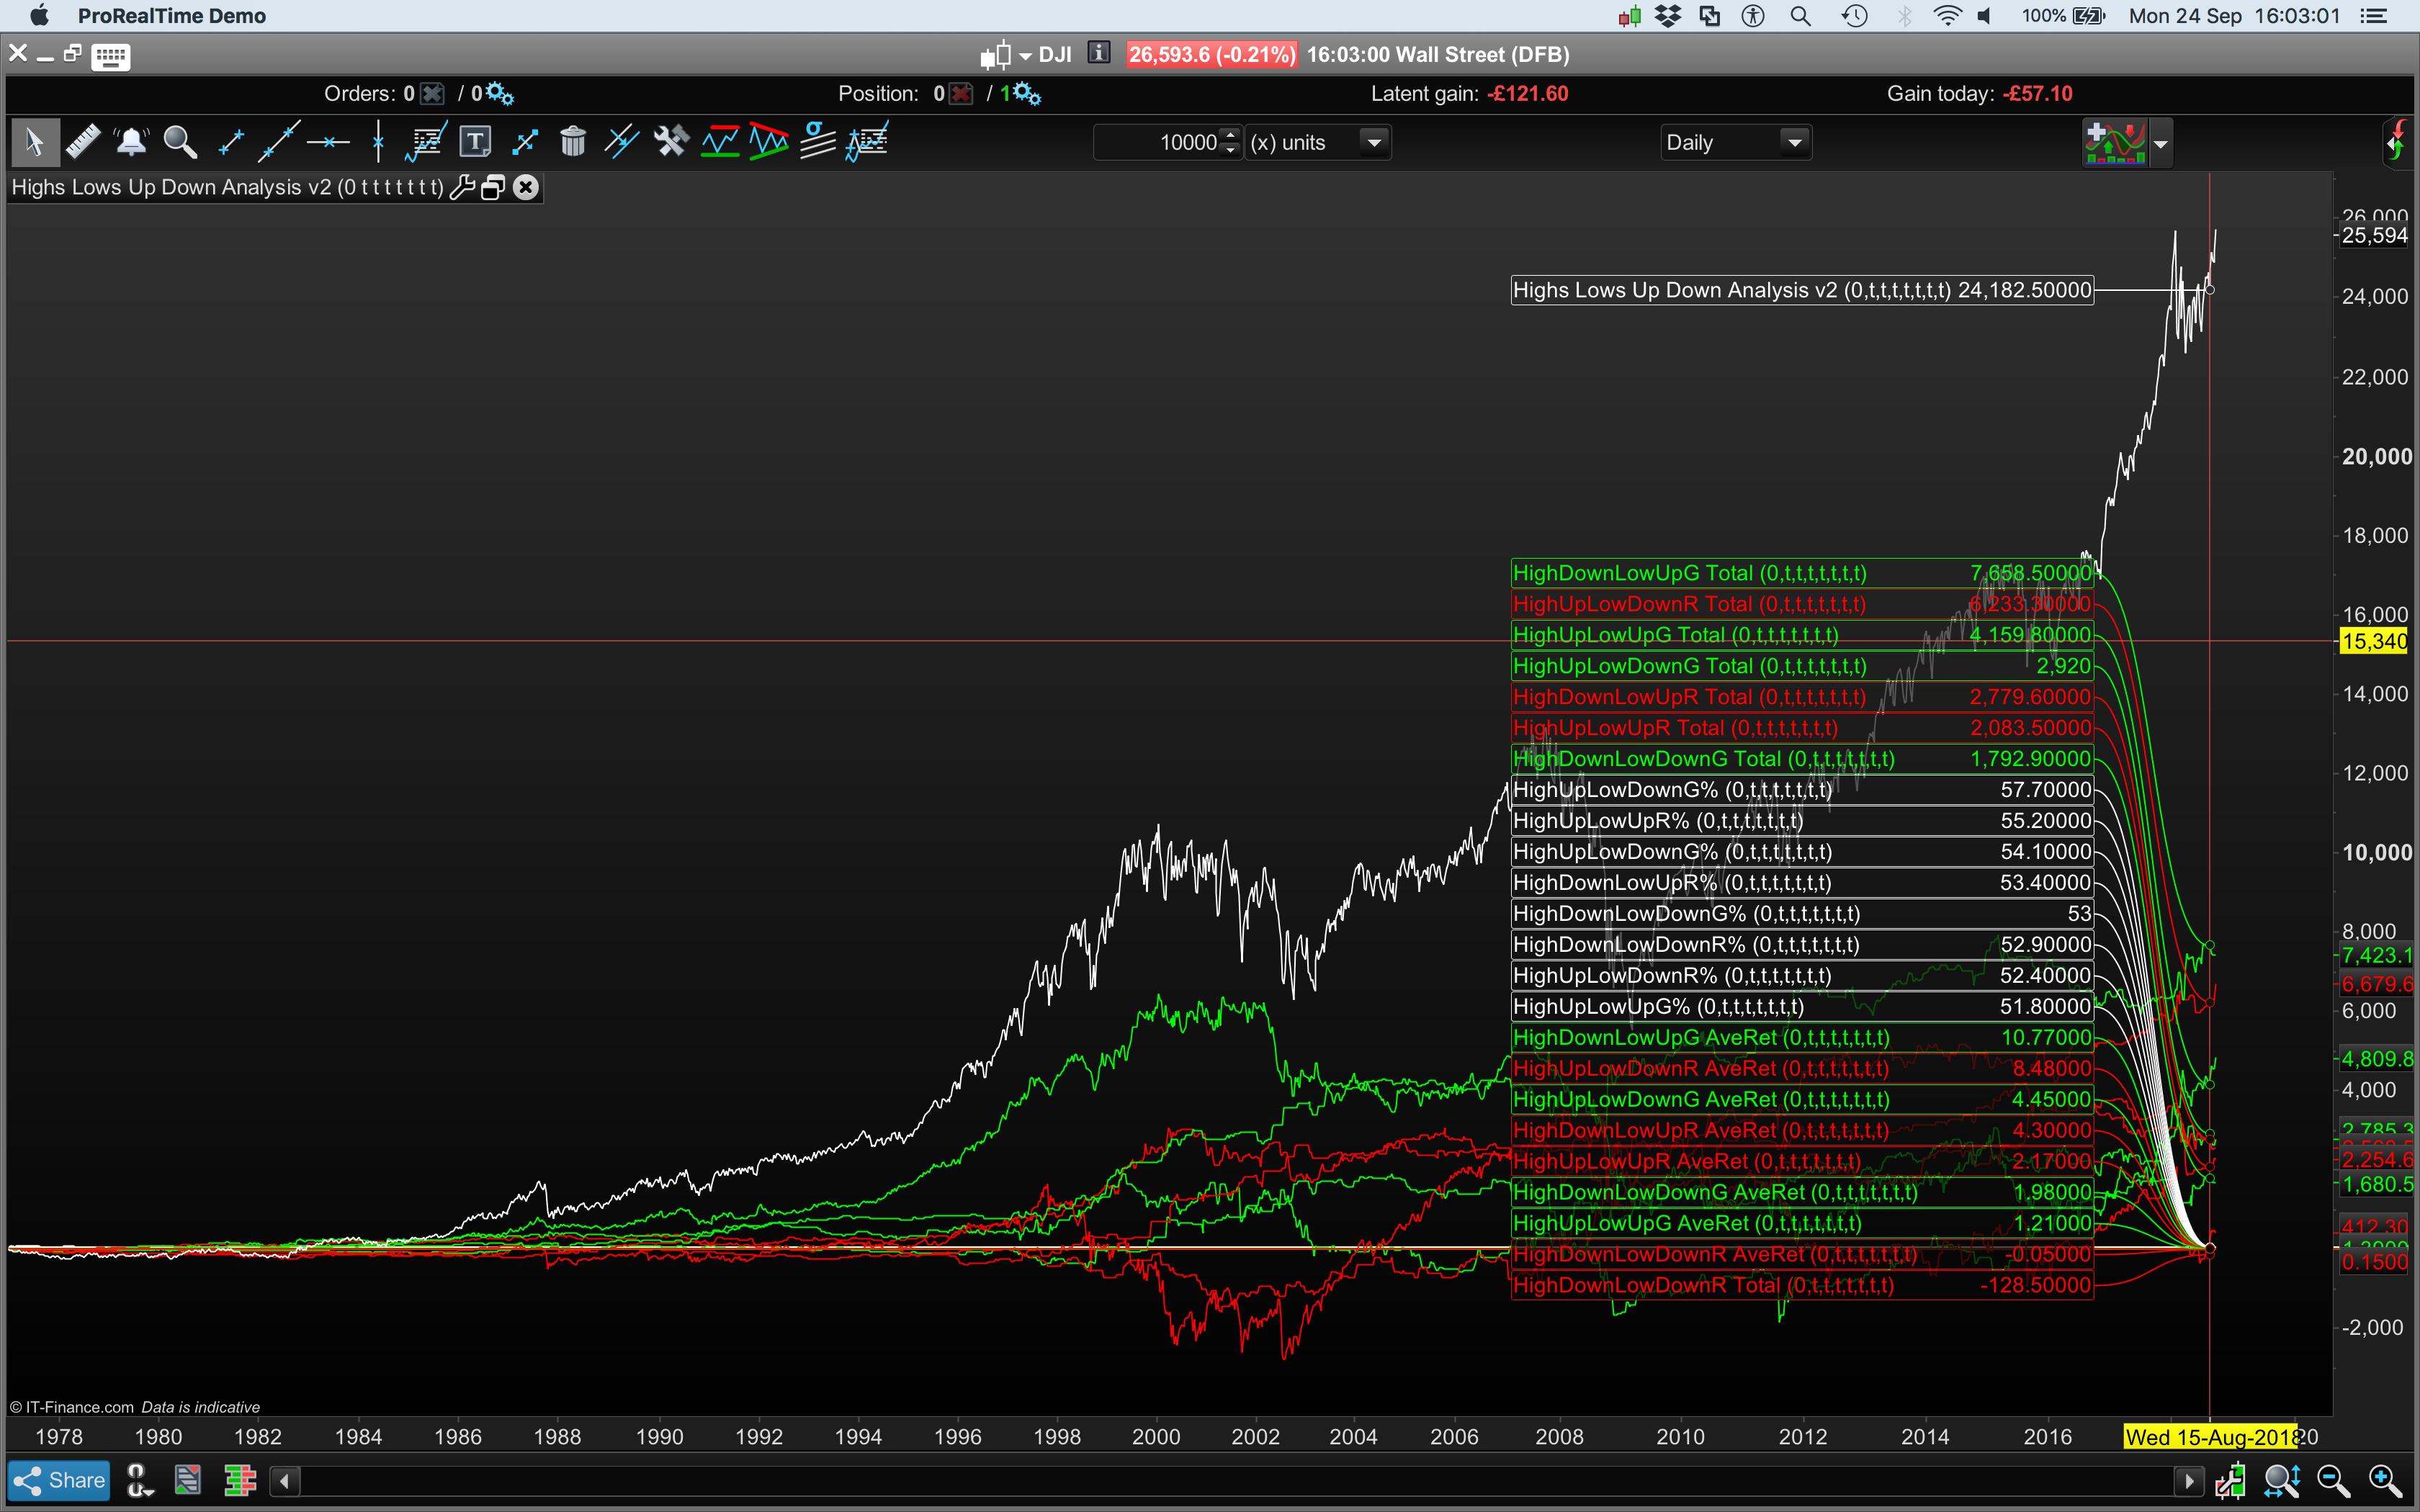
My analysis tool which Nicolas will hopefully post today or tomorrow in the library allows analysis of various candle patterns with combinations of higher or lower highs than the previous candles and higher and lower lows along with close up or down to see how each combination has performed historically which is how I discovered this interesting fact. The colour of the previous bar is not taken into consideration but maybe I can expand the tool to add this to the analysis if I have time.
There are lots of possible combinations of time frame and market so I will leave it to you to find other interesting anomalies and hopefully post them here.
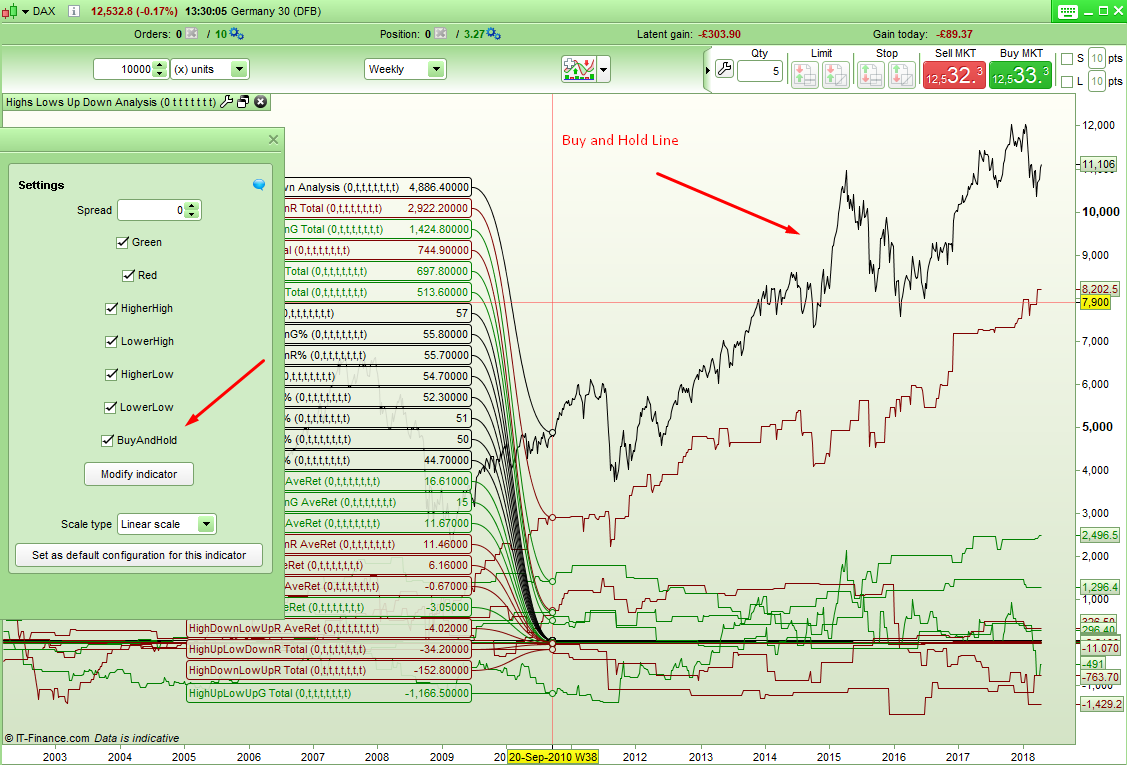
The analysis tool has now been put in the library:
Highs, Lows and Higher Close, Lower Close Analysis
I’ve added a little code into my ‘Highs, Lows and Higher Close, Lower Close Analysis’ tool to allow it to show a buy and hold line to compare performance against. This can be switched off or on by ticking or unticking the box.
The new .ITF file is attahed if anyone is interested in this small improvement.
[attachment file=68872]
 Bard
BardParticipant
Master
Wow, great job and brilliant indicator @Vonasi, it appears “inside days” are a great pattern to trade from this analysis.
Did you read the work of candlestick pattern expert Thomas Bulkowski?
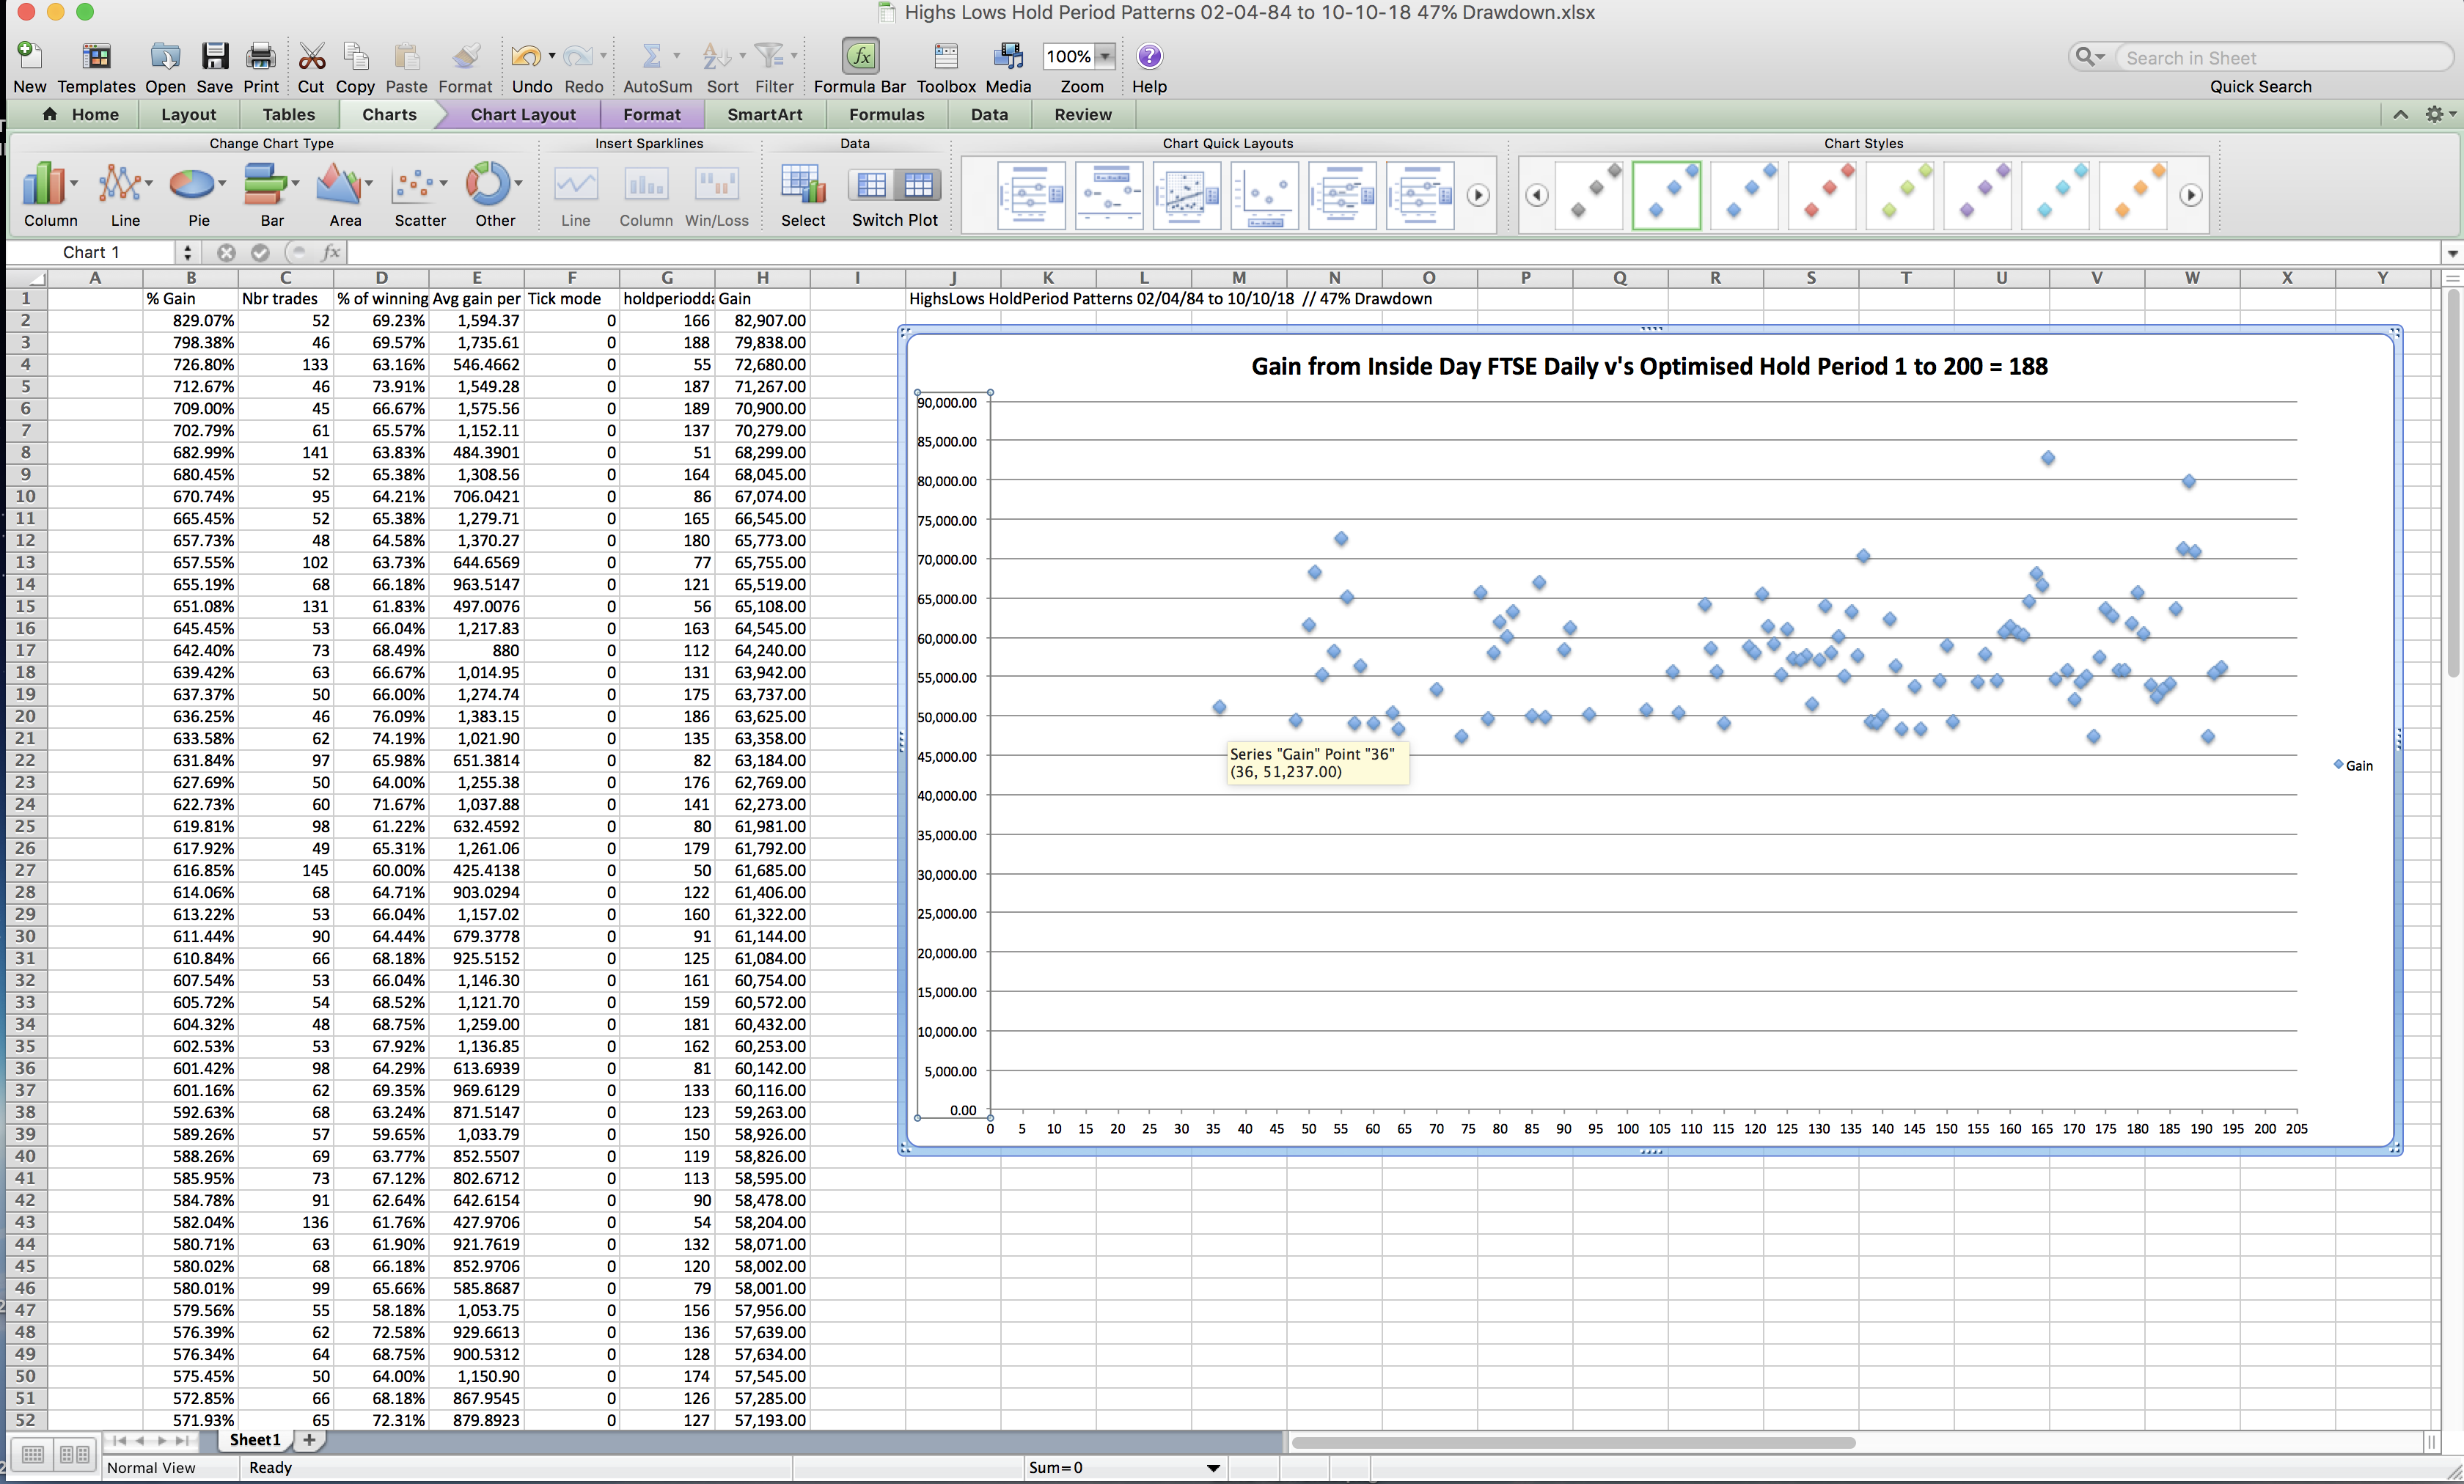
My first thought is what would happen if there was code in the indicator that allowed one to set the period of hold time for the candlestick pattern instead of exiting it after one candle? That optimisation data could be exported to an Excel scatter graph to see if there are stable holding periods when buy and hold doesn’t perform as well.
Bulkowski’s Inside Days: http://thepatternsite.com/InsideDays.html
Bulkowski’s top 10 patterns are here: http://thepatternsite.com/CandlePerformers.html
I think I can see now why he retired at 36, lol.
It is a long time since I have visited this analysis tool since I wrote it so thank you for bringing it back to life!
Did you include any spread in your testing as it can have a massive effect on results?
I seem to recall that I did play around with a version that held for various longer periods but felt that was ultimately just data mining. For me the analysis tool was really just a way of analysing each market and trying to work out what was most probable to work. At the end of the day a candle is just four bits of data – open,close,high and low and if you move the time by just a tiny bit you get a different candle – but this is what we have to work with so that we can get some idea in a snapshot of time of what market sentimentality is. This is why the tool works better in slower time frames and why holding for longer time periods is clearly no better indication of market sentimentality and is just data mining.
BardParticipant
Master
No worries! I’ve been realising that when I was discretionary trading I’d have all these indicators but hardly ever look at them, it was always candlestick shapes/patterns that I’d see over and over again that I’d trade off, so I’ve been looking at how reliable they are for entries. Violet on this forum has put up a screener but the patterns aren’t that frequent so i’m looking at Bulkowski’s site and looking at the best ranking, I’m happy with the exit side of the equation as I can’t find anything that makes more statistical sense that the Kase Dev Stop that Nicolas coded for me. (I finally got it to optimise…). The Krev indicator is useful too, it tells you how much £/€/$ risk per unit you’re taking at Dev Stop 3 (3.6 standard deviations).
Yes, I always use a wide spread of 3.8 when backtesting, (I trade/research on forex and indices) I figured it’ll cover slippage.
I mentioned the holding period code as on that Inside Days link posted above Bulkowski states:
“For each inside day pattern, I found where the trend started and when it ended. To find the trend peak or valley, I found the lowest valley and highest peak within plus or minus 10 days (21 days total) each, before the inside day and the same peak/valley test after the inside day. The closest valley or peak before the inside day is where the trend began. The closest peak or valley after the inside day is where the trend ended.
The 10-day peak or valley number tends to find major turning points.”
He also uses exit profit % targets too, like 6 or 7 percent.
The easiest way to test the ten day theory would be to simply code a strategy that trades it rather than try to adapt the indicator to do it.
Here is a strategy that you can use to test opening a position after each candle type and then closing after a certain number of candles have passed. It tests both going long and short at each candle type.
Set UDHL as an optimized variable from 1 to 16 and HoldPeriod as whatever range of periods you want to test holding for.
Obviously results will vary depending on the start date/time as once on the market any new candles that meet the criteria will not open a trade until the HoldPeriod has expired.
I have a more complicated version that adds extra test criteria and opens multiple positions but I’ll keep that to myself for now. The bones of the idea are here for you to add to!
//1 = Long Green High Up Low Up
//2 = Long Green High Up Low Down
//3 = Long Green High Down Low Up
//4 = Long Green High Down Low Down
//5 = Long Red High Up Low Up
//6 = Long Red High Up Low Down
//7 = Long Red High Down Low Up
//8 = Long Red High Down Low Down
//9 = Short Green High Up Low Up
//10 = Short Green High Up Low Down
//11 = Short Green High Down Low Up
//12 = Short Green High Down Low Down
//13 = Short Red High Up Low Up
//14 = Short Red High Up Low Down
//15 = Short Red High Down Low Up
//16 = Short Red High Down Low Down

//Settings
//UDLH = 1 //1 to 16 selects candle type and trade direction
//HoldPeriod = 10 //Number of candles to hold for.

//Conditions
Green = close > open
Red = close < open
HighUp = high > high[1]
HighDown = high < high[1]
LowUp = low > low[1]
LowDown = low < low[1]

if not onmarket and UDLH = 1 then
if Green and HighUp and LowUp then
buy 1 contract at market
endif
endif

if not onmarket and UDLH = 2 then
if Green and HighUp and LowDown then
buy 1 contract at market
endif
endif

if not onmarket and UDLH = 3 then
if Green and HighDown and LowUp then
buy 1 contract at market
endif
endif

if not onmarket and UDLH = 4 then
if Green and HighDown and LowDown then
buy 1 contract at market
endif
endif

if not onmarket and UDLH = 5 then
if Red and HighUp and LowUp then
buy 1 contract at market
endif
endif

if not onmarket and UDLH = 6 then
if Red and HighUp and LowDown then
buy 1 contract at market
endif
endif

if not onmarket and UDLH = 7 then
if Red and HighDown and LowUp then
buy 1 contract at market
endif
endif

if not onmarket and UDLH = 8 then
if Red and HighDown and LowDown then
buy 1 contract at market
endif
endif

if not onmarket and UDLH = 9 then
if Green and HighUp and LowUp then
sellshort 1 contract at market
endif
endif

if not onmarket and UDLH = 10 then
if Green and HighUp and LowDown then
sellshort 1 contract at market
endif
endif

if not onmarket and UDLH = 11 then
if Green and HighDown and LowUp then
sellshort 1 contract at market
endif
endif

if not onmarket and UDLH = 12 then
if Green and HighDown and LowDown then
sellshort 1 contract at market
endif
endif

if not onmarket and UDLH = 13 then
if Red and HighUp and LowUp then
sellshort 1 contract at market
endif
endif

if not onmarket and UDLH = 14 then
if Red and HighUp and LowDown then
sellshort 1 contract at market
endif
endif

if not onmarket and UDLH = 15 then
if Red and HighDown and LowUp then
sellshort 1 contract at market
endif
endif

if not onmarket and UDLH = 16 then
if Red and HighDown and LowDown then
sellshort 1 contract at market
endif
endif

if longonmarket and barindex - tradeindex >= HoldPeriod then
sell at market
endif

if shortonmarket and barindex - tradeindex >= HoldPeriod then
exitshort at market
endif
BardParticipant
Master
Thanks a lot for this code @Vonasi, interesting analysis and I now know why Larry Williams was such a big fan of Inside Days, (UDLH = 3).
Backtested to 1984 – the earliest data – on the Daily FTSE, this Excel sheet optimisation shows any hold period over 36 days is stable and safe to use.
The drawdown was highish at 47%. Legendary trader Richard Dennis quit systems at 50% losses. Other nearer date ranges produce less table hold period data sets.
My first though is how to get it to take up to 3 trades (which is all I could handle trading live spot Forex) so that it takes trades whilst an existing hold period is being maintained for the first trade? I coded this but it made no difference to the number of trades – probably because of the exit long rule at the bottom of your code?
// Conditions to enter extra long positions

//second order

IF LongOnMarket AND COUNTOFPOSITION = 1 and UDLH = 3 then
if Green and HighDown and LowUp then
buy 10 contract at market
ENDIF
ENDIF

//third order

If LongOnMarket AND COUNTOFPOSITION = 2 and UDLH = 3 then
if Green and HighDown and LowUp then
buy 10 contract at market
ENDIF
ENDIF
I think the key to candle trading is not the pattern per se, but where it forms. If you backtest the various patterns they have low probability outcomes. The real skill (having traded them manually) is to look for confluence with other key data such as support and resistance levels and/or Fib retracement or projection levels. Sometimes key MAs can be useful (20,50,200) along with BRNs (Big Round Numbers such as 1.1000 or 1.5000).
I’ve yet to find an indicator that can reliably draw support and resistance levels better than I can draw with the naked eye. I tend to use the line chart for these levels as it’s more meaningful (close over spikes) for the TF one higher than the TF I’m trading on. Having a simple system that trades long/short based on key candlesticks (IB, Shooting Star, Dark Cloud Cover) but ONLY combined with valid 1TF higher support and resistance levels, should yield strong results.
BardParticipant
Master
This makes sense, with spot forex I’d be looking for patterns but be aware of not only the daily trend (using a 2 day mov average) but also the 5 day and monthly. With PRT’s Multiframe trading – which I haven’t had time to implement yet, – adding whether the current price is above certain key moving averages and/or other indicators should be relatively straightforward. Great ideas, thanks @grimweasel4
Bard – in your code above I think you are misunderstanding COUNTOFPOSITION. It is not how many trades you have opened but is your total position size. So if you buy 10 contracts and then buy another 10 contracts your COUNTOFPOSITION = 20 and not 2.
As for your comments regarding holding for over 36 days but having big drawdown – what you have discovered is what that buy and hold is more profitable than buy, sell, buy, sell, buy, sell etc but the latter will most likely have less draw down than buy and hold. Our job when coding a strategy is to find a nice compromise between the two.