Buongiorno,
Chiedo di voler cortesemente tradurre in linguaggio PRT questo codice che sembra interessante in quanto evidenzia molto chiaramente le fasi di stallo del mercato
Grazie
Cordiali saluti
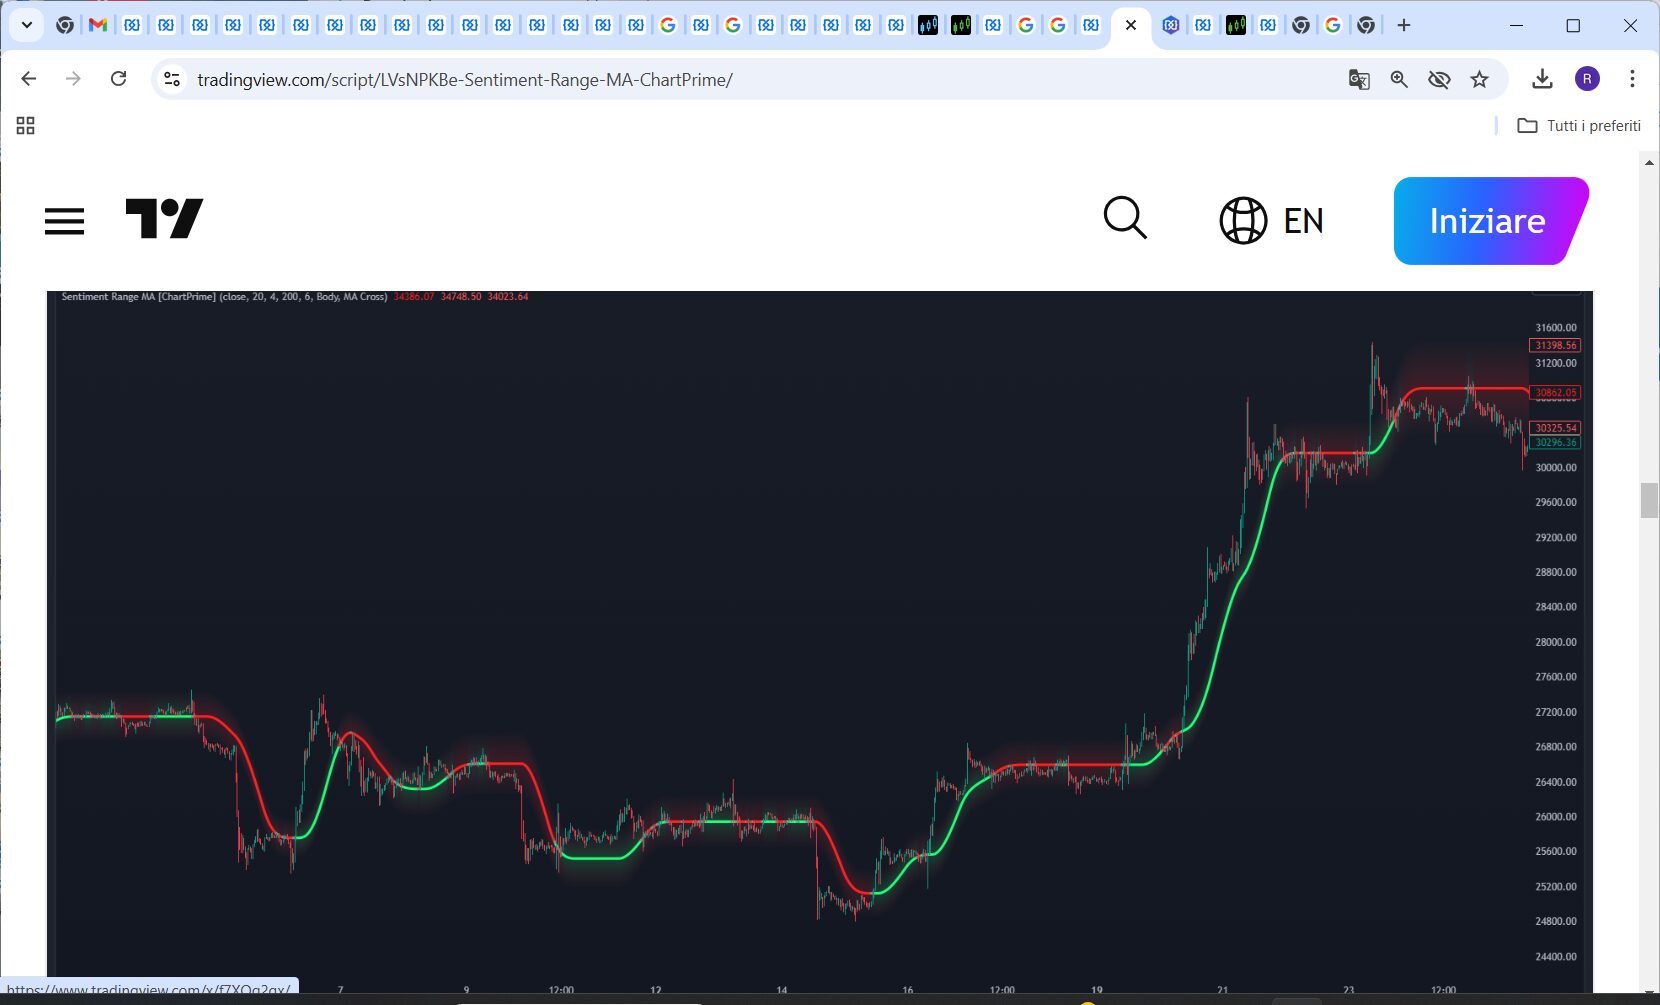
SENTIMENT RANGE MA
fornisce ai trader una prospettiva dinamica sull’attività di mercato, enfatizzando sia la stabilità nelle zone di chop sia la rapida adattabilità al di fuori di esse.
https://www.tradingview.com/v/LVsNPKBe/
CODICE CSS
# https://www.tradingview.com/v/LVsNPKBe/
#/ This source code is subject to the terms of the Mozilla Public License 2.0 at https://moz
#// © ChartPrime
#indicator(“Sentiment Range MA [ChartPrime]”, overlay = true, timeframe = “”, timeframe_gaps = false)
# Converted and Mod by Sam4Cok@Samer800 – 11/2023
input showSignals = no;
input colorBars = no;
input showBand = yes;
input timeframe = {Default “Chart”, “Custom”};
input customTimeframe = AggregationPeriod.DAY;
input source = FundamentalType.CLOSE; # “Source”
input Length = 20; # “Length”
input DoubleFilter = yes; # “Double Filter”
input trueRangeType = {Default “Candle High/Low”, “Volatility Adjustment”};
input CandleSmoothing = 4; # “Trigger Smoothing”
input atrLength = 200; # “ATR Length”
input RangeMultiplier = 6.00; # “Range Multiplier”
input RangeStyle = {default “Body”, “Wick”}; # “Range Style”
input LineColorStyle = {default “MA Direction”, “MA Cross”, “Solid”}; # “Color Style”
def na = Double.NaN;
def last = isNaN(close);
def useAtr = trueRangeType == trueRangeType.”Volatility Adjustment”;
def mtf = timeframe == timeframe.”Custom”;
def dir = LineColorStyle == LineColorStyle.”MA Direction”;
def cross = LineColorStyle == LineColorStyle.”MA Cross”;
def len = Length + 1;
def smoothing = CandleSmoothing + 1;
def multi = RangeMultiplier;
#– Color
DefineGlobalColor(“bull”, CreateColor(33, 255, 120)); # “Bullish Color”
DefineGlobalColor(“bear”, CreateColor(255, 33, 33)); # “Bearish Color”
DefineGlobalColor(“neut”, CreateColor(137, 137, 137)); # “Neutral Color”
DefineGlobalColor(“dbull”, CreateColor(1, 50, 32)); # “Bullish Color”
DefineGlobalColor(“dbear”, CreateColor(63, 0, 0)); # “Bearish Color”
DefineGlobalColor(“dneut”, CreateColor(42, 42, 42)); # “Neutral Color”
#- MTF
def tfS = Fundamental(FundamentalType = source);
def tfO = Fundamental(FundamentalType = FundamentalType.OPEN);
def tfC = Fundamental(FundamentalType = FundamentalType.CLOSE);
def tfH = Fundamental(FundamentalType = FundamentalType.HIGH);
def tfL = Fundamental(FundamentalType = FundamentalType.LOW);
def mtfS = Fundamental(FundamentalType = source, Period = customTimeframe);
def mtfO = Fundamental(FundamentalType = FundamentalType.OPEN, Period = customTimeframe);
def mtfC = Fundamental(FundamentalType = FundamentalType.CLOSE, Period = customTimeframe);
def mtfH = Fundamental(FundamentalType = FundamentalType.HIGH, Period = customTimeframe);
def mtfL = Fundamental(FundamentalType = FundamentalType.LOW, Period = customTimeframe);
def s = if mtf then mtfS else tfC;
def o = if mtf then mtfO else tfO;
def c = if mtf then mtfC else tfC;
def h = if mtf then mtfH else tfH;
def l = if mtf then mtfL else tfL;
#sr_ma(float source, output_smoothing, trigger_smoothing, atr_length = 50, multiplier, string
script sr_ma {
input source = close;
input output_smoothing = 3;
input smoothing = 1;
input atr_length = 50;
input multiplier = 1;
input range_switch = “Body”;
input duel_filter = no;
input useAtr = no;
input o = open;
input c = close;
input h = high;
input l = low;
def ntr = TrueRange(h, c, l);
def nATR = WildersAverage(ntr, atr_length);
def minVol = Min(nATR * 0.5, c * (0.3 / 100));
def volAdj = minVol[20];
def max = Max(o, c);
def min = Min(o, c);
def candle_top = if range_switch != “Body” then h else max;
def candle_bot = if range_switch != “Body” then l else min;
def smooth_top = Average(candle_top, smoothing);
def smooth_bot = Average(candle_bot, smoothing);
def tr = candle_top – candle_bot;
def avgTr = Average(tr, atr_length);
def atr = if useAtr then volAdj else avgTr;
def sr_ma;
def cur_range;
def top_range;
def bot_range;
def flag = smooth_top > top_range[1] or smooth_bot sr_ma and l sr_ma;
def plot_bearish = h 0;
def ma_delta_bearish = (sr_ma – nzSr_ma) 0 then GlobalColor(“bull”) else
if ma_col 0 then halfTop else na, halfBot, GlobalColor(“dbull”));
AddCloud(if ma_col 0 then Top else na, Bot, GlobalColor(“dbull”));
AddCloud(if ma_col 0 and ma_delta > 0 then 2 else
if ma_cross>0 or ma_delta > 0 then 1 else
if ma_cross<0 and ma_delta < 0 then -2 else
if ma_cross<0 or ma_delta < 0 then -1 else 0;
AssignPriceColor(if !colorBars then Color.CURRENT else
if barColor == 2 then Color.GREEN else
if barColor == 1 then Color.DARK_GREEN else
if barColor ==-2 then Color.RED else
if barColor ==-1 then Color.DARK_RED else Color.GRAY);
#– Signals
def Bull = if barColor== 2 then Bull[1] + 1 else 0;
def Bear = if barColor==-2 then Bear[1] + 1 else 0;
AddChartBubble(showSignals and Bull==2, low, "B", Color.GREEN, no);
AddChartBubble(showSignals and Bear==2, high, "S", Color.RED);
#– END of CODE
Ultima modifica da un moderatore:18 febbraio 2024