Hallo all,
the attached indicator is showing the Elliott waves in an horizontal layout.
The indicator is working well.
I would like to change the indicator into a Screener, showing the crossing over results for the last x (5) trading days backwards from the actual date.
I have tried but the results are not matching.
Could someone give me assistance?
Many thanks in advanced.
Best regards
Hasardeur
------------------------------------------
// Elliott Wave Trend Indicator
// ------------------------------------------
pr= 2
pr2= 10
EWpk2= HIGHEST[1](High) > (High)*(1-pr2)/100
EWtr2= LOWEST[1](Low) < (Low)*(1-pr2)/100
// Intermediate Elliot Wave stuff
//zz= ZigZag[pr](close)
zzHi2=ZigZag[pr2](High)
zzLo2=ZigZag[pr2](Low)
avg2=(zzHi2+zzLo2)/2
If EWpk2 Then
RetroSuccessSecret2= zzHi2
ELSIF EWtr2 Then
RetroSuccessSecret2= zzLo2
ELSIF (avg2>avg2[1]) THEN
RetroSuccessSecret2= high
ELSE
RetroSuccessSecret2= Low
ENDIF
EW2=ZigZag[pr2](RetroSuccessSecret2)
LRZZEW2= LinearRegressionSlope[pr](EW2)

// --------------------------------
// START SCREENER BG_MV-EW Trend
// --------------------------------

c111= LRZZEW2[1] crosses over 0  AND LRZZEW2[0] > 0.0
//c211= LRZZEW2[1] crosses under 0  AND LRZZEW2[0] < 0.0

ckauf=  c111
//cverk= c211

LBday = 4  // look back days
if ckauf then
event = 1
eventindex = barindex
endif

if barindex - eventindex < LBday then
event = 1
elsif barindex - eventindex > LBday then
event = 0
endif

SCREENER[event]
Hey this looks very interesting, thank you for sharing!
Sorry … can’t offer anything to refine the screener (not yet anyway) but what ‘settings’ are you using to show the Indicator same as in the your .pdf?
Please could you put up a screen shot of your indicator settings?
I have played with various settings / colour zones.
Attached is what I see … nothing below the zero line … maybe I’m just not thnking straight (I need more coffee ;)??
Thank You
GraHal
Ha … now after more coffee (ha) I can see maybe I just dived in and replaced the word ‘Screener’ with ‘Return’ and that is my problem!?
I’ll let you know how I get on
Haha … Succes! Toast and coffee now … worn out already! 🙂
Please post images when you can, better than PDF! Thanks.
If I understand correctly your request, you want to test as a screener is a cross over (not under?) of your Eliot Wave oscillator occurred in the last 5 bars? (or do I need more coffee too?!) ahaha
Nicolas … is it to do with file size why you don’t want .pdf attachments?
I find it very difficult to read most folks .jpgs they post on here as even when zoomed in they are blurry and unreadable. Often I give up trying to see the info (instrument, timeframe, dates along the x axis etc) I want to read on images / jpgs posted here by users and I have to make do with a ‘general impression. Is this just me?? (I am using a 28 inch monitor).
Whereas I found the .pdf attachments above loads easier to read and don’t go blurry when I zoom in.
Hallo Nicolas,
thanks for taking care.
Yes you understood right. i would like to have the corssing over at the last 5 days backwards form the actual date.
with the attached code it seems to be ok, but i have still some wrong results.
LBday = 4  // look back days
if ckauf then
eventindex = barindex
endif
if barindex - eventindex < LBday then
SCREENER[ckauf] (BGRSLVaR AS "RSL/VaR")
endif
by the attached file you can see that the indicator works well, but the screener result is wrong because th cross over thates time in 19.09.2016 (this is not the last 5 days.
Hallo Grahal,
here is the indicator code. Have fun and good trades.
pr= 2
pr2= 10
EWpk2= HIGHEST[1](High) > (High)*(1-pr2)/100
EWtr2= LOWEST[1](Low) < (Low)*(1-pr2)/100
zzHi2=ZigZag[pr2](High)
zzLo2=ZigZag[pr2](Low)
avg2=(zzHi2+zzLo2)/2
If EWpk2 Then
RetroSuccessSecret2= zzHi2
ELSIF EWtr2 Then
RetroSuccessSecret2= zzLo2
ELSIF (avg2>avg2[1]) THEN
RetroSuccessSecret2= high
ELSE
RetroSuccessSecret2= Low
ENDIF
EW2=ZigZag[pr2](RetroSuccessSecret2)
LRZZEW2= LinearRegressionSlope[pr](EW2)

RETURN LRZZEW2 coloured(0,0,200) AS "LRZZ EW[10]"
@GraHal
Strange, even if images are compressed when upload, they are lossless and readable .. for me! 20% of visitors/users are browsing the site with mobile each day, better have clickable pictures than download PDF file in that case!
Hallo Niclas,
for this screener it is not important, but generally i try to get only the first buy signal after a sell signal has occured.
The following buy signals (after the first buy signal has occured) are not interesting for me.
The screener should filter the above signals only occured in the last 5 trading days backwards from the actual date.
Many thanks in advanced and
best regards from Germany.
Hasardeur
hi there is no mq4 file attached. only pdf is attached. how come with this to indicator. can you please share
Indeed. The indicator works perfectly! Thanks.
Now I’m checking to make it working as a screener. Even not taking into account to detect the change of signal last 5 days.
Just to detect the signal goes over 0.
It seems already challenging to detect the change the last day.
Here is the piece of the code.
C111 = LRZZEW2 CROSSES OVER 0

SCREENER[C111]
Have you found something since as it is a subject with post long time ago?
Still looking ….
I keep trying but seems that I’m struggling with simple thing 🙁
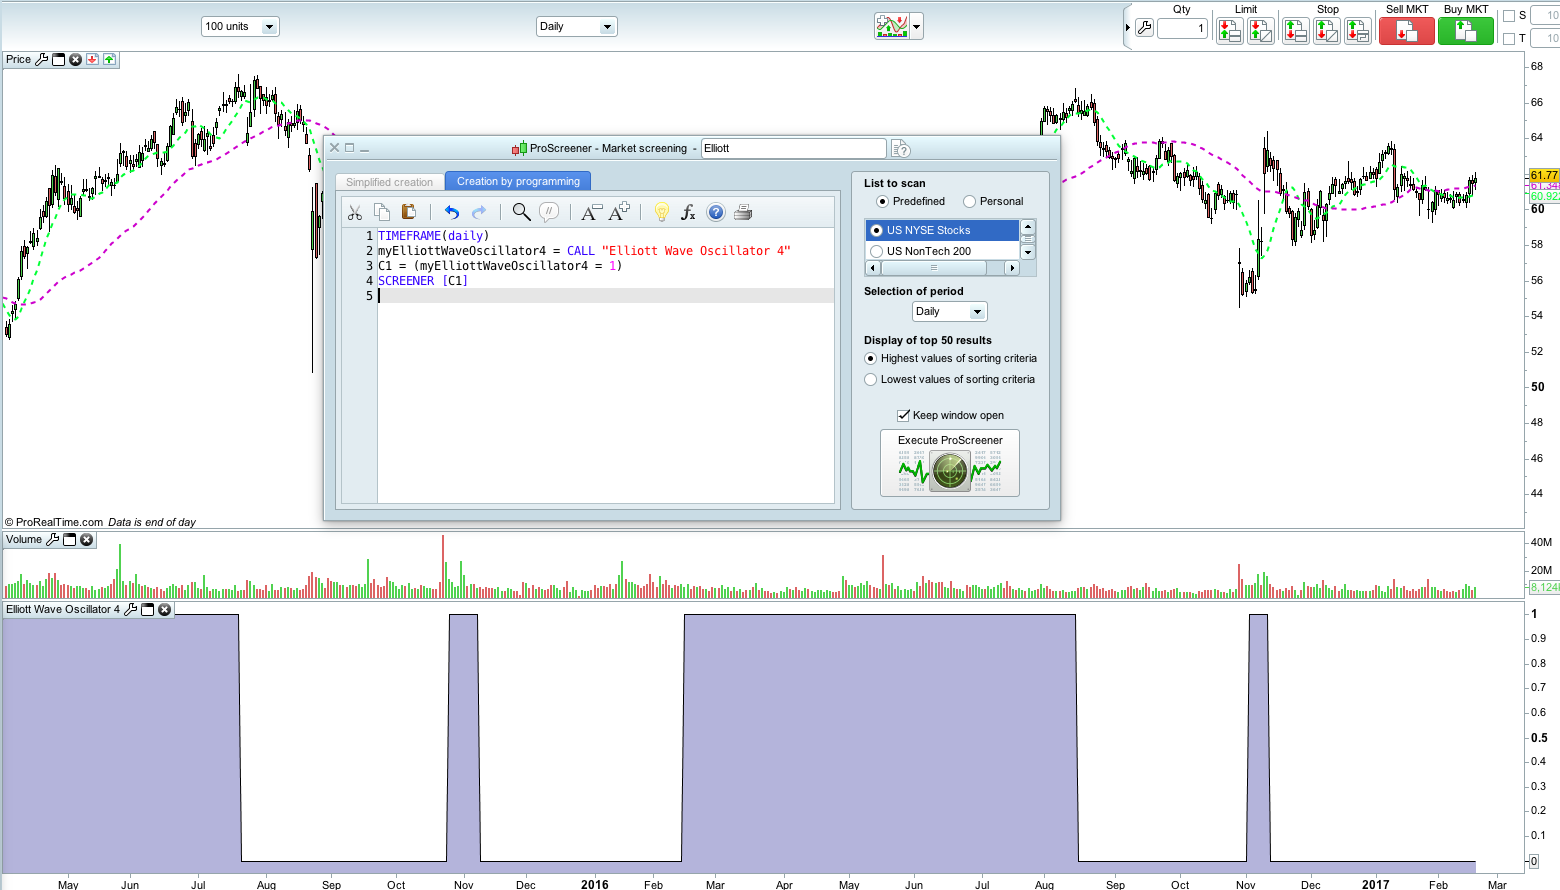
So I created the indicator (Elliot Wave Oscillator 4) which is working fine (You can see it in screenshot).
I transformed the indicator to be a binary oscillator to identify Impulse Wave (=1) and Corrective Wave (=0)
I just want to have a screener which is identifying all shares in the Impulse Wave, so nothing too complicated here.
TIMEFRAME(daily)
myElliottWaveOscillator4 = CALL "Elliott Wave Oscillator 4"
C1 = (myElliottWaveOscillator4 = 1)
SCREENER [C1]
(Elliott Wave Oscillator 4 is my indicator)
When I run the screener, it gives me a lot of shares in the list, but even a lot which my indicator shows me 0 (Corrective Wave).
So I’m confuse now.
Something obvious that I did wrong? Any help?
Try to copy/paste whole indicator code into the screener one and see what happens.
Please, verify if you have real time data feed for the shares lists you are trying to get results.