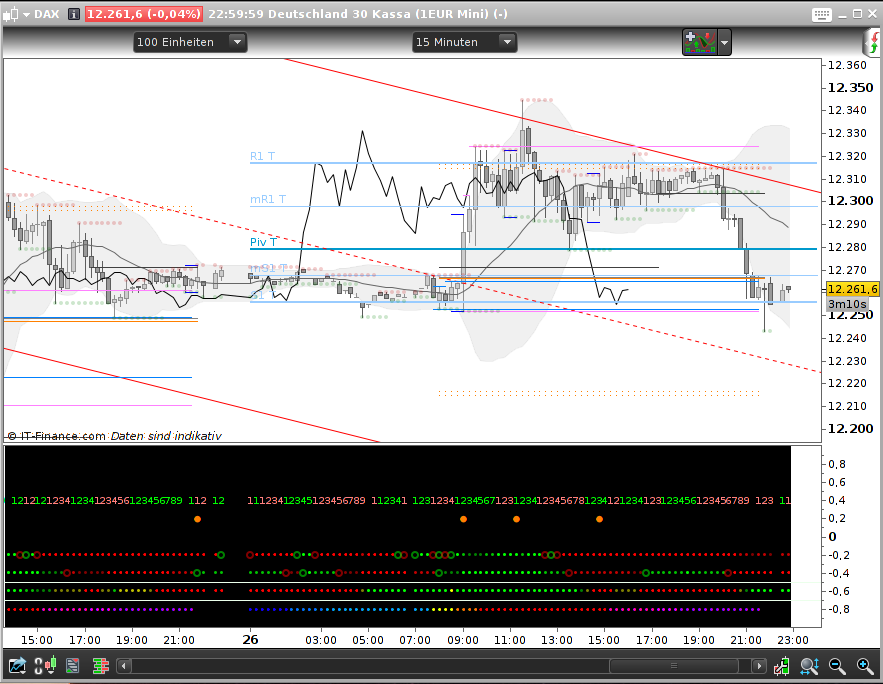
As I do not robot and my bar chart is already covered with all kind of lines – and additionally my screen size is limited – I needed a way to get rid of all those extra windows below the chart. So here is my Dot Board solution. It is modularized, so one can simply add another module line for own needs (well, I myself want some more).
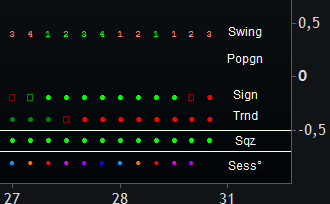
On the picture you see how it is built up: we go from the most general information at the bottom up to the very special information for a single candle.
- market session times
- squeeze or not
- accumulated trend
- (one way of) trading signal
- (this line is still unused)
- PopGun and candle marker – well I don’t use much candles
- swing teller
Maybe you can make use of it and want to add your own module to it – or you just want a standalone module (that’s a version I use for testing before I integrate it into my Dot Board). For the main board the code is just too long with all the comments in it, that would bomb the site, therefore I attach that just for importing. The code below is for the standalone market session.
Feel free to change and/or add what you like.
// =========================== general section Begin ====================

// =========================== Standalone test mark =====================
// --- delete this when copied into the DotBoard                        =
BGred = 0                                                            // =
BGgreen = 0                                                          // =
BGblue = 0                                                           // =
// =========================== Standalone test mark =====================

// --- add this to the general section
//     create an extern variable type boolean
// --- options to turn a line on/off
ShowSessions=1         // for IndiNo=0 very bottom position


// =========================== Standalone test mark =====================
// --- delete this when copied into the DotBoard                        =
LowLineOffset = -0.8                                                 // =
IndiLineOffsetAdd = 0.2                                              // =
BACKGROUNDCOLOR(BGred,BGgreen,BGblue)                                // =
// =========================== Standalone test mark =====================


// =========================== general section End ======================


// =========================== indicator section Begin ==================
// ============ Indicator 0 Begin
// === mark market session periods
// --- see also: @ Noobywan https://www.prorealcode.com/topic/market-session/#post-40397
// --- refs: https://en.wikipedia.org/wiki/List_of_stock_exchange_opening_times
//           https://en.wikipedia.org/wiki/List_of_stock_exchanges
IndiNo=0

IF ShowSessions THEN
IndiLine = IndiLineOffsetAdd*IndiNo + LowLineOffset
// --- conditions
Session1 = (time>=080000 and time<090000 )   // 08:00-09:00 yellow EU pre
Session2 = (time>=090000 and time<100000 )   // 09:00-10:00 orange EU
Session3 = (time>=100000 and time<153000 )   // 10:00-15:30 red EU+GB
Session4 = (time>=153000 and time<173000 )   // 15:30-17:30 magenta EU+GB+US
Session5 = (time>=173000 and time<183000 )   // 17:30-18:30 darkmagenta GB+US
Session6 = (time>=183000 and time<220000 )   // 18:30-22:00 violet US
// --- note: this one paints overnight, so we need 22-00 and 00-2
// 22:00-02:00 darkblue ---- nothing, just to make it complete
Session7 = (time>=220000 and time<000000 ) OR (time>=000000 and time<020000 )
Session8 = (time>=020000 and time<033000 )   // 02:00-03:30 blue JP/AU
Session9 = (time>=033000 and time<080000 )   // 03:30-08:00 lightblue JP/AU+HK
// --- painting
// --- each if..endif on its own to make deleting easier
IF Session1 THEN
DRAWTEXT("▪",barindex,IndiLine) coloured(255,255,0) // 08:00-09:00 yellow EU pre
ENDIF
IF Session2 THEN
Drawtext("▪",barindex,IndiLine) coloured(255,112,0) // 09:00-10:00 orange EU
ENDIF
IF Session3 THEN
Drawtext("▪",barindex,IndiLine) coloured(255,0,0)   // 10:00-15:30 red EU+GB
ENDIF
IF Session4 THEN
Drawtext("▪",barindex,IndiLine) coloured(255,0,192) // 15:30-17:30 magenta EU+GB+US
ENDIF
IF Session5 THEN
Drawtext("▪",barindex,IndiLine) coloured(240,0,255) // 17:30-18:30 darkmagenta GB+US
ENDIF
IF Session6 THEN
Drawtext("▪",barindex,IndiLine) coloured(176,0,255) // 18:30-22:00 violet US
ENDIF
IF Session7 THEN
Drawtext("▪",barindex,IndiLine) coloured(16,0,255)  // 22:00-02:00 darkblue ----
ENDIF
IF Session8 THEN
Drawtext("▪",barindex,IndiLine) coloured(0,112,255) // 02:00-03:30 blue JP/AU
ENDIF
IF Session9 THEN
Drawtext("▪",barindex,IndiLine) coloured(0,160,255) // 03:30-08:00 lightblue JP/AU+HK
ENDIF
ENDIF
// ============ Indicator 0 End
// =========================== indicator section End ====================

// =========================== Standalone test ending mark ==============
// --- delete this when copied into the DotBoard                        =
RETURN                                                                //=
// =========================== Standalone test ending mark ==============
Hope I forgot nothing.