Hello everyone! 😊
Im having a problem and I wonder if some of you smart guys have an idea to fix it?
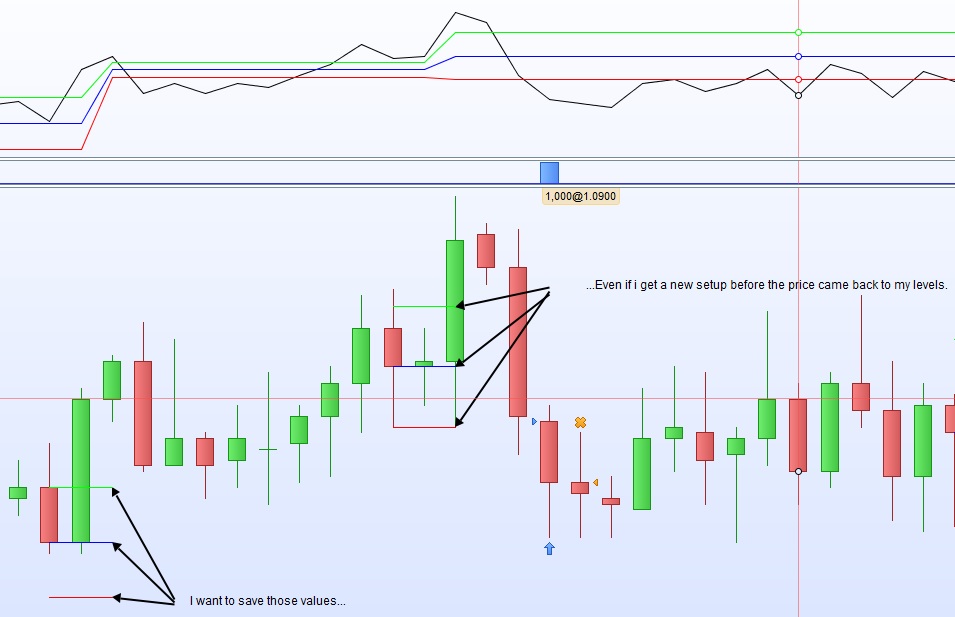
I have made a simple program that goes long if the price returns back to a price when a green bar open on the same price as the previous red bar was closing and then follows by a new green bar.
Is there any way to save those values of StopLoss, BuyLevel and TakeProfit even if a new setup is coming before the price goes back to those levels? By now those values is changing as soon a new setup appears.
Ive been trying with count a couple of patterns to save around 3 different levels. But it is always the last one who appeared that the program is buying with.
It would be great to have the 5 latest patterns values saved until the price coming back there.
Do someone have an idea how to make it work? Should I use time limit or the date fuction maybe?
Hopefully you understand what im meaning even if its hard to explain with my bad English. 😊
Heres the code and a picture that maybe makes it a little bit easier to understand.
defparam cumulateorders=false


//TimeFrame
timeframe(240 minutes)

GreenBar = Close>Open //Its a green bar.
RedBar = Open>Close //Its a red bar.
SameLevelGreen = Open[1]=Close[2] //Current bar is on the same level as the one before.
Setup = GreenBar[0] and GreenBar[1] and SamelevelGreen and RedBar[2] //Setup.


//Setting the levels.
If Setup then
BuyLevel = Open[0]
StopLoss = Low[0]
TakeProfit = (BuyLevel-StopLoss)+BuyLevel
endif


//TimeFrame
timeframe(default)

// Conditions to enter long positions.
IF NOT LongOnMarket AND close crosses under BuyLevel and close > StopLoss then
BUY 1 CONTRACT AT MARKET
ENDIF

// Conditions to exit long positions.
IF LongOnMarket AND close crosses under StopLoss or close crosses over TakeProfit THEN
SELL AT MARKET
ENDIF

graph close as "Price"
graph BuyLevel coloured(0,0,255) as "BuyLevel"
graph TakeProfit coloured(0,255,0) as "TP"
graph StopLoss coloured(255,0,0) as "StopLoss"
Thanks for any advices!