Hey guys!
When i trade manually I use the RSI indicator with self adjusting bands tho it´s much more accurate than the standard RSI. Is there someone who whant to help me code a automatic trading with this indicator.
Something that i think had been nice is that for example: To buy long = Rsi have to be 28 and when it goes up to 31 then buy long.
And the same for short. First 72 and when it crosses under 69 then sellshort.
Anyone who has an idea how to do this? 🙂
Ok so what you are thinking about is a trading strategy that :
SELLSHORT when RSI crosses under the higher band and BUY when RSI crosses over the lower band? Am I right?
Thanks for your response Nicolas.
That´s right. I want the code to registrate when price hits rsi 32 and after that have happened and when price hits rsi 28 i want it to buy long. – Exit long when rsi hits 70.
And I want the code to registrate when price hits rsi 72 and after when it hits rsi 69 then sellshort. Exit short when rsi hits 30.
I think that I have seen a similar code somewhere before but I don´t remember where, the big difference as I see it is also that I want to do it with RSI with self adjusting band.
Ok so it’s a bit more complicated than a simple cross of the higher and lower bands. If you need to “registrate” that RSI has already visit a level before taking the decision to launch a trade, we need to make a loop in the past to see if it’s true. So what we also need is how much bars in the past would you like to fetch is the RSI has visited the 72 level for example?
Hmm… good question. I dont know. It feels like something we have to test until we come up with something reasonable. But if we start with five bars then we have something to work with.
Ok, it were just a simple question. I’ll add a variable we can change for testing purpose. It’s on my list.
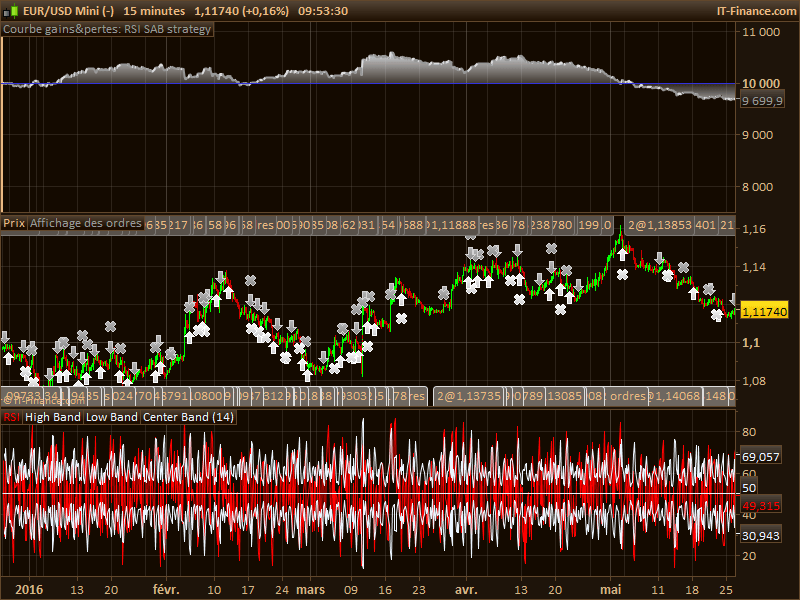
Hello, here is the code of this strategy. I like mean reversion, this is my favourite concept in trading, I’m not so in love with trend following I must admit.
Your idea to count how much bars were above or below the auto-adjusted bands which act as dynamic overbought/oversold levels is quiet interesting. Please find below and attached the code. I let you test and propose improvement if any.
defparam cumulateorders = false

//parameters
P = 14 //RSI period
dev = 1.8 //deviation factor
minbarcount = 5 //quantity of bars that the RSI needs to be above or below its bands

//RSI SAB
rsiplus = RSI[P](close)
bsup = 50+ (dev*STD(rsiplus))
binf = 50 - (dev*STD(rsiplus))

//RSI above buylevel and selllevel count
countB = 0
countS = 0
for i = 0 to minbarcount do
  if rsiplus[i]>bsup[i] then
   countB=countB+1
  elsif rsiplus[i]<binf[i] then
   countS=countS+1
  endif
next

//case BUY
if rsiplus crosses over binf and countS>=minbarcount then
 BUY 1 SHARE AT MARKET
endif

if longonmarket and rsiplus>=70 then
 SELL AT MARKET
endif

//case SELL
if rsiplus crosses under bsup and countB>=minbarcount then
 SELLSHORT 1 SHARE AT MARKET
endif

if shortonmarket and rsiplus<=30 then
 EXITSHORT AT MARKET
endif
Hello again!
Sorry for late answer. Thanks alot! I´ve looked at the code and it looks good. If you switch buy-sell with sellshort-exitshort you will get a better result.
I came up with an another idea that i think will work better.
Since the self adjusting Rsi adjust its upper and lower band when the price is oversold or overbought it dosen´t really make sense to have any RSI numbers in the code. It should be something like=
//Longside
If price cross under lowerband and within 5 bars cross over lowerband then
Buy one contract
If price cross over upperband then
Sell one contract
//Shortside
If price cross over upperband and within 5 bars cross under upperband then
Sellshort one contract
If price cross under lowerband then
Exitshort one contract
What do you think about that?
Well, it would not make a lot of difference I believe, but here is the code changed accordingly to this modified exit rule:
defparam cumulateorders = false

//parameters
P = 14 //RSI period
dev = 1.8 //deviation factor
minbarcount = 5 //quantity of bars that the RSI needs to be above or below its bands

//RSI SAB
rsiplus = RSI[P](close)
bsup = 50+ (dev*STD(rsiplus))
binf = 50 - (dev*STD(rsiplus))

//RSI above buylevel and selllevel count
countB = 0
countS = 0
for i = 0 to minbarcount do
  if rsiplus[i]>bsup[i] then
   countB=countB+1
  elsif rsiplus[i]<binf[i] then
   countS=countS+1
  endif
next

//case BUY
if rsiplus crosses over binf and countS>=minbarcount then
 BUY 1 SHARE AT MARKET
endif

if longonmarket and rsiplus>=bsup then
 SELL AT MARKET
endif

//case SELL
if rsiplus crosses under bsup and countB>=minbarcount then
 SELLSHORT 1 SHARE AT MARKET
endif

if shortonmarket and rsiplus<=binf then
 EXITSHORT AT MARKET
endif