I coded a little snippet that can be added to the bottom of any strategy that you are back testing that returns a score for ‘Returns Over Maximum Draw Down’ and thought that I would share it here in case it is of any use to anyone.
Return Over Maximum Draw Down (RoMaD) is simply a ratio calculated by dividing the current profit by the biggest draw down that a strategy has ever seen (so the biggest all time fall in equity). This simple ratio is a good indicator of strategy quality. The higher the number the better the strategy.
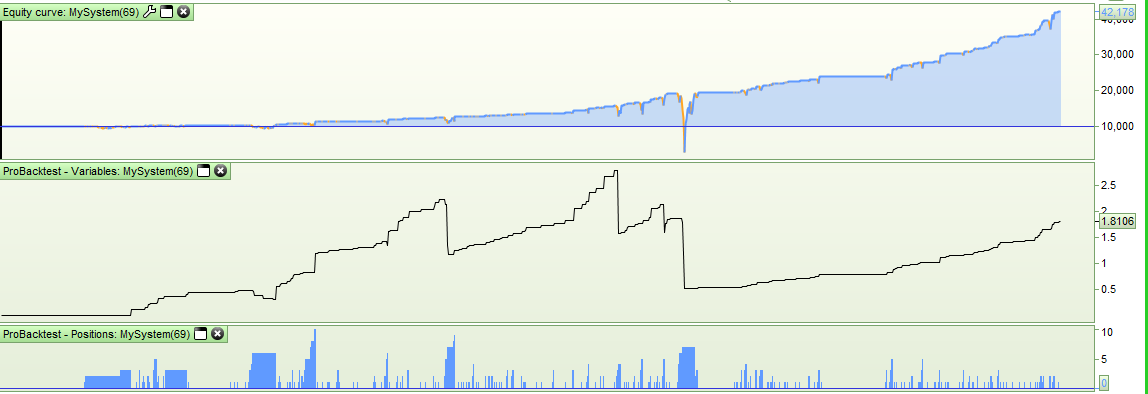
In the first attached image it can be seen how RoMaD has changed over the history of the strategy and how the big drawdown in 2001 has resulted in a pretty poor score of just 1.8106. (Return is only 1.8106 times the size of the biggest draw down).
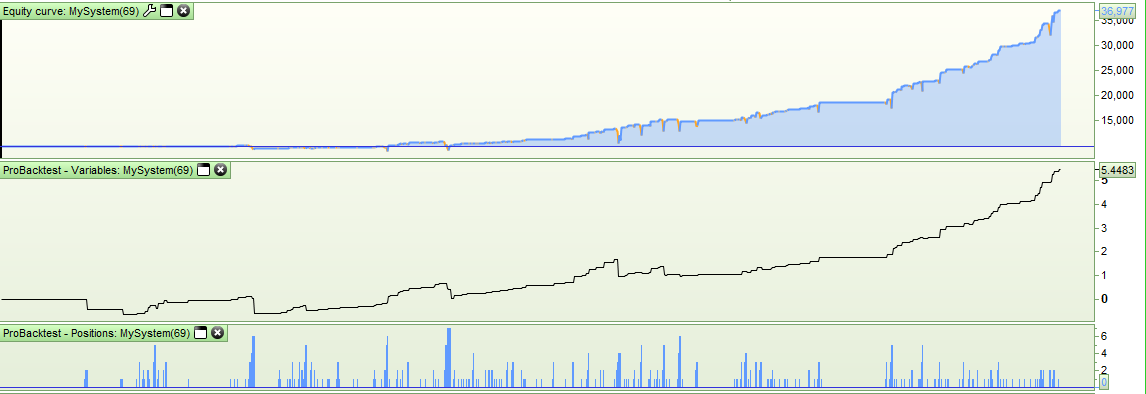
In the second attached image it can be seen that with the addition of an extra condition to close positions the RoMaD score has increased to 5.4483.
Here is the code to add to your strategies:
maxstratprofit = max(maxstratprofit, strategyprofit)

if longonmarket then
runningequity = strategyprofit - ((positionprice - low) * countofposition)
MaD = max(MaD, maxstratprofit - runningequity)
endif

if shortonmarket then
runningequity = strategyprofit - ((high - positionprice) * abs(countofposition))
MaD = max(MaD, maxstratprofit - runningequity)
endif

RoMaD = strategyprofit / MaD

graph RoMaD
Note: I’ve just coded this and not road tested it at all so if you find any issues please let me know!
Hey yeah good, I like it … thank you!
I’ve added to here Snippet Link Library
How feasible is it to do some yardstick re System Drawdown vs BuyHold Drawdown and even System Return vs Buy and Hold Return?
so if you find any issues please let me know!
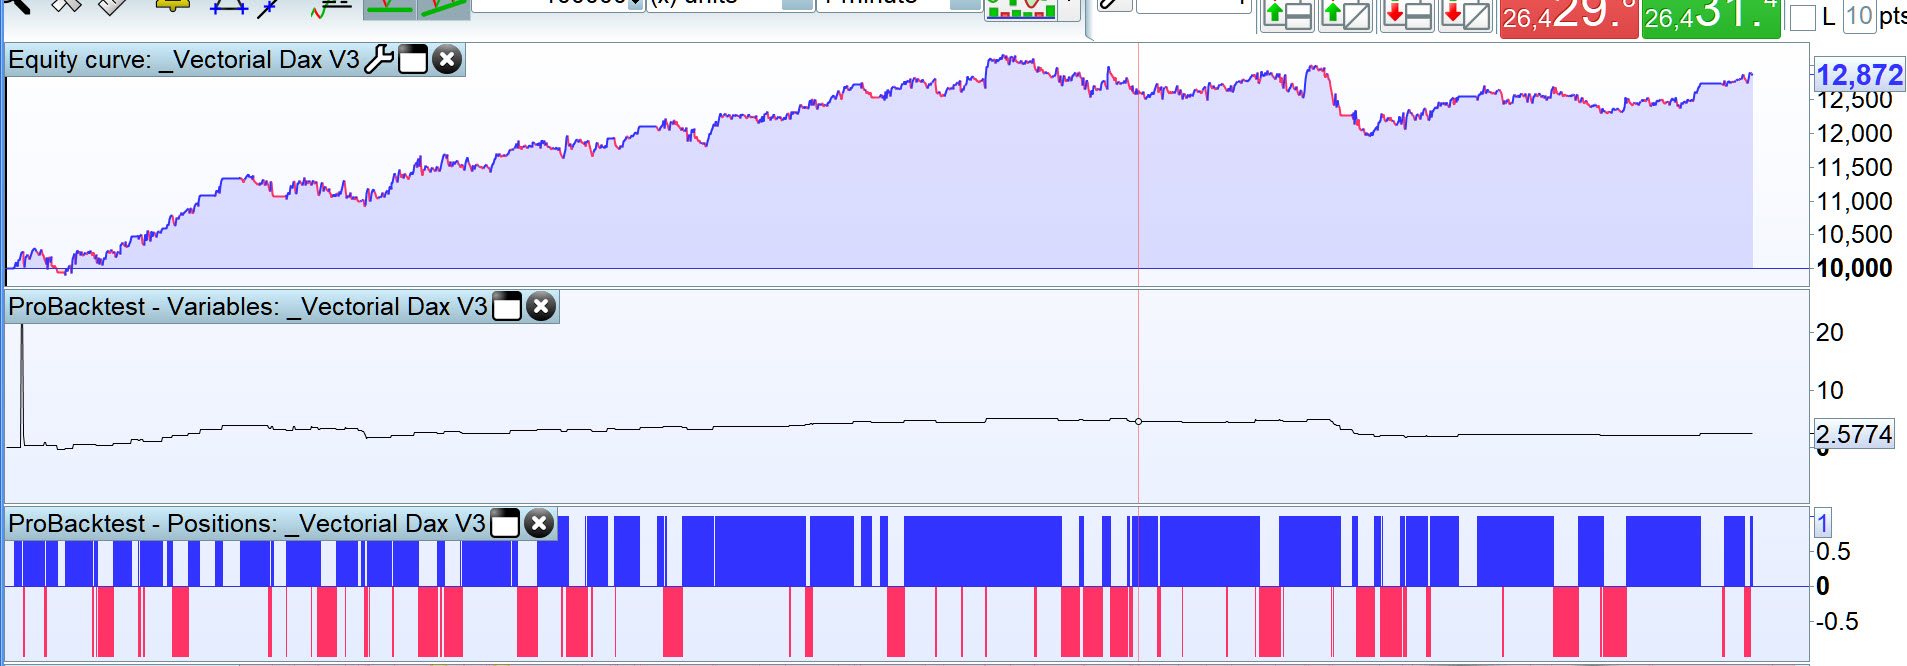
be good if you could exclude the 1st trade as then the y axis scale would not be thrown out by the initial spike?
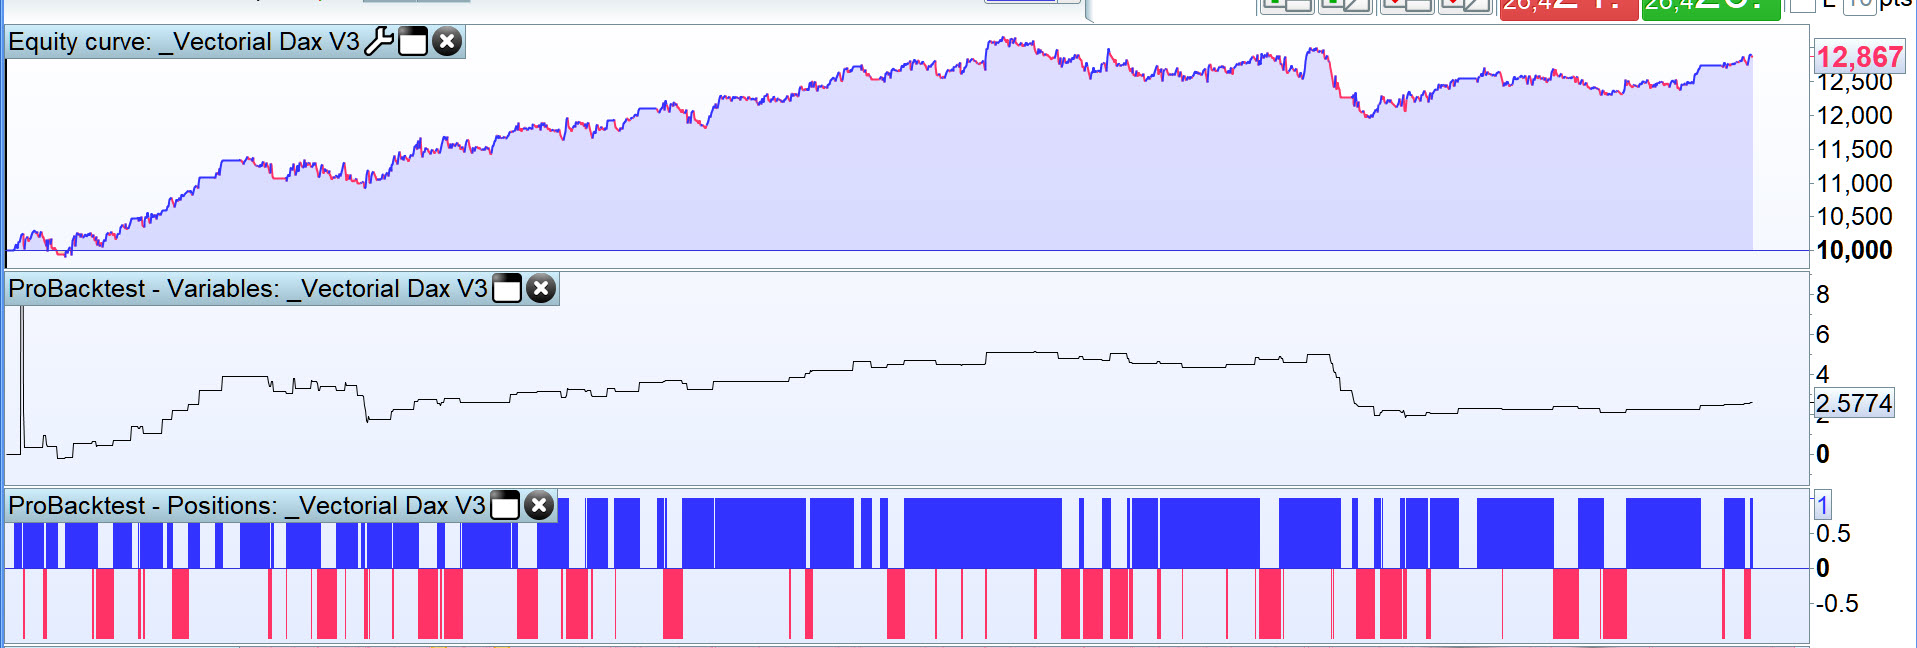
But no sweat as I can always adjust the scale as per the 2nd image
be good if you could exclude the 1st trade
I think it would be preferable to keep it in there as there is always the chance that your first trade is the trade with the biggest all time draw down or is a massively profitable trade and you wouldn’t want to exclude them from the test just to make the scaling look better. At the beginning of the plot the draw down will always likely be big compared to the strategy profit or the strategy profit big compared to the draw down so we have to expect (and learn to embrace) these ugly graphs!
How feasible is it to do some yardstick re System Drawdown vs BuyHold Drawdown and even System Return vs Buy and Hold Return?
Totally feasible – but I need to cook some dinner now so maybe tomorrow I’ll look at it if I get a chance.
It would be nice to have a whole bunch of yardstick measures/scores all in one snippet to add to a strategy code.
A lot of the standard ratios are based on average annual return which is great for daily and weekly based strategies but not much use on anything faster. Any ideas or suggestions on what sort of measurement ratios we could calculate would be great. Nothing too complicated as it was a long time since some of us sat in on a maths lesson!
Your ideas on a postcard please! (or a reply to this topic which might be faster)
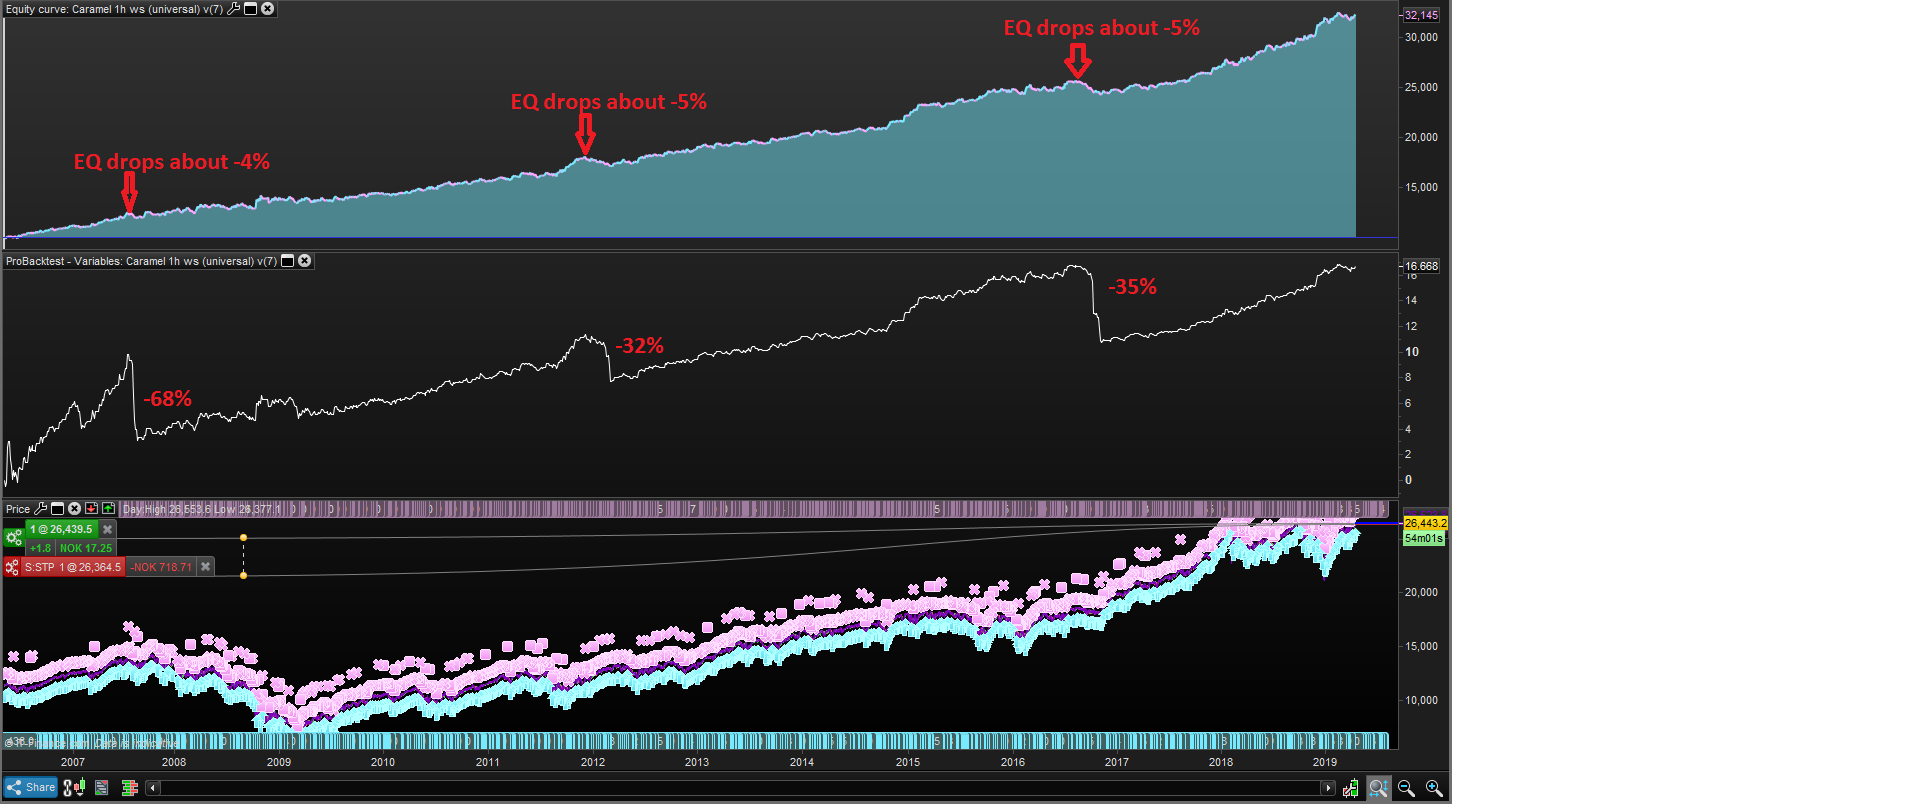
What can u say about my strategy from this?
What causes the big drops in the indicator? like why is the first drop so huge compare to the others?
What causes the big drops in the indicator? like why is the first drop so huge compare to the others?
RoMaD isn’t really about what happens on the journey it is about what the final score is.
If you get a big drawdown on the way to the final score then it is a double whammy to the ratio at that point in time. Your return has dropped and your biggest draw down has increased so you see a massive drop in the ratio. At the end of the day the final score gives you an idea of the balance between the two things – maximum draw down and overall return.
why is the first drop so huge compare to the others
The later drops may be caused by a similar value of Drawdown (as the first drop) but the later Drawdowns will be a smaller % of the return (Gain) at that point.
Still seems weird though as there are drawdowns close that first one and very similar value on the equity curve, but they only cause a small ripple on the RoMaD??
RoMaD isn’t really about what happens on the journey it is about what the final score is.
I think the RoMaD is useful even to gauge the journey along that great looking equity curve of yours Jebus? I can’t help thinking … Ouch! on that first one 🙂 and yet it is barely noticeable on the equity curve?
later Drawdowns will be a smaller % of the return (Gain) at that point.
I woke today thinking that above may be an incorrect statement?
It’s quicker to ask than for me to work it out from the code, so Vonasi does
- MaD = maximum single drawdown?
- OR
- MaD = cumulative drawdown?
And then above spawns another question … how are we measuring drawdown?
If you are busy (fishing for tonight’s dinner! 🙂 ) then whenever you feel like answering is fine. My brain may work on it and / or even work it out from the code! 🙂
MaD = maximum single drawdown
Above is correct, I answered my own question … best way to learn … teach oneself to fish! 🙂
Now I can have fish for my dinner. but I’ll get her indoors to cook it! 🙂
Unfortunately for me ‘her indoors’ (you obviously used to watch Minder too) is a bit over a thousand odd miles away so I’m cooking my own dinner.
Yes MaD (Ma-ximum D-rawdown) is the single largest draw down recorded. The biggest single drop in equity from an equity high ever.
Here is one of your requests. This one calculates RoMaD and also calculates a RoMaD for buy and Hold which I called BuyHoldRoMaD. Obviously this BuyHoldRoMaD is calculated as a long only trade for indices but your strategy that RoMaD is calculated on can be long and short – however you wish to try to beat the market.
It then calculates the ratio which is RoMaD over BuyHoldRoMaD (RoMaDoBaHRoMaD). So if your strategy has a better RoMaD than Buy and Hold RoMaD then the ratio will be above 1. If the RoMaD is worse then its below 1. You can use this ratio to compare strategies performance or just look to see if RoMaD is above BuyHoldRoMaD . The ratio just helps quantify things with a value.
//RoMaD
maxstratprofit = max(maxstratprofit, strategyprofit)

if longonmarket then
runningequity = strategyprofit - ((positionprice - low) * countofposition)
MaD = max(MaD, maxstratprofit - runningequity)
endif

if shortonmarket then
runningequity = strategyprofit - ((high - positionprice) * abs(countofposition))
MaD = max(MaD, maxstratprofit - runningequity)
endif

RoMaD = strategyprofit / MaD


//BuyHoldRoMad
buyholdpositionsize = 1
once firstprice = low
buyandholdequity = ((high - firstprice) * buyholdpositionsize)
maxbuyholdprofit = max(maxbuyholdprofit, buyandholdequity)
once BuyHoldMad = high - low
BuyHoldMaD = max(BuyHoldMaD, (maxbuyholdprofit - low) * buyholdpositionsize)
BuyHoldRoMaD = buyandholdequity / BuyHoldMaD

RoMaDoBaHRoMaD = RoMaD / BuyHoldRoMaD


graph BuyHoldRoMaD
graph RoMaD
graph RoMaDoBaHRoMaD
GraHal – your second suggestion is a little simpler to code. Return over Buy and Hold Return – or RoBaH to you!
This ratio is just the strategy return divided by the buy and hold return. Once again buy and hold is long only but the strategy can be short and long. I forgot to mention the ‘buyholdpositionsize’ variable in the last code I posted (and in this code). This is whatever your initial buy and hold opening position size is.
buyholdpositionsize = 1
once firstprice = low
buyandholdequity = ((high - firstprice) * buyholdpositionsize)

RoBaH = strategyprofit / buyandholdequity

graph RoBaH