Hi Team,
I’ve put together something with Rob’s help over the journey that’ll plot open times and label them. Many thanks for this.
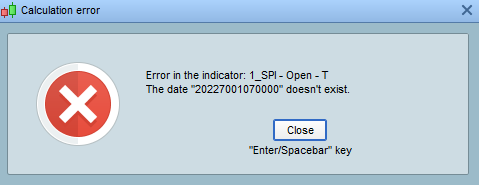
Been great for the past few weeks till the other day where it started to flag an error, complaining about date format.
I shrunk the days to 1 and it’s still having a problem.
Very much a newb here with this and thanks for your patience with me.
Rgds,
INV
defparam drawonlastbaronly=true

defparam calculateonlastbars=100


//
//
//
//Label offsets
//
//
voffset=10+close
voffset1=20+close
voffset2=40+close
//
//
//
//
Time1        = 070000
Time2        = 095000
Time3        = 100000
Time4        = 110000
Time5        = 113000
Time6        = 150000
Time7        = 160000
//
//
//Label Time
//
//
//
//
//
//Time8        = 070000
Time9        = 093000
Time10       = 101500
Time11       = 101500
Time12       = 111500
Time13       = 115000
Time14       = 152000
Time15       = 162000
Time16       = 162000
Time17       = 162500
//
//
NumberOfDays = 1
Time1          = max(0,min(235959,Time1))
Time2          = max(0,min(235959,Time2))
Time3          = max(0,min(235959,Time3))
Time4          = max(0,min(235959,Time4))
Time5          = max(0,min(235959,Time5))
Time6          = max(0,min(235959,Time6))
Time7          = max(0,min(235959,Time7))
//
Time9          = max(0,min(235959,Time9))
Time10         = max(0,min(235959,Time10))
Time11         = max(0,min(235959,Time11))
Time12         = max(0,min(235959,Time12))
Time13         = max(0,min(235959,Time13))
Time14         = max(0,min(235959,Time14))
Time15         = max(0,min(235959,Time15))
Time16         = max(0,min(235959,Time16))
Time17         = max(0,min(235959,Time17))
//
NumberOfDays   = max(0,min(999,NumberOfDays))
MyDD           = Day
MyMM           = Month
MyYY           = Year
//
DayCount       = NumberOfDays
While DayCount > 0 DO
//
// make sure it’s the same number of digits for days < 10
If MyDD < 10 Then
MyDate = (MyYY * 10000) + (MyMM * 1000) + MyDD
Else
MyDate = (MyYY * 10000) + (MyMM * 100) + MyDD
Endif
// last step, add hours
a = (MyDate * 1000000) + Time1
b = (MyDate * 1000000) + Time2
c = (MyDate * 1000000) + Time3
d = (MyDate * 1000000) + Time4
e = (MyDate * 1000000) + Time5
f = (MyDate * 1000000) + Time6
g = (MyDate * 1000000) + Time7
//
// plot the lines
//
drawvline(datetobarindex(a))Coloured  (105,105,105)style(dottedline,1)
drawvline(datetobarindex(b))Coloured  (105,105,105)style(dottedline,1)
drawvline(datetobarindex(c))Coloured  (105,105,105)style(dottedline,1)
drawvline(datetobarindex(d))Coloured  (105,105,105)style(dottedline,1)
drawvline(datetobarindex(e))Coloured  (105,105,105)style(dottedline,1)
drawvline(datetobarindex(f))Coloured  (105,105,105)style(dottedline,1)
drawvline(datetobarindex(g))Coloured  (105,105,105)style(dottedline,1)
//
//
//
// draw the lables in - removed
//
//
//x = (MyDate * 1000000) + Time9
//i = (MyDate * 1000000) + Time10
//j = (MyDate * 1000000) + Time11
//k = (MyDate * 1000000) + Time12
//l = (MyDate * 1000000) + Time13
//m = (MyDate * 1000000) + Time14
//n = (MyDate * 1000000) + Time15
//o = (MyDate * 1000000) + Time16
//p = (MyDate * 1000000) + Time17
//
//
//
//drawtext("SPI",datetobarindex(x),voffset1,SansSerif,standard,14)Coloured (000,100,000)
//drawtext("TSE",datetobarindex(i),voffset,SansSerif,standard,14)Coloured (000,100,000)
//drawtext("ASX",datetobarindex(j),voffset1,SansSerif,standard,14)Coloured (000,100,000)
//drawtext("SGX",datetobarindex(k),voffset,SansSerif,standard,14)Coloured (000,100,000)
//drawtext("SSE",datetobarindex(l),voffset,SansSerif,standard,14)Coloured (000,100,000)
//drawtext("SSE",datetobarindex(m),voffset,SansSerif,standard,14)Coloured (000,100,000)
//drawtext("FDAX",datetobarindex(n),voffset,SansSerif,standard,14)Coloured (000,100,000)
//drawtext("FTEU",datetobarindex(o),voffset1,SansSerif,standard,14)Coloured (000,100,000)
//drawtext("ASXCL",datetobarindex(p),voffset2,SansSerif,standard,14)Coloured (000,100,000)
//
//
//

// get ready to build tomorrow’s date, if needed
//
// compute tomorrow’s date (could be a new month, even a new year)
//
// 1. compute the last day of the month
LastDay = 31
// 2. it’s max 30 on a few months
If MyMM = 4 or MyMM = 6 or MyMM = 9 or MyMM = 11 Then
LastDay = 30
Endif
// 3. it’s max 28 days in February, 29 on a leap year
If MyMM = 2 Then
LastDay = 28
If Year MOD 4 = 0 Then
If Year MOD 100 = 0 Then
If Year MOD 400 = 0 Then
LastDay = 29
Endif
Else
LastDay = 29
Endif
Endif
Endif
//
MyDD = MyDD + 1
// 4. if it’s greater than LastDay it’s the next month
If MyDD > LastDay Then
MyDD = 1
MyMM = MyMM + 1
// 5. if it’s greater than 12 it’s a new year
If MyMM > 12 Then
MyMM = MyMM - 12
MyYY = MyYY + 1
Endif
Endif
//
DayCount = DayCount - 1     //one day has been plotted
Wend
RETURN