Hello All,
Just jumped on PRT and had a quick look – well more than a quick look but I’m short on basic coding skills tbh.
What I’d like to do is draw in 2 vertical lines:
8.00am
9.00am
I’d like these to be visible on future dates 1sec / tick chart ahead of time.
Barindex gets the job done in dynamic fashion but it’d like to see future vlines on upcoming periods week in adv. Been drawing them in manually, before the session and it becomes a little tedious!
Datetolastbarindex gets this done perfectly, many thanks for having this. However I need to modify the code manually (add future dates). I could do this weekly and would be better than nothing but does a param.(code) exist I can add that will draw these periods in, say for the next week or month perhaps ongoing even.
Please forgive my ignorance on this, it’s baby steps for me right now … 🙂
This is what’s been hacked together so far that works in 1sec interv:
defparam drawonlastbaronly=true

mydate = 20210910080000


drawvline(datetobarindex(20210910))style(dottedline,2)
drawvline(datetobarindex(20210913))style(dottedline,2)
drawvline(datetobarindex(20210914))style(dottedline,2)
drawvline(datetobarindex(20210915))style(dottedline,2)
drawvline(datetobarindex(20210916))style(dottedline,2)
drawvline(datetobarindex(20210917))style(dottedline,2)


drawvline(datetobarindex(20210910090000))style(dottedline,2)
drawvline(datetobarindex(20210913090000))style(dottedline,2)
drawvline(datetobarindex(20210914090000))style(dottedline,2)
drawvline(datetobarindex(20210915090000))style(dottedline,2)
drawvline(datetobarindex(20210916090000))style(dottedline,2)
drawvline(datetobarindex(20210917090000))style(dottedline,2)

return
Cheers,
INV
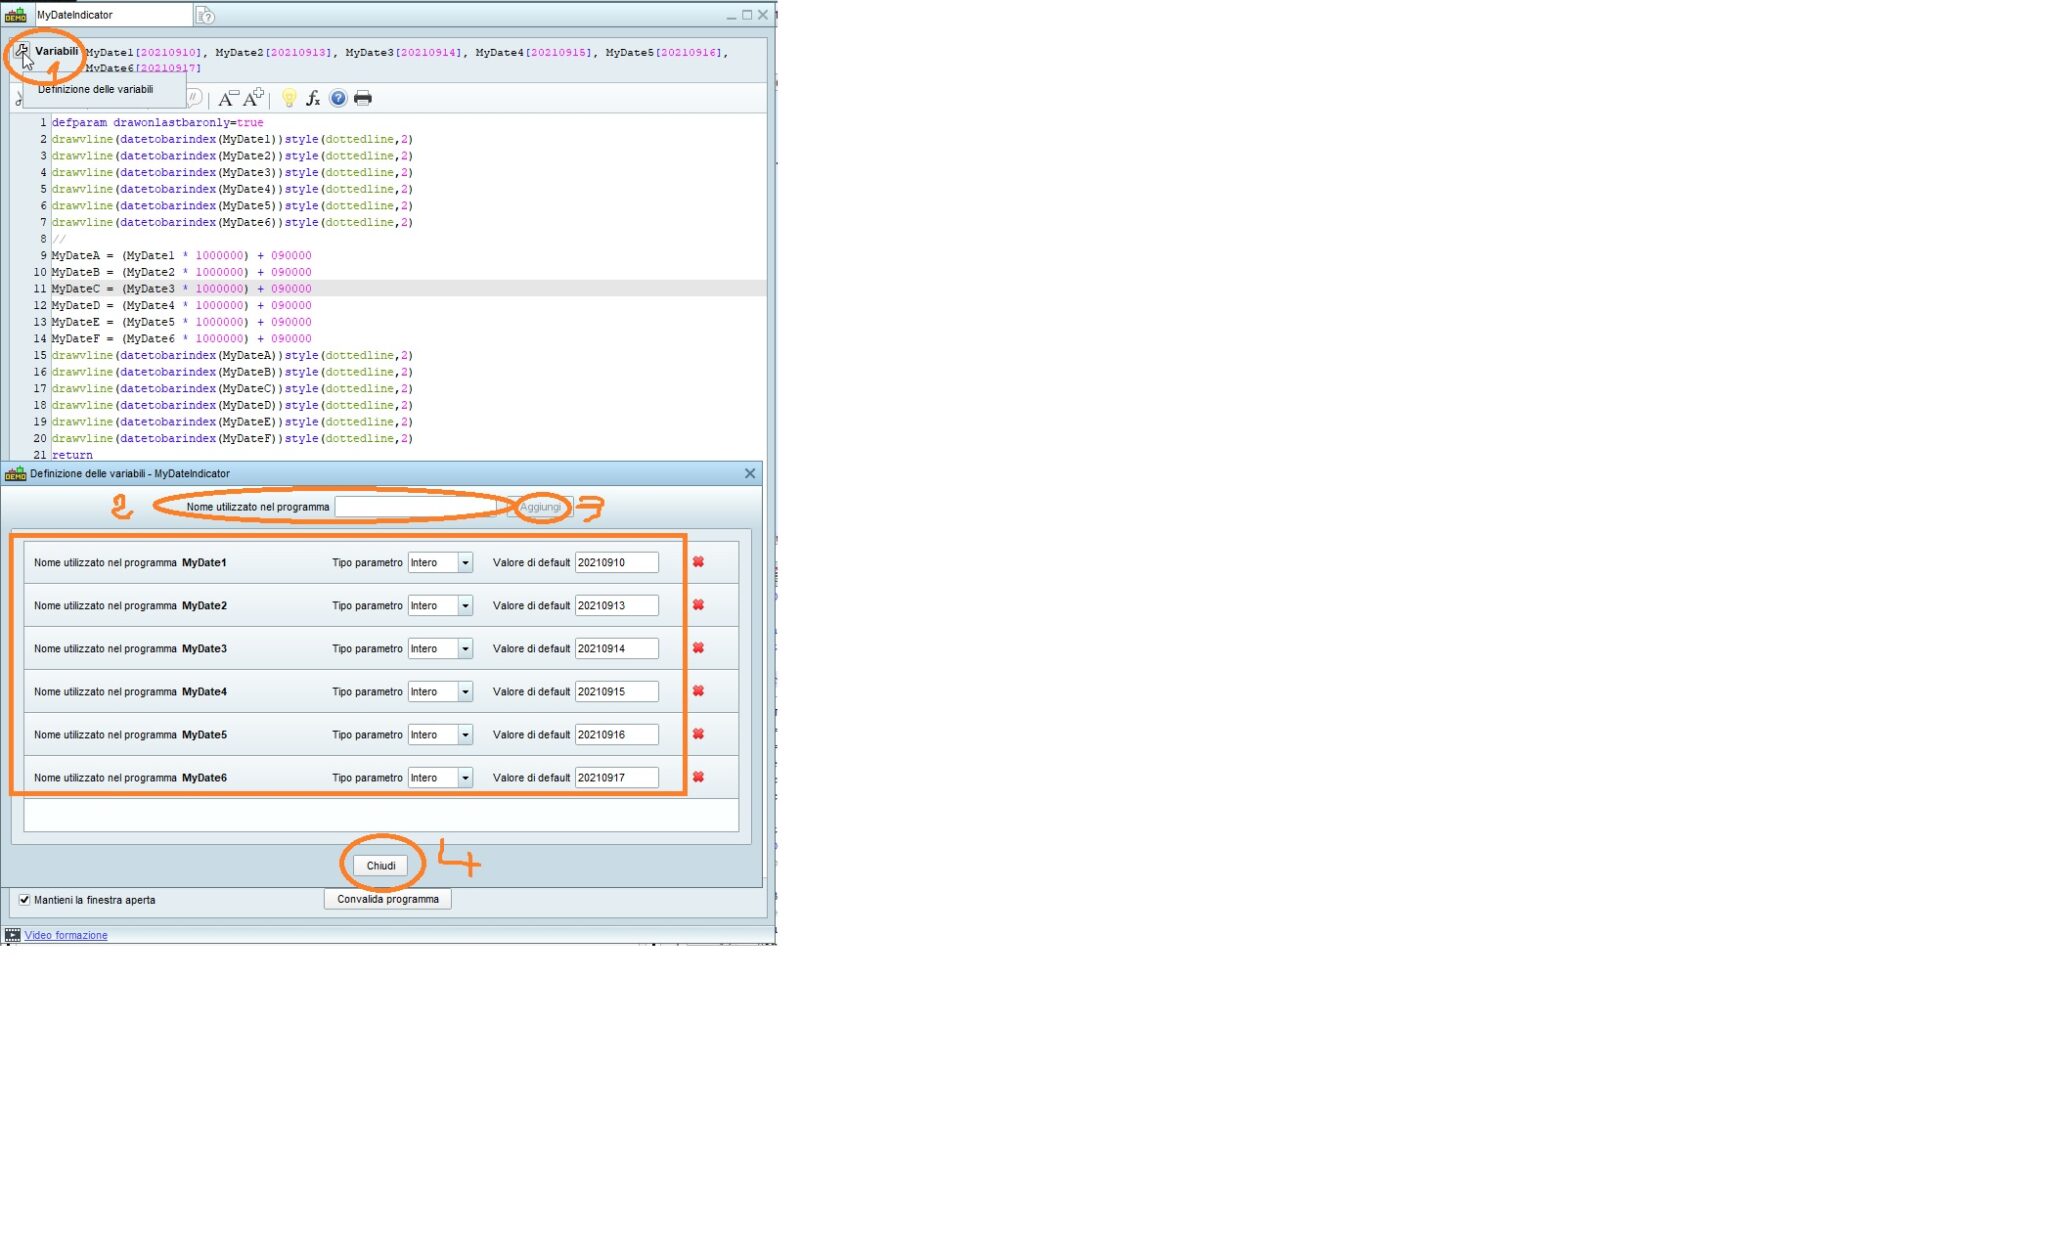
You can declare variables to be set using the indicator properties (settings), as from my screenshot.
This is the code (but I suggest that you download the ITF where those variables have already been added):
defparam drawonlastbaronly=true
drawvline(datetobarindex(MyDate1))style(dottedline,2)
drawvline(datetobarindex(MyDate2))style(dottedline,2)
drawvline(datetobarindex(MyDate3))style(dottedline,2)
drawvline(datetobarindex(MyDate4))style(dottedline,2)
drawvline(datetobarindex(MyDate5))style(dottedline,2)
drawvline(datetobarindex(MyDate6))style(dottedline,2)
//
MyDateA = (MyDate1 * 1000000) + 090000
MyDateB = (MyDate2 * 1000000) + 090000
MyDateC = (MyDate3 * 1000000) + 090000
MyDateD = (MyDate4 * 1000000) + 090000
MyDateE = (MyDate5 * 1000000) + 090000
MyDateF = (MyDate6 * 1000000) + 090000
drawvline(datetobarindex(MyDateA))style(dottedline,2)
drawvline(datetobarindex(MyDateB))style(dottedline,2)
drawvline(datetobarindex(MyDateC))style(dottedline,2)
drawvline(datetobarindex(MyDateD))style(dottedline,2)
drawvline(datetobarindex(MyDateE))style(dottedline,2)
drawvline(datetobarindex(MyDateF))style(dottedline,2)
return
Hi Roberto,
I’m not sure 100% but the output to scr is the same as the original post.
I guess I was looking for a bit of code that won’t require me to add dates as we progress through the week manually, the two examples above will cease to plot beyond 2021-09-17 (20210917) for example.
Many thanks again,
inv
I think I got you now.
This will plot Today’s and Tomorrow’s lines at the given hours (not tested):
defparam drawonlastbaronly=true
MyDate = Date
MyDD   = Day
MyMM   = Month
MyYY   = Year
//
// plot today’s lines (add hours)
//
x = (MyDate * 1000000) + 080000
y = (MyDate * 1000000) + 090000
drawvline(datetobarindex(x))style(dottedline,2)
drawvline(datetobarindex(y))style(dottedline,2)
//
// plot tomorrow’s lines
//
// compute tomorrow’s date (could be a new month, even a new year)
//
// compute the last day of the month
LastDay = 31
// it’s max 30 on a few months
If MyMM = 4 or MyMM = 6 or MyMM = 9 or MyMM = 11 Then
   LastDay = 30
Endif
// it’s max 28 days in February, 29 on a leap year
If MyMM = 2 Then
   LastDay = 28
   If Year MOD 4 = 0 Then
      If Year MOD 100 = 0 Then
         If Year MOD 400 = 0 Then
            LastDay = 29
         Endif
      Else
         LastDay = 29
      Endif
   Endif
Endif
// build tomorrow’s date
MyDD = MyDD + 1
// if it’s greater than LastDay it’s the next month
If MyDD > LastDay Then
   MyDD = 1
   MyMM = MyMM + 1
   // if it’s greater than 12 it’s a new year
   If MyMM > 12 Then
      MyMM = MyMM - 12
      MyYY = MyYY + 1
   Endif
Endif
// make sure it’s the same number of digits for days < 10
If MyDD < 10 Then
   MyDate = (MyYY * 10000) + (MyMM * 1000) + MyDD
Else
   MyDate = (MyYY * 10000) + (MyMM * 100) + MyDD
Endif
// last step, add hours
x = (MyDate * 1000000) + 080000
y = (MyDate * 1000000) + 090000
drawvline(datetobarindex(x))style(dottedline,2)
drawvline(datetobarindex(y))style(dottedline,2)
return
Other days could be added by duplicating the same lines used for Tomorrow’s date (no need to change any of them).
This is the same indicator as above, modified so that it allows to set properties so that the TIMES and the number of DAYS (starting from the current day) can be easily changed.
To plot only ONE line, just set the same TIME for both.
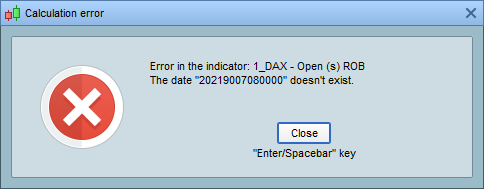
Time can be any value from 000000 to 235959 (240000 doesn’t exist, it’s 000000 the next day). I suggest that you always enter 6 digits for the time , despite the leading 0s will then be dropped.
If you want to stop plotting lines, just use 0 as the number of days (or hide the indicator).
defparam drawonlastbaronly=true
//Time1        = 080000
//Time2        = 090000
//NumberOfDays = 2
Time1          = max(0,min(235959,Time1))
Time2          = max(0,min(235959,Time2))
NumberOfDays   = max(0,min(999,NumberOfDays))
MyDD           = Day
MyMM           = Month
MyYY           = Year
//
DayCount       = NumberOfDays
While DayCount > 0 DO
   //
   // make sure it’s the same number of digits for days < 10
   If MyDD < 10 Then
      MyDate = (MyYY * 10000) + (MyMM * 1000) + MyDD
   Else
      MyDate = (MyYY * 10000) + (MyMM * 100) + MyDD
   Endif
   // last step, add hours
   x = (MyDate * 1000000) + Time1
   y = (MyDate * 1000000) + Time2
   //
   // plot the lines
   //
   drawvline(datetobarindex(x))style(dottedline,2)
   drawvline(datetobarindex(y))style(dottedline,2)
   //
   // get ready to build tomorrow’s date, if needed
   //
   // compute tomorrow’s date (could be a new month, even a new year)
   //
   // 1. compute the last day of the month
   LastDay = 31
   // 2. it’s max 30 on a few months
   If MyMM = 4 or MyMM = 6 or MyMM = 9 or MyMM = 11 Then
      LastDay = 30
   Endif
   // 3. it’s max 28 days in February, 29 on a leap year
   If MyMM = 2 Then
      LastDay = 28
      If Year MOD 4 = 0 Then
         If Year MOD 100 = 0 Then
            If Year MOD 400 = 0 Then
               LastDay = 29
            Endif
         Else
            LastDay = 29
         Endif
      Endif
   Endif
   //
   MyDD = MyDD + 1
   // 4. if it’s greater than LastDay it’s the next month
   If MyDD > LastDay Then
      MyDD = 1
      MyMM = MyMM + 1
      // 5. if it’s greater than 12 it’s a new year
      If MyMM > 12 Then
         MyMM = MyMM - 12
         MyYY = MyYY + 1
      Endif
   Endif
   //
   DayCount = DayCount - 1     //one day has been plotted
Wend
RETURN
Importing the attached ITF file will spare you from having to add variables.
Wow Robert …. exposes my inabilities nicely … !
I’m going to have a closer look here and see if;
1) I get how it’s come together and;
2) see point 1 again … 😉
I’ll post back over the coming days, might take me a while to get my head around it haha
Many thanks again.
Just letting you know Robert …. calc comes out good, added a third and 4th period for completeness of testing but can’t see that far ahead on 1sec inter., still confident all’s good (the 13th and 14th SEP are there).
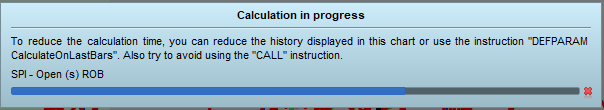
There’s an info message that says some tweaking could improve perf. – it’s specific to my unit count.
The preview is tiny / blurred below so have posted to imgur too.
View post on imgur.com
Thanks for the ongoing support!
Post JPG/PNG pics, not links.
Thank you.
On very small TFs you can’t go ahead much.
Apologies I dropped a .png in but the image was removed upon post – odd.
Here we go again, hope it survives the process!
Looks blurry in preview again, it’s only 7kb.
edit: yay, it worked this time .. 🙂
Just a quick one Robert – all okay on the small time frame, not being able to go so much ahead, a few days is all that’s needed. Was nicer this morning to not housekeep the opens and with upcoming sessions / tomorrows already in place, I’ve had time for another espresso .. !
Not sure if I’ve looked hard enough quite yet to see whether it’ll maintain the “historical” vlines in place (or drop the previous days) – should know more tomorrow and coming sessions.
Thanks again.
Line 1 prevents historical lines from being still in place.
You can comment it out.
When commented out works with up to 30k units. No joy with 100k.
This seems to be a limit when calucating bar indexes using dates.
As a guess not many would find this useful so it mightn’t be a high priority, having said that, the datetolastbar is newish so could be in the pipe maybe 😉
For now a hybrid of the two might work in tandem across both longer and shorter timeframes quite well. As humans we also need to interface with what’s in the tool chest.
Many thanks for all the help, have a safe and good one … 🙂