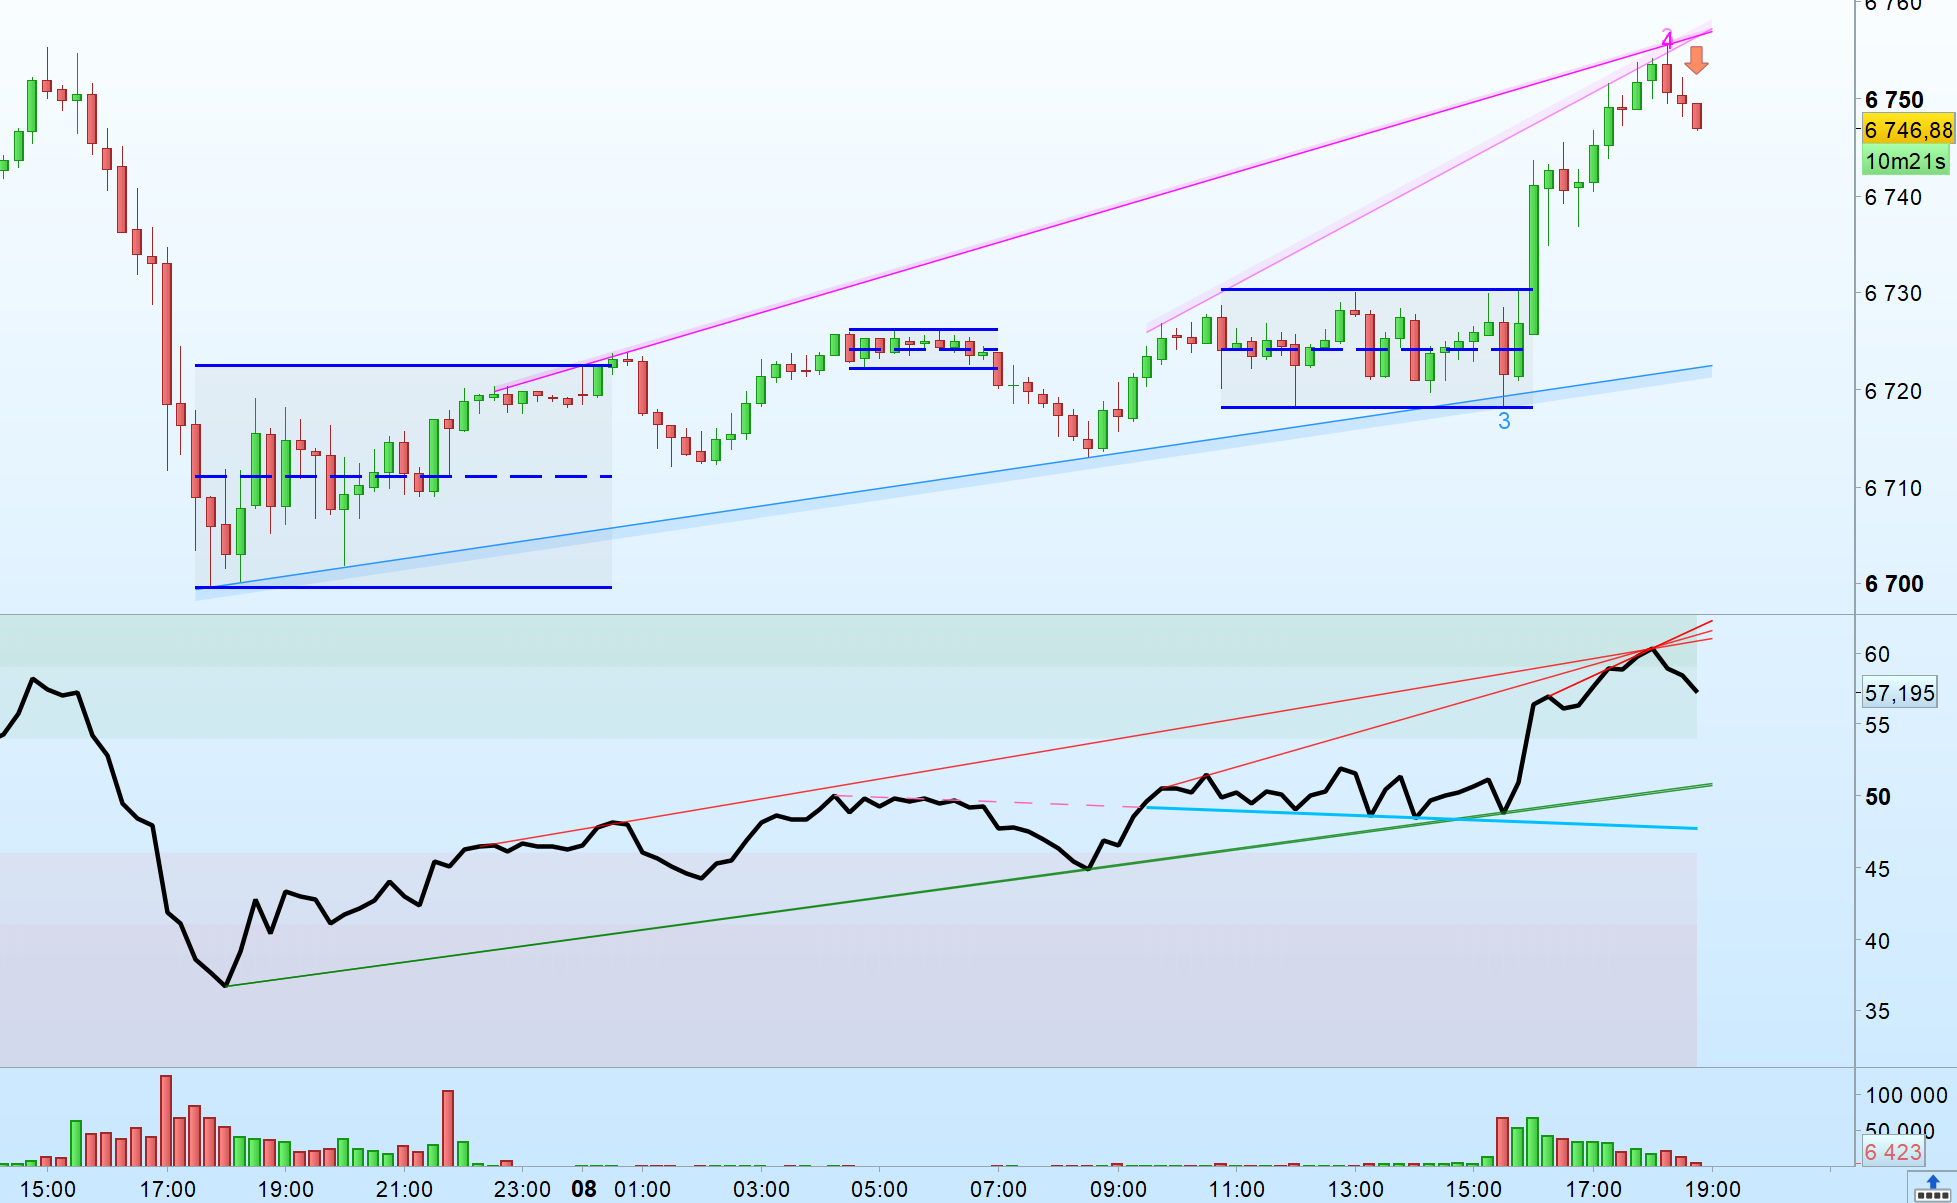
As its name says, it help detecting sideways market.
DefParam DrawOnLastBarOnly = true

once candleLow = low
once candleHigh = high
once candleOpen = open
once candleClose = close
once insideCandles = 1
once RangeIndex = 0

MyTR = max(Range,max(abs(high - close[1]),abs(low - close[1])))

if high > candleHigh[1] and close <= candleHigh[1] then
candleHigh = high
endif

if low < candleLow[1] and close >= candleLow[1] then
candleLow = low
endif

breakoutCandle = close > candleHigh or close < candleLow
bullishBreak = close > candleHigh[1] and insideCandles[1] >= (minLemgth+1)
bearishBreak = close < candleLow[1] and insideCandles[1] >= (minLemgth+1)

candleMiddle = (candleHigh + candleLow)/2

FiltreBreakoutCandle1 = (Average[2](MyTR[0])>F*Average[20](MyTR[1]) and breakindex>=barindex-1)
FiltreBreakoutCandle2 = 0
FiltreBreakoutCandle3 = 0
If insideCandles>=3 then
upside = insideCandles>=3 and summation[ceil((insideCandles+1)/2)](close>=candleMiddle)=ceil((insideCandles+1)/2)
downside = insideCandles>=3 and summation[ceil((insideCandles+1)/2)](close<=candleMiddle)=ceil((insideCandles+1)/2)
FiltreBreakoutCandle2 = upside or downside
FiltreBreakoutCandle3 = (close >= candleHigh[2] or close <= candleLow[2]) and insideCandles>=2
endif


if breakoutCandle or (filtre and ((FilteringMethod=1 and FiltreBreakoutCandle1) or (FilteringMethod=2 and FiltreBreakoutCandle2) or (FilteringMethod=3 and FiltreBreakoutCandle3))) then //(Average[2](MyTR[0])>F*Average[20](MyTR[1]) and breakindex>=barindex-1)) then

If not breakoutCandle and (filtre and FilteringMethod=2 and FiltreBreakoutCandle2) then
if upside then
candleLow = lowest[ceil((insideCandles+1)/2)](low)
candleHigh = candleHigh
candleOpen = open
candleClose = close
insideCandles = 1
breakindex = barindex
elsif downside then
candleLow = candleLow
candleHigh = highest[ceil((insideCandles+1)/2)](high)
candleOpen = open
candleClose = close
insideCandles = 1
breakindex = barindex
endif

else
candleLow = low
candleHigh = high
candleOpen = open
candleClose = close
insideCandles = 1
breakindex = barindex
endif

If insideCandles[1] >= (minLemgth) and insideCandles = 1 then //and $RangeStart[RangeIndex] = breakindex[1] then
If close > candleHigh[1] then
Drawarrowup(Barindex, Low)
Elsif close < candleLow[1] then
Drawarrowdown(Barindex, High)
Endif

//drawsegment($RangeStart[i],$RangeHigh[i],$RangeStart[i]+$RangeLength[i],$RangeHigh[i])style(dottedline1,2)coloured("blue",255)
//drawsegment($RangeStart[i],$RangeLow[i],$RangeStart[i]+$RangeLength[i],$RangeLow[i])style(dottedline1,2)coloured("blue",255)
Endif

else
insideCandles = insideCandles+1


if insideCandles >= (minLemgth) then

If $RangeStart[RangeIndex] = breakindex then
$RangeLength[RangeIndex] = insideCandles
$RangeHigh[RangeIndex] = candleHigh
$RangeLow[RangeIndex] = candleLow
Else
RangeIndex = RangeIndex + 1
$RangeStart[RangeIndex] = breakindex
$RangeLength[RangeIndex] = insideCandles
$RangeHigh[RangeIndex] = candleHigh
$RangeLow[RangeIndex] = candleLow
Endif

drawsegment(breakindex,candleHigh,barindex+1,candleHigh)style(dottedline1,2)coloured("orange",255)
drawsegment(breakindex,candlelow,barindex+1,candlelow)style(dottedline1,2)coloured("orange",255)
DRAWRECTANGLE(breakindex,candleHigh,barindex+1,candlelow)coloured("orange",20)bordercolor("orange",100)
drawsegment(breakindex,(candleHigh+candlelow)/2,barindex+1,(candleHigh+candlelow)/2)style(dottedline1,2)coloured("orange",255)

endif
endif

Fin = Max(0,RangeIndex-($RangeStart[RangeIndex]=breakindex))

If OnlyLastRange > 0 then
Debut = Max(0,Fin-OnlyLastRange+1+($RangeStart[RangeIndex]=breakindex))
Else
Debut = 0
Endif

If RangeIndex > 1 then
For i = Debut to Fin do
drawsegment($RangeStart[i],$RangeHigh[i],$RangeStart[i]+$RangeLength[i],$RangeHigh[i])style(line,2)coloured("blue",255)
drawsegment($RangeStart[i],$RangeLow[i],$RangeStart[i]+$RangeLength[i],$RangeLow[i])style(line,2)coloured("blue",255)
DRAWRECTANGLE($RangeStart[i],$RangeHigh[i],$RangeStart[i]+$RangeLength[i],$RangeLow[i])coloured("grey",20)bordercolor(204,0,0,1)
drawsegment($RangeStart[i],($RangeHigh[i]+$RangeLow[i])/2,$RangeStart[i]+$RangeLength[i],($RangeHigh[i]+$RangeLow[i])/2)style(dottedline1,2)coloured("blue",255)
Next
Endif

return