@Bin just to clarify, the difference you show above is between …
Backtest on your Live Account
and
Backtest on your Demo Account
Is above correct?
The on the left has no current date, is that significant?
You sure the selected Contract / Market is the same in both Demo and Live?
GraHal
Re above … is the left one a ‘mini Contract’ for example?
 BC
BCParticipant
Master
Hi Grahal
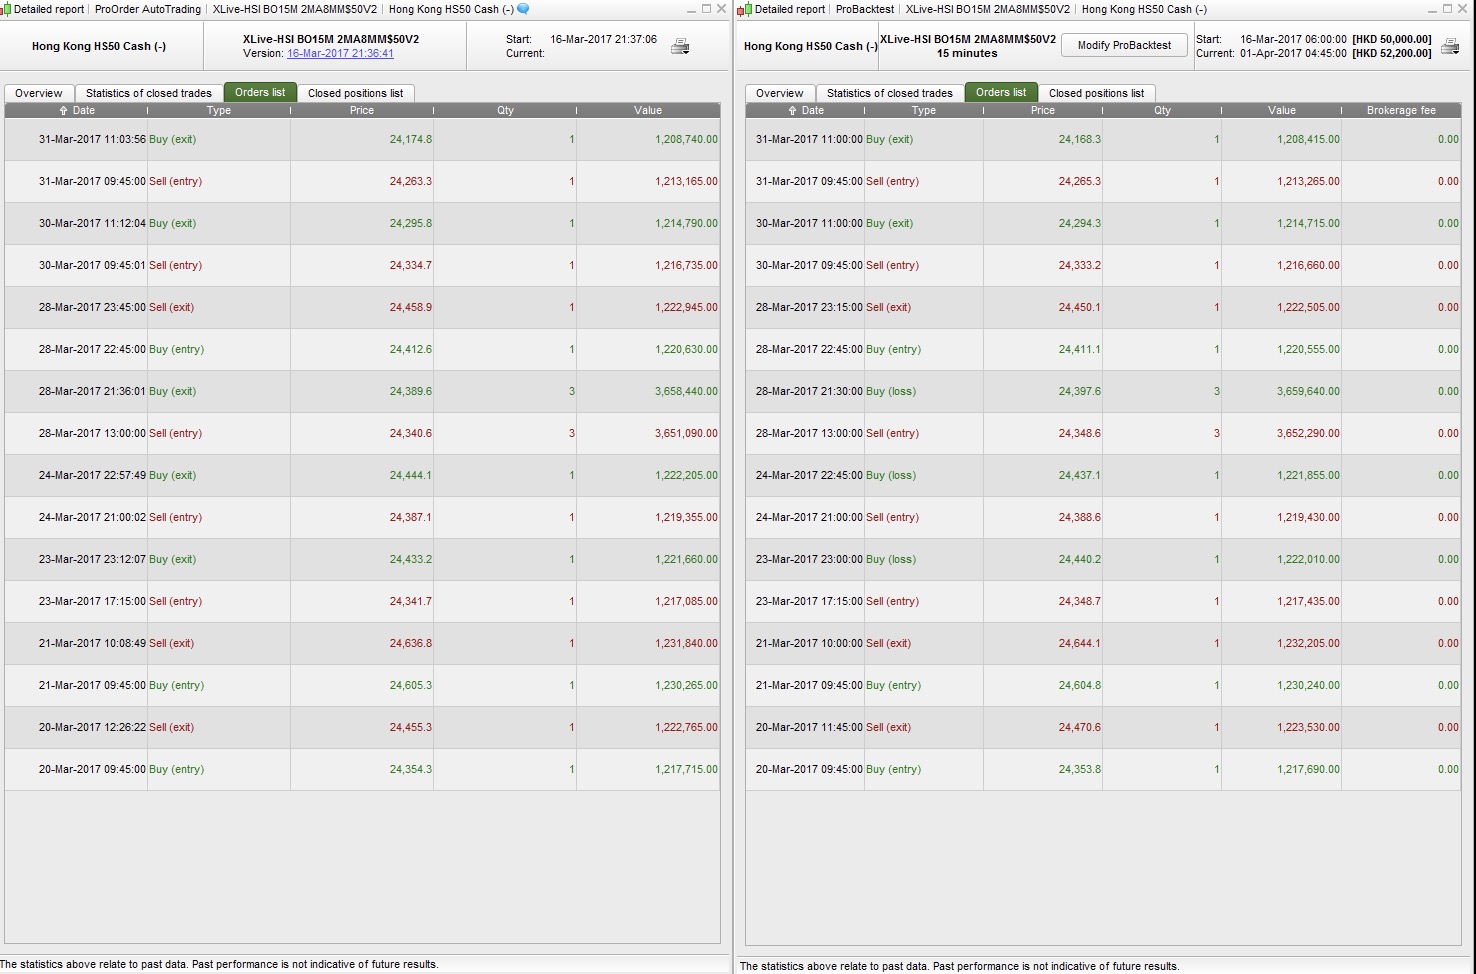
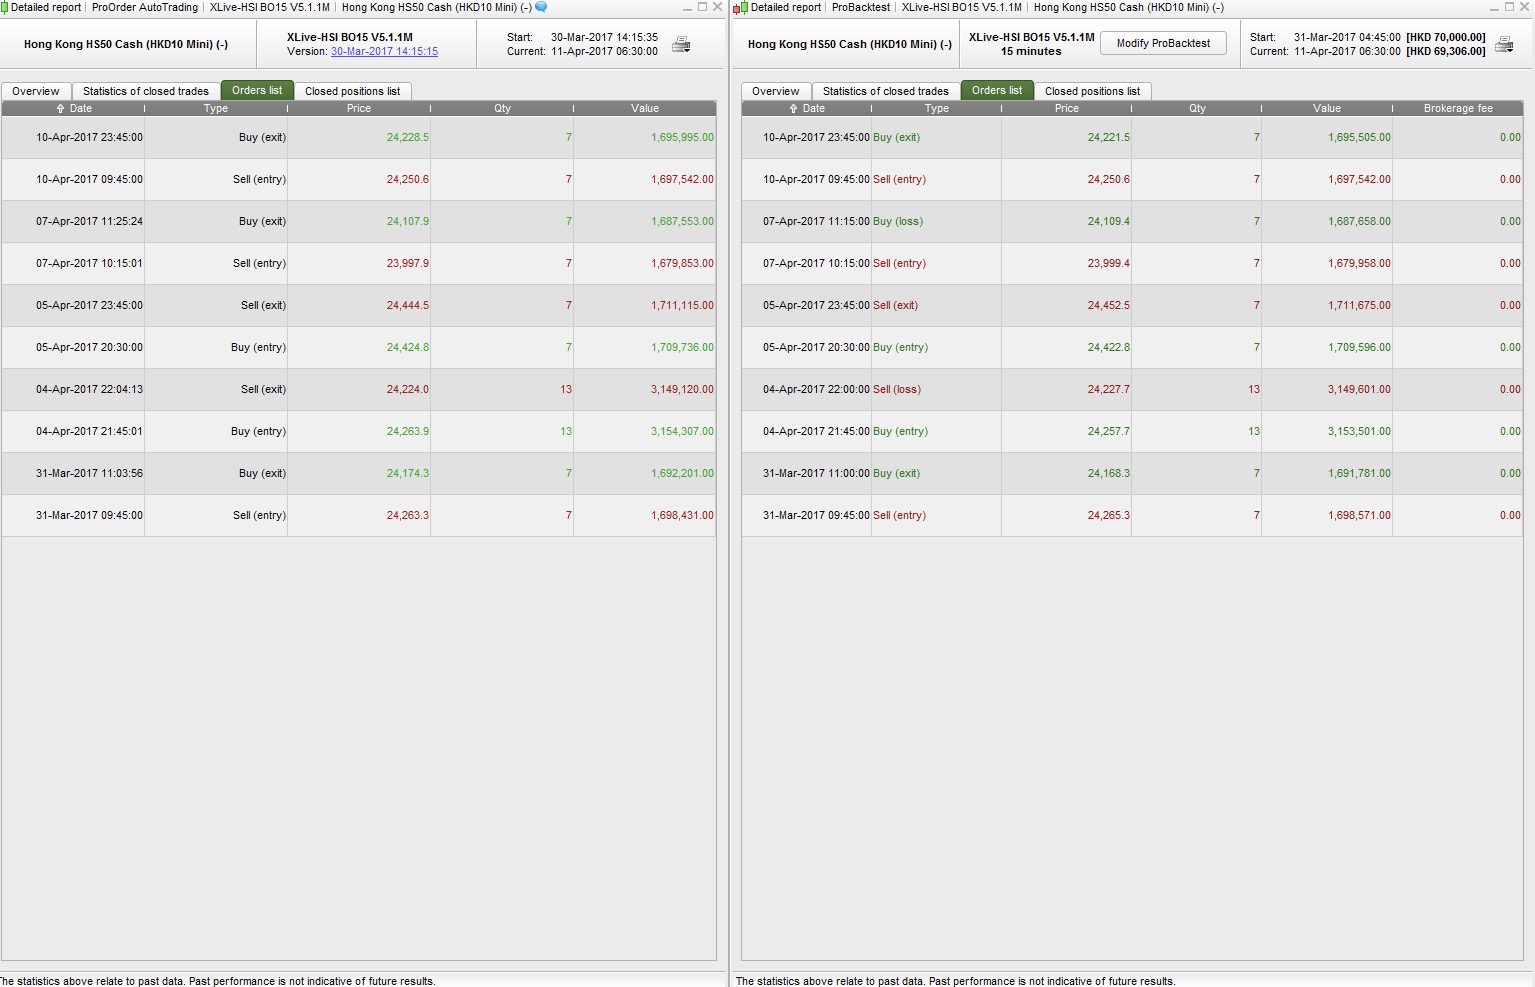
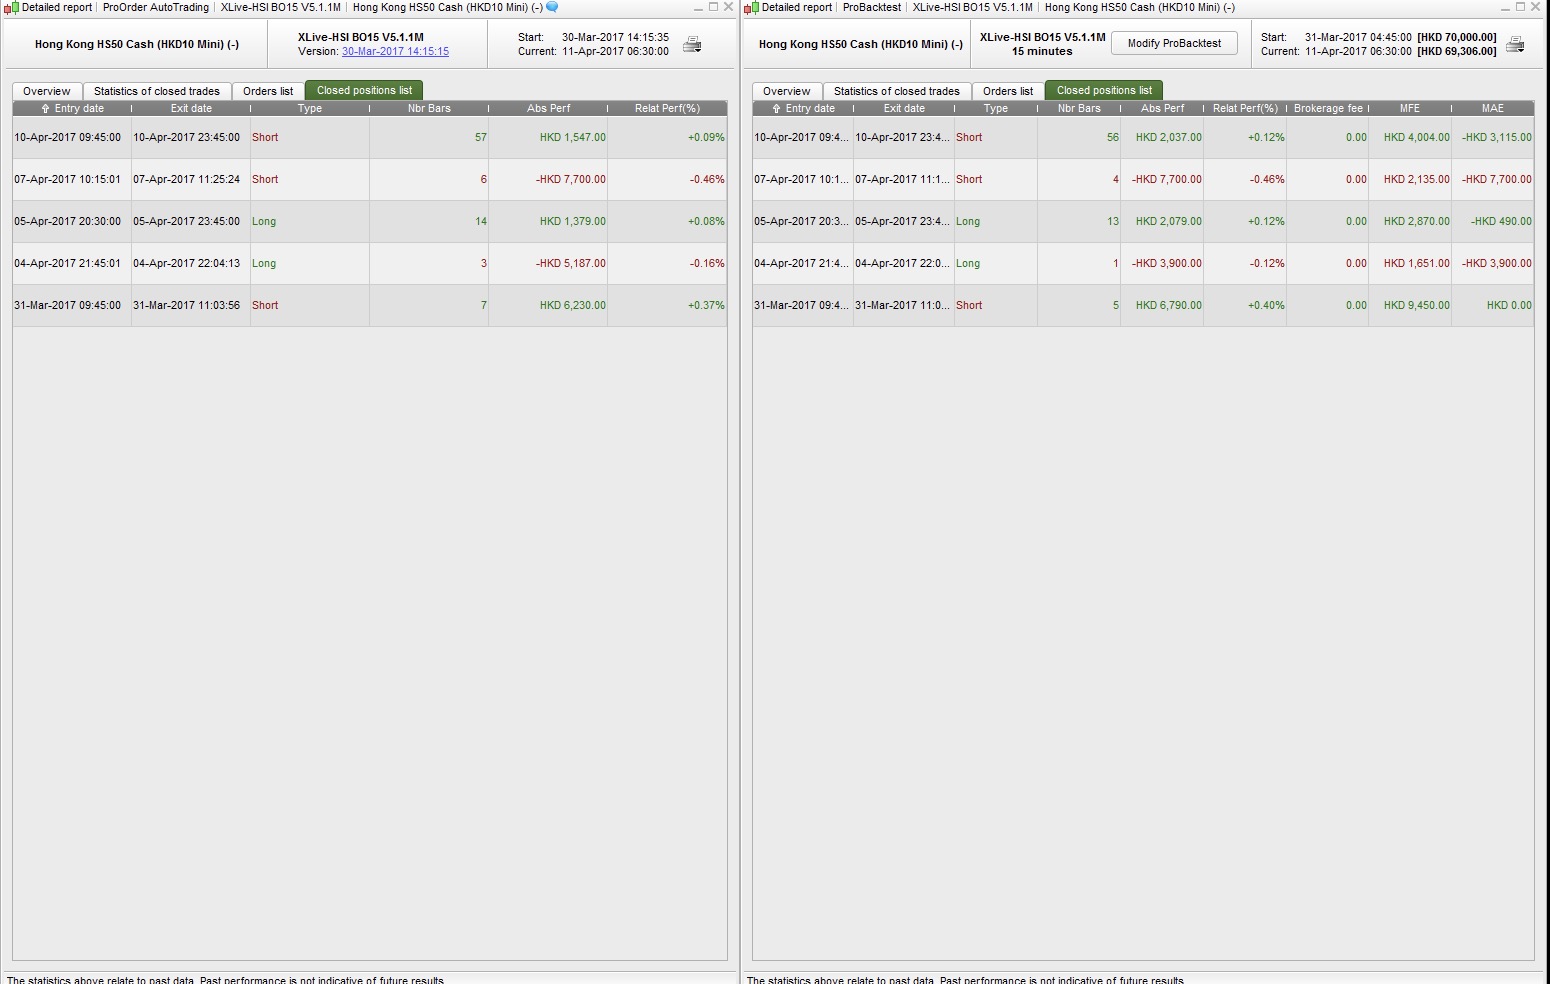
Left was real live trade record, right was backtest (not demo, start date same as real live trade).
Same Hong Kong HS CFD at IG, $50 per point.
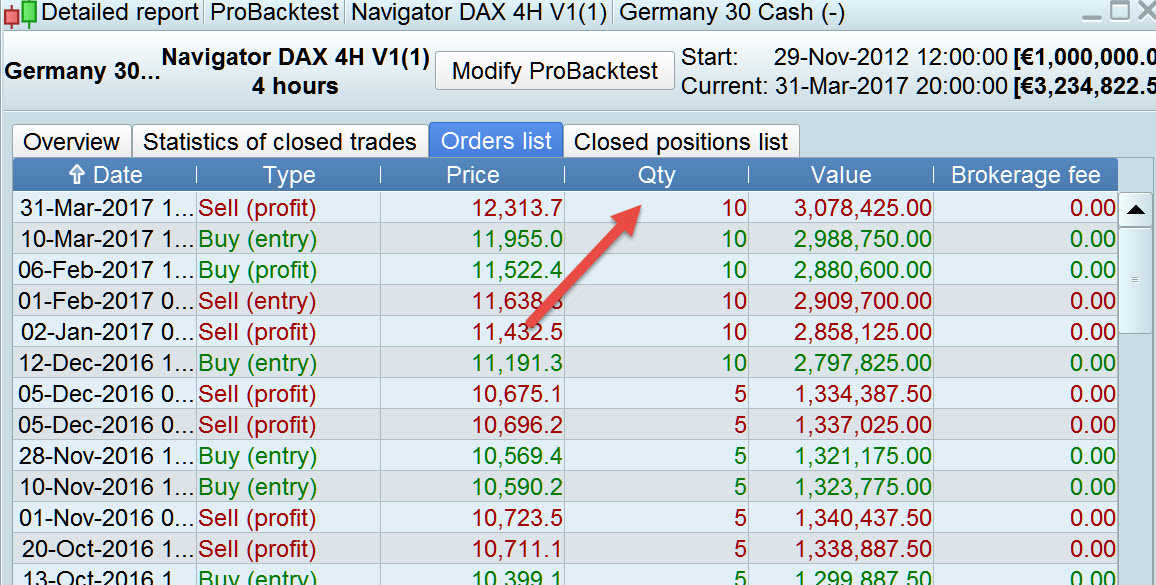
Hi Bin, please can you do a screen capture showing
Live Trading System Trades showing Qty of Contracts
Live Backtest System Trades showing Qty of Contracts
I’ve attached attached a screen shot of the same type as I am asking for.
Thanks
GraHal
@
Bin what spread have you got set in the Demo Backtest?
BCParticipant
Master
Hi Eric
I don’t know why, may be that’s the reason why I got different result.
Hi Grahal
6 spread
I can’t find ‘average spread’ info for HS 50 on IG (do you know it?) but here it is from City Index and it says from 10 points for HS50.
http://www.cityindex.co.uk/range-of-markets/indices/
Just an idea, is 6 points realistic spread for HS50 with IG?
Is your System running 24 hours? If Yes, what does HS50 spread increase to during ‘out of hours dealing’?
BCParticipant
Master
Hi Grahal
Average spread of HS at IG is around 12 (max:20, min:6), but my system only trade within low spread peroid (6 spread) as below
(time>=091500 and time<120000) (time>=130000 and time<160000) (time>=171500 and time<230000)
@Bin I’m trying to catch your spread = 6 on HS 50 to do a short, it loooks like it might be on a down.
Anyway it’s GMT+1 time>=130000 and spread on HS50 on IG on my platform is 20. What timezone you referring to above?
GraHal
BCParticipant
Master
Hi Grahal
Timezone is UTC+8:00 Asia/Shanghai China Standard Time.
Unless I missed something, there might be a possible bug for drawarrow new v10.3 functions in weekly timeframe?
Trying to debug one of my signals, I came accross some weird arrow positions, but only in weekly timeframe, not any other timeframe. To be sure it could be platform related rather than an error in my code, I wrote an entirely separate tiny piece of code to check this. Here it goes:
ybar=0
b=barindex/10

if round(b)=b then
   xbar=barindex
   drawarrowup(xbar, low)
   drawarrowdown(xbar, high)
   ybar=low
endif

return ybar coloured(30,144,255) style(dottedline,1)
This code just selects a barindex multiple of 10, highlights this barindex with the light blue dotted line, and draws up and down arrows on high and low of the candle for the selected barindex.
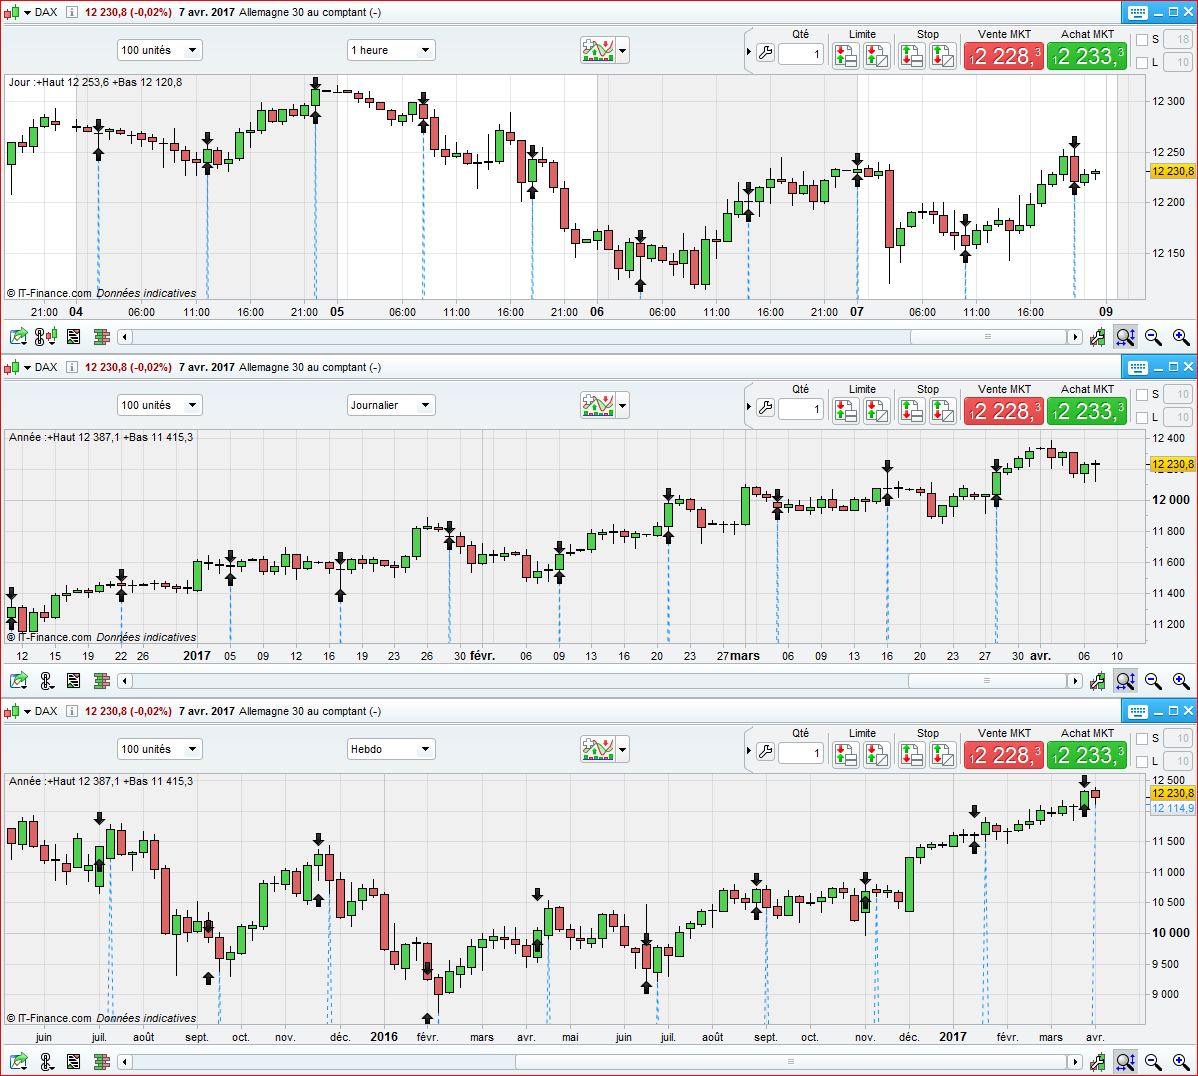
Attached is picture of example for 3 timeframes:
- 1h works fine (smaller timeframes too although I can’t promise I tried them all),
- daily works fine (x days too),
- but weekly doesn’t: arrows are drawn one bar earlier than selected barindex (same problem goes with x weeks timeframes)
Monthly and above were fine, so it seems to happen only for weekly and (x) weeks timeframes…
Thanks Noobywan, I think we share the same problem in this topic:
https://www.prorealcode.com/topic/rewrite-code-to-prorealtime-code/page/4/#post-31404
Seems that barindex is not incremented correctly with 4 days week. This is only my first thoughts about the problem. I sent a report about this issue.
BCParticipant
Master
Hi Nicolas
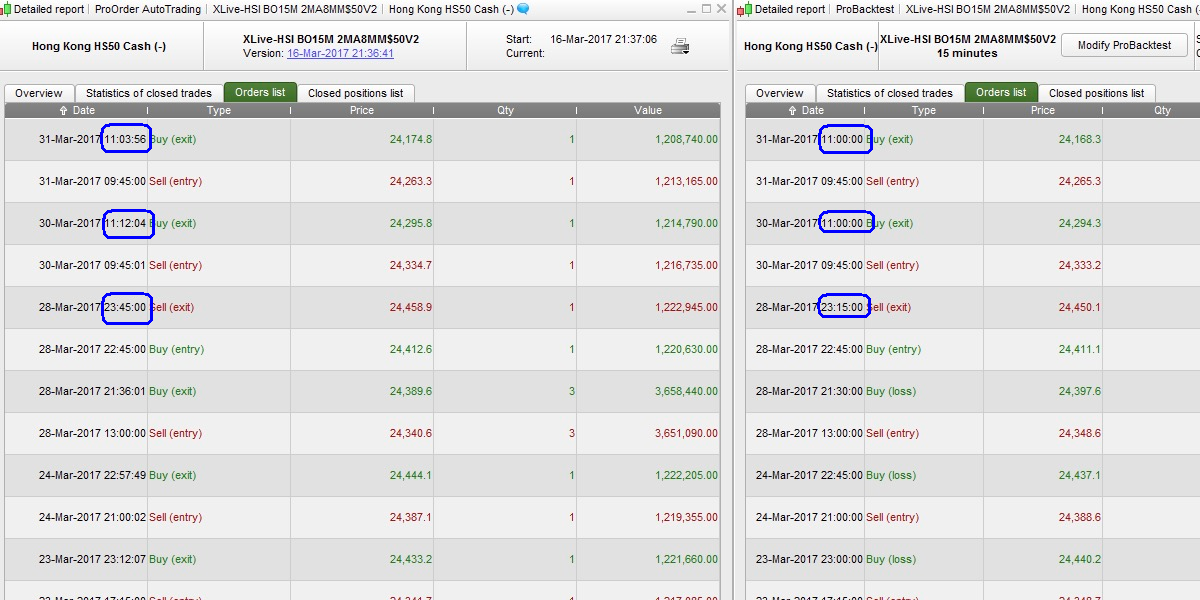
As Eric mention different trading time on my case, I can assume PRT got problem in tick by tick mode backtest result (15 mins time frame, Hang Seng), because all exit time in backtest result only appear at 00, 15, 30, 45.
others systems running in 1 hr, 4 hrs are fine and without this issue when compare live record and backtest result.
How can I feedback this issue to PRT?
Thanks.