Previous weeks high and low price level

Viewing 6 posts - 1 through 6 (of 6 total)

  • Author
    Posts
  • #195672 quote
    blackwingblackwing
    Participant
    New

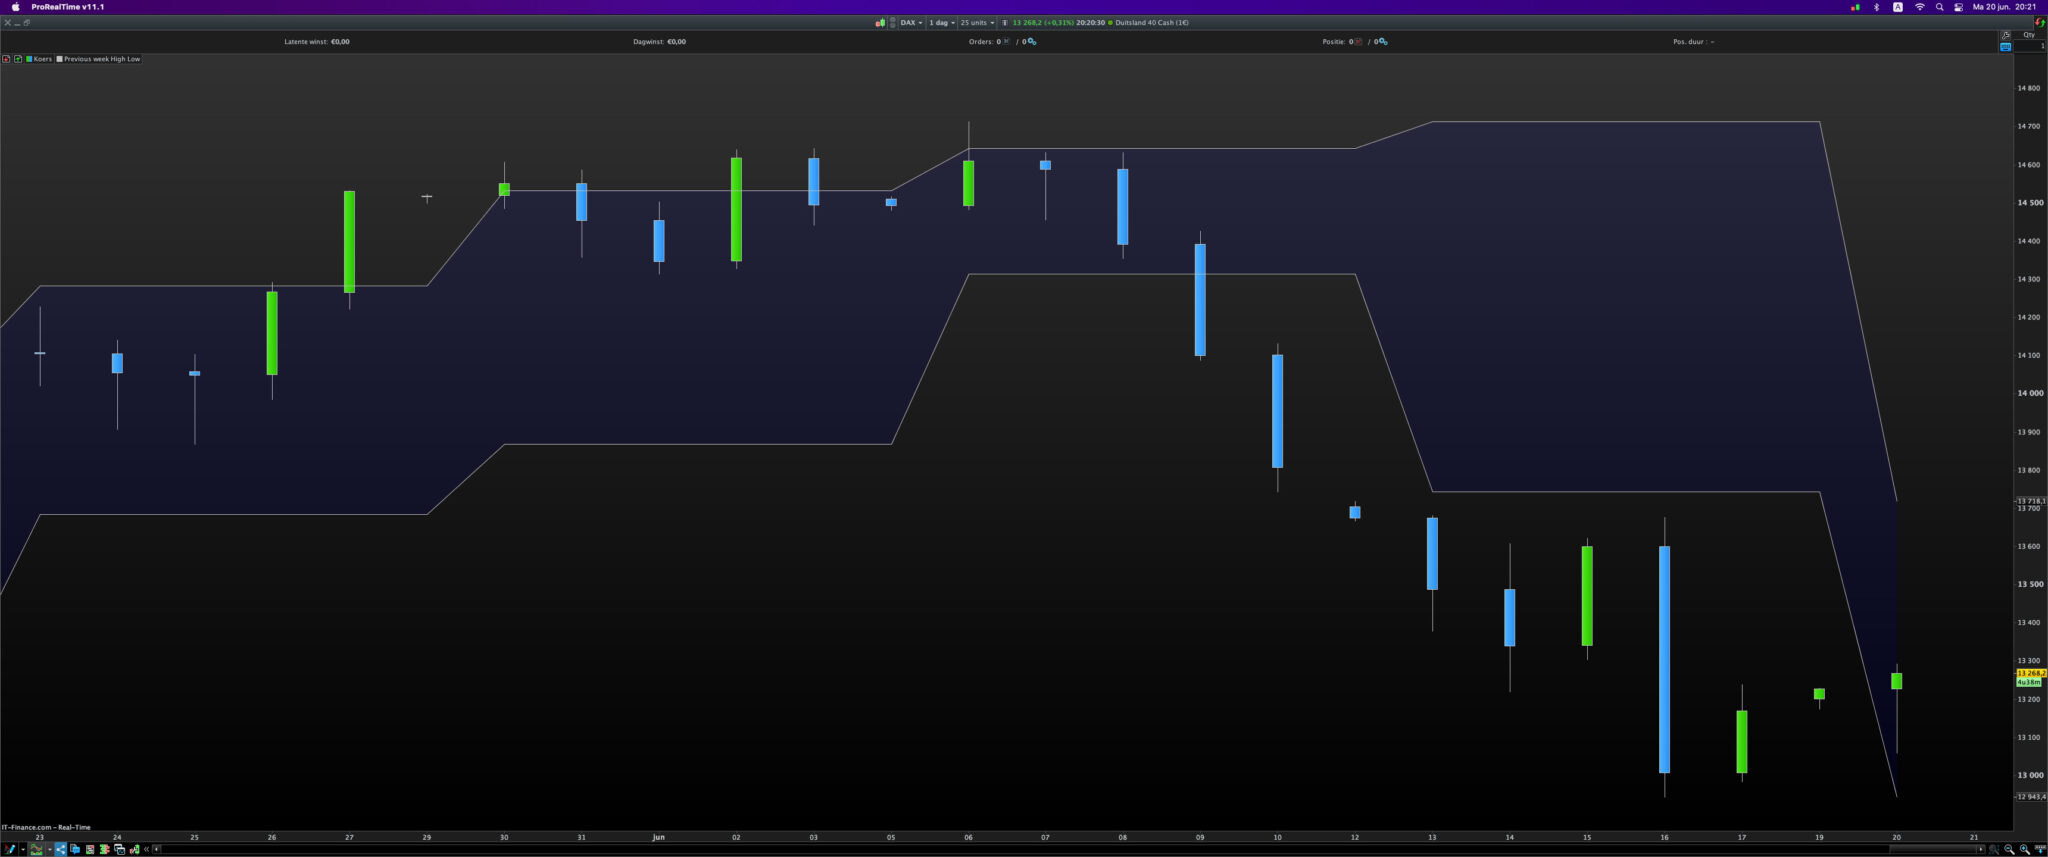
    Can somebody help me with this. I am trying to return a Donchian like indicator that shows a channel with the last weeks high and low overlaid on a daily chart. Not a Donchian because I want the price levels for the previous week to stick for the entire current week before updating on the Monday.

    This is what I have tried but it doesn’t work, but I don’t know why. Apologies in advance for the basic question.

    Timeframe(1 Week)
    Upper = highest[1](high)
    Lower = lowest [1](low)
    return Upper,lower
    #195677 quote
    JSJS
    Participant
    Master
    TimeFrame(1 week, UpdateOnClose)
    Upper = Highest[1](High)
    Lower = Lowest[1](Low)
    
    TimeFrame(daily)
    
    Return Upper[1], Lower[1]
    
    blackwing thanked this post
    Schermafbeelding-2022-06-20-om-20.21.26.jpg Schermafbeelding-2022-06-20-om-20.21.26.jpg
    #195681 quote
    JSJS
    Participant
    Master
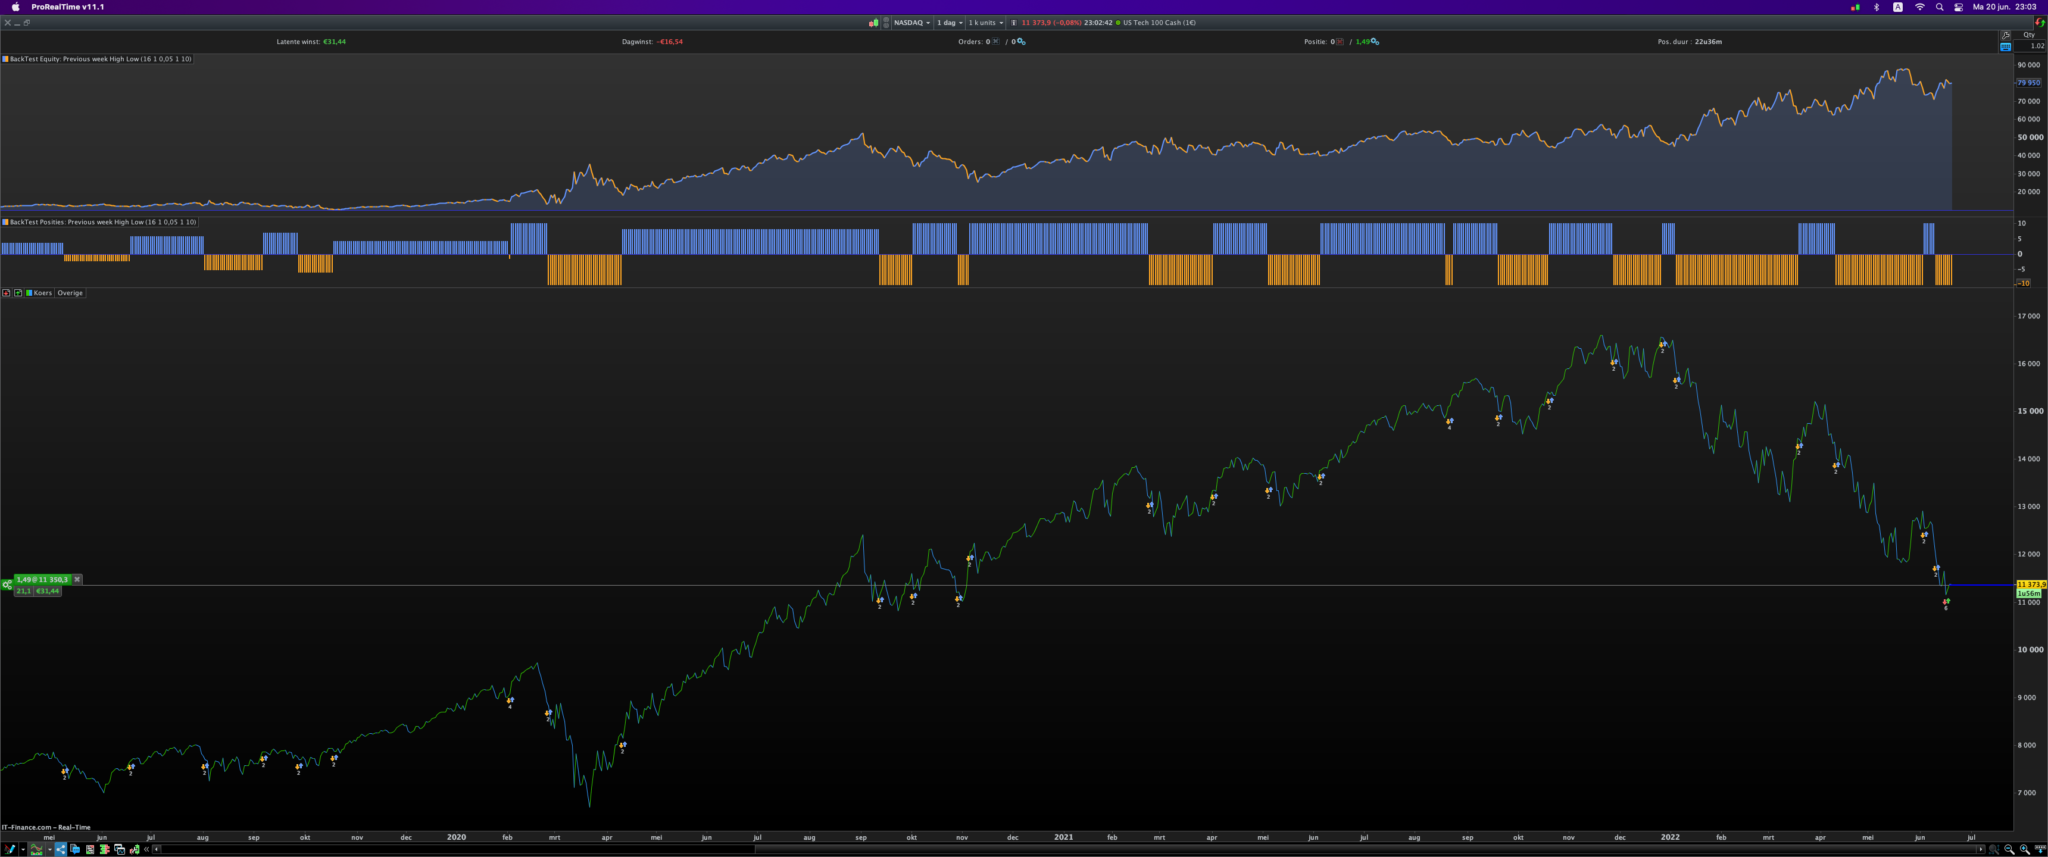
    DefParam CumulateOrders = False
    
    TimeFrame(1 week, UpdateOnClose)
    Upper = Highest[1](High)
    Lower = Lowest[1](Low)
    
    TimeFrame(daily)
    PositionSize = STRATEGYPROFIT / (Close * MargePerc)
    
    If PositionSize < MinPosition then
    PositionSize = MinPosition
    EndIf
    
    If PositionSize > MaxPosition then
    PositionSize = MaxPosition
    EndIf
    If close > Upper[xL] then
    Buy PositionSize contract at market
    ElsIf Close < Lower[xS] then
    SellShort PositionSize contract at market
    EndIf
    

    These kinds of simple systems where you compare the Close with a previous value, usually score well, both on robustness and performance…

    blackwing thanked this post
    Schermafbeelding-2022-06-20-om-23.03.49.png Schermafbeelding-2022-06-20-om-23.03.49.png
    #195772 quote
    blackwingblackwing
    Participant
    New
    Thank you JS! I understand the UpdateOnClose now, and thank you for the system example. I am trying to develop a couple of super simple strategies along these lines. However simple ideas turn into complex code! Just starting out so every answer brings another question at the moment. Apologies. When I try and replicate your system I get nothing like your equity curve. Can you explain what the [xL] and [xS] are referring to. I think I understand the Money Mment but what is MargePerc
    #195777 quote
    JSJS
    Participant
    Master
    Hi @BlackWing xL (xLong) and xS (xShort) are the parameter I used to optimize. I think I had xL and xS optimized from 0 to 100 (step 5). MargePerc is Margin Percentage for example Dow Jones is MargePerc = 0.05 (5%) I will try to add the code as itf -file
    blackwing thanked this post
    Previous-week-High-Low.itf
    #195825 quote
    phoentzsphoentzs
    Participant
    Master
    I like the code and its simplicity. Unfortunately, the strategy is on the market almost all the time.
Viewing 6 posts - 1 through 6 (of 6 total)
  • You must be logged in to reply to this topic.

ProRealAI ProRealAI New

Stuck on this ProBuilder code?

Describe what this topic is trying to build, in plain English, and ProRealAI writes the ProRealTime™ indicator, screener or system for you.

Available in 7 languages
Try ProRealAI

Previous weeks high and low price level


ProBuilder: Indicators & Custom Tools

New Reply
Author
author-avatar
blackwing @blackwing1 Participant
Summary

This topic contains 5 replies,
has 3 voices, and was last updated by phoentzsphoentzs

4 years, 2 months ago.

Topic Details
Forum: ProBuilder: Indicators & Custom Tools
Language: English
Started: 06/20/2022
Status: Active
Attachments: 3 files
ProRealCode ProRealCode
Loading...