Hi together,
I want to draw a rectangle after each new bar (timeframe 30 minutes) and not every time the loop is run and the conditions are true.
I’ve already tried a few things (bar index, etc.) and have not come to a satisfying result.
Does anyone have an idea?
I can also provide the complete code. (Calculations of the arrays – positions of the rectangle based on the Meander band).
Thanks
for i = 0 to LastSet($RechteckStartBar) do
DRAWRECTANGLE($RechteckStartBar[i], $RechteckObereSeite[i], $RechteckEndBar[i], $RechteckUntereSeite[i]) coloured(0, 0, 255, 10) bordercolor(0, 0, 150)
You should add a 2-element array named $myTime (or whatever name you like) to prevent arrays from being continuously updated, as they are not historicized, unlike common variables:
ONCE $myTime[0] = 0
ONCE $myTime[1] = -1
$myTime[0] = Time
IF Time <> Time[1] AND $myTime[0] <> $myTime[1] THEN
   $myTime[0] = Time
ENDIF
IF $myTime[1] <> $myTime[0] THEN
   .
   .
    ---  your main code must be here  ---
   .
   .
endif
$myTime[1] = $myTime[0]
 .
 ---  the last part of your code (such as plotting on the chart) must be here  ---
 .
RETURN
I think that to get a perfect and neat answer to your query, you should provide the complete code.
I understand that you plot the rectangles in the past from the current bar, right?
Did you use:
DEFPARAM DRAWONLASTBARONLY=TRUE
for that purpose ?
Your solution with the $myTime array is a good approach to get around this problem. I basically store the current time value in an array and then compare it to the previous stored value to determine if the current candle is a new one. If the current candle is new, the main code is executed, if I understand it correctly.
Thanks, I will try that. 🙂
Hi Nicolas,
Thanks for your answer!
Yes I use DEFPARAM DRAWONLASTBARONLY=TRUE
It’s also a Multitimeframe approach which takes into account the Waddah-Attar-Explosion in the H1 Chart, which i use in a modified version (better bollinger band).
I’ll try the solution of robertogozzi and then I’ll post the complete code.
Here is the code without the extension.
defparam drawonlastbaronly = True

//draw only from 08 o'clock

if tageszaehlerAn = 1 then
if (hour[1] < 8 and hour = 8)  then
Counter = 0

// Setzt die Array-Variablen zurück
for i = 0 to LastSet($RechteckStartBar) do
$RechteckStartBar[i] = -1
$RechteckEndBar[i] = -1
$RechteckObereSeite[i] = -1
$RechteckUntereSeite[i] = -1
next
endif

endif


timeframe (1 hour)


// -- parameters
sensitivityh1 = 150
deadZoneh1=10

//Berechnung Better Bollinger Bands

IbH1=20
deH1=2
alpH1=3/(IbH1+1)
srcH1=(high+low+close)/3

if barindex>IbH1 then
mtH1=alpH1*srcH1+(1-alpH1)*mtH1[1]

utH1=alpH1*mtH1+(1-alpH1)*utH1[1]

dtH1=((2-alpH1)*mtH1-utH1)/(1-alpH1)

mt2H1=alpH1*abs(srcH1-dtH1)+(1-alpH1)*mt2H1[1]

ut2H1=alpH1*mt2H1+(1-alpH1)*ut2H1[1]

dt2H1=((2-alpH1)*mt2H1-ut2H1)/(1-alpH1)
butH1=dtH1+deH1*dt2H1
bltH1=dtH1-deH1*dt2H1
endif

e1H1 = butH1 - bltH1

// indis
if barindex>40 then
calcMACDH1 = MACD[18,40,9](customclose)

t1H1 = (calcMACDH1-calcMACDH1[1])*sensitivityh1
e1H1 = e1H1

if t1H1>=0 then
trendUPH1 = t1H1
trendDOWNH1 = 0
else
trendUPH1 = 0
trendDOWNH1 = -1*t1H1
endif

if trendUPH1<trendUPH1[1] then
colorH1 = -1
else
colorH1 = 1
endif

if trendDOWNH1<trendDOWNH1[1] then
colorH1 = -1
else
colorH1 = 1
endif
endif

H1Short = TrenddownH1 < e1H1
H1Long = TrendupH1 > e1H1


timeframe (30 minutes)

//Berechnung Meander
ONCE Periods    = 5
ONCE Deviations = 2
ONCE    Middle1    = 0
ONCE    MeanderHI = 0
ONCE    MeanderLO = 0
MyAvg             = 0
MyVar             = 0
StDev             = 0
FOR i = 0 TO (Periods - 1)
$barO[i] = (Open[i] - close[i+1]) / close[i+1]
$barH[i] = (High[i] - close[i+1]) / close[i+1]
$barL[i] = (Low[i]  - close[i+1]) / close[i+1]
$barC[i] = (Close[i]- close[i+1]) / close[i+1]
//-------------- average price --------------------------------------
Avg      = ($barO[i] + $barH[i] + $barL[i] + $barC[i]) / 4
MyAvg    = MyAvg + Avg
NEXT
MyAvg = MyAvg / Periods
//-------------- calculation of standard deviation ------------------
FOR i = 0 TO (Periods - 1)
MyVar = MyVar + ((square($barO[i] - MyAvg) + square($barH[i] - MyAvg) + square($barL[i] - MyAvg) + square($barC[i] - MyAvg)) / 4)
NEXT
//
StDev = SQRT(MyVar / Periods)
//
Middle1    = close * (1 + MyAvg)
MeanderHI = close * (1 + MyAvg + (Deviations * StDev))
MeanderLO = close * (1 + MyAvg - (Deviations * StDev))


//Berechnung Einstiege
if MeanderLO > MeanderLO[1] and not (MeanderLO[1]>MeanderLO[2]) then
b=1
else
if MeanderLO < MeanderLO[1] and not (MeanderLO[1]<MeanderLO[2]) then//and not (meanderlow[1]<meanderlow[2]) then
b=-1
else
b=0
endif
endif


//Bedingung für Long Viereck
if  (b[1]=1) and (H1Short) then

// For Testing: if ((barindex > 1) and (b[1]=1) and (H1Short) and (barindex > LastSet($RechteckStartBar)) and (barindex <> barindex[1]) and (minute mod 5 = 0) then


BeginnRechteckLong = 1
EndeRechteckLong = 4
Counter = LastSet($RechteckStartBar) + 1

ObereSeite = MeanderHI
UntereSeite = Middle1

// Speichert die Koordinaten des Rechtecks in Array-Variablen
$RechteckStartBar[Counter] = barindex - 1 + BeginnRechteckLong
$RechteckEndBar[Counter] = barindex - 1 + EndeRechteckLong
$RechteckObereSeite[Counter] = ObereSeite
$RechteckUntereSeite[Counter] = UntereSeite

// Aktualisieren des Zählers
Counter = Counter + 1
endif


// Zeichnet alle gespeicherten Rechtecke im Chart

for i = 0 to LastSet($RechteckStartBar) do
DRAWRECTANGLE($RechteckStartBar[i], $RechteckObereSeite[i], $RechteckEndBar[i], $RechteckUntereSeite[i]) coloured(0, 0, 255, 10) bordercolor(0, 0, 150)

// Zeichnen der horizontalen Linien im Rechteck
if horizontaleLinien = 1 then
x1 = $RechteckStartBar[i]
x2 = $RechteckEndBar[i]
yMid1 = ($RechteckObereSeite[i] + 2 * $RechteckUntereSeite[i]) / 3
yMid2 = (2 * $RechteckObereSeite[i] + $RechteckUntereSeite[i]) / 3
DRAWSEGMENT(x1, yMid1, x2, yMid1) COLOURED(255, 0, 0, 255)
DRAWSEGMENT(x1, yMid2, x2, yMid2) COLOURED(255, 0, 0, 255)
endif

// Berechnen der X- und Y-Koordinaten für die Sterne
xCoord = ($RechteckStartBar[i] + $RechteckEndBar[i]) / 2
yCoord = $RechteckObereSeite[i]

//// Berechnung von StarCount basierend auf dem Vierecks
if drawSterne = 1 then
RechteckMitte1 = yMid1
RechteckMitte2 = yMid2
maxHigh = highest[EndeRechteckLong - BeginnRechteckLong + 1](high)[barindex - $RechteckStartBar[i]]
//
if maxHigh > $RechteckObereSeite[i] then
StarCount = 3
elsif maxHigh > RechteckMitte2 then
StarCount = 2
else
StarCount = 1
endif
endif
//
//// Zeichnen der Sterne über dem Rechteck
if drawSterne = 1 then
for j = 1 to StarCount do
yPos = yCoord + (20 * j * pipsize)
DRAWTEXT("●", xCoord, yPos, Monospaced, Bold, 15) COLOURED(136, 136, 0)
next
endif
next

return
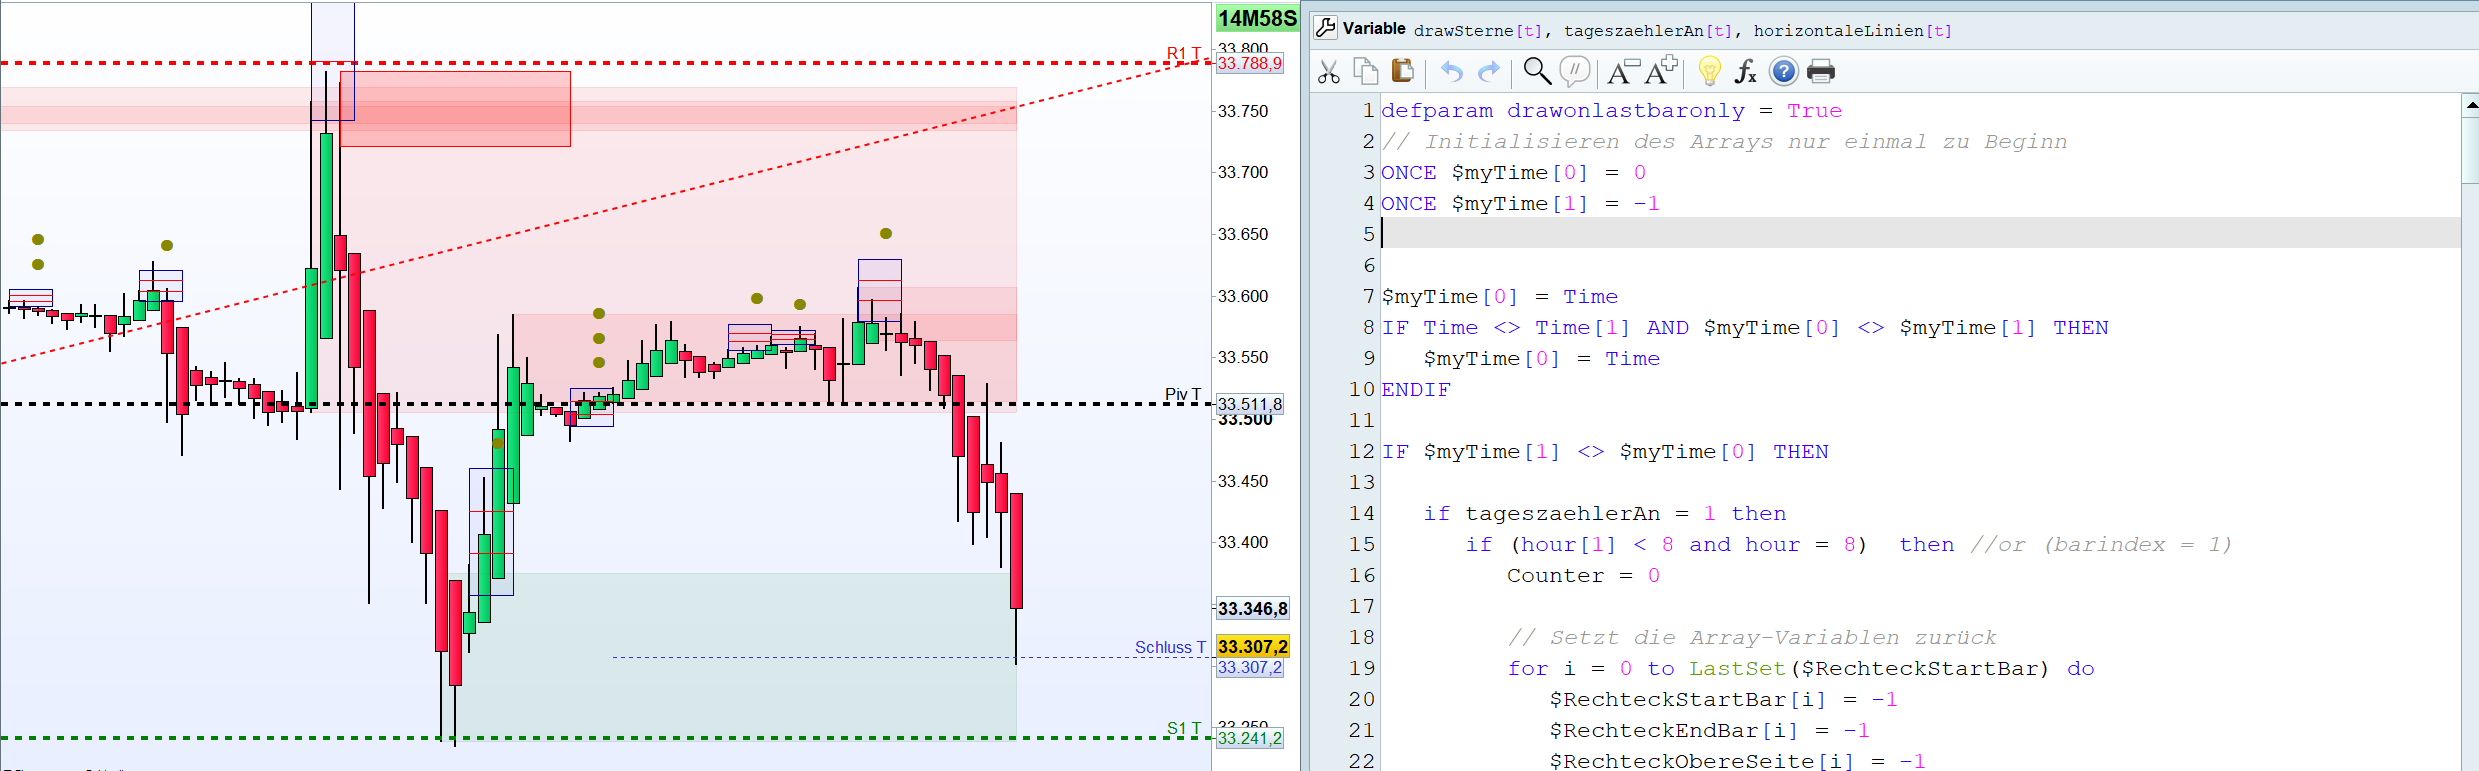
And here is the updated version. Did I miss something? I’m going to test it.
defparam drawonlastbaronly = True
// Initialisieren des Arrays nur einmal zu Beginn
ONCE $myTime[0] = 0
ONCE $myTime[1] = -1


$myTime[0] = Time
IF Time <> Time[1] AND $myTime[0] <> $myTime[1] THEN
$myTime[0] = Time
ENDIF

IF $myTime[1] <> $myTime[0] THEN

if tageszaehlerAn = 1 then
if (hour[1] < 8 and hour = 8)  then //or (barindex = 1)
Counter = 0

// Setzt die Array-Variablen zurück
for i = 0 to LastSet($RechteckStartBar) do
$RechteckStartBar[i] = -1
$RechteckEndBar[i] = -1
$RechteckObereSeite[i] = -1
$RechteckUntereSeite[i] = -1
next
endif
endif
endif

timeframe (1 hour)

// -- parameters
sensitivityh1 = 150
deadZoneh1=10

//Berechnung Better Bollinger Bands

IbH1=20
deH1=2
alpH1=3/(IbH1+1)
srcH1=(high+low+close)/3

if barindex>IbH1 then
mtH1=alpH1*srcH1+(1-alpH1)*mtH1[1]

utH1=alpH1*mtH1+(1-alpH1)*utH1[1]

dtH1=((2-alpH1)*mtH1-utH1)/(1-alpH1)

mt2H1=alpH1*abs(srcH1-dtH1)+(1-alpH1)*mt2H1[1]

ut2H1=alpH1*mt2H1+(1-alpH1)*ut2H1[1]

dt2H1=((2-alpH1)*mt2H1-ut2H1)/(1-alpH1)
butH1=dtH1+deH1*dt2H1
bltH1=dtH1-deH1*dt2H1
endif

e1H1 = butH1 - bltH1

// indis
if barindex>40 then
calcMACDH1 = MACD[18,40,9](customclose)

t1H1 = (calcMACDH1-calcMACDH1[1])*sensitivityh1
e1H1 = e1H1

if t1H1>=0 then
trendUPH1 = t1H1
trendDOWNH1 = 0
else
trendUPH1 = 0
trendDOWNH1 = -1*t1H1
endif

if trendUPH1<trendUPH1[1] then
colorH1 = -1
else
colorH1 = 1
endif

if trendDOWNH1<trendDOWNH1[1] then
colorH1 = -1
else
colorH1 = 1
endif
endif

H1Short = TrenddownH1 < e1H1
H1Long = TrendupH1 > e1H1


timeframe (30 minutes)
//Berechnung Meander
ONCE Periods    = 5
ONCE Deviations = 2
ONCE    Middle1    = 0
ONCE    MeanderHI = 0
ONCE    MeanderLO = 0
MyAvg             = 0
MyVar             = 0
StDev             = 0
FOR i = 0 TO (Periods - 1)
$barO[i] = (Open[i] - close[i+1]) / close[i+1]
$barH[i] = (High[i] - close[i+1]) / close[i+1]
$barL[i] = (Low[i]  - close[i+1]) / close[i+1]
$barC[i] = (Close[i]- close[i+1]) / close[i+1]
//-------------- average price --------------------------------------
Avg      = ($barO[i] + $barH[i] + $barL[i] + $barC[i]) / 4
MyAvg    = MyAvg + Avg
NEXT
MyAvg = MyAvg / Periods
//-------------- calculation of standard deviation ------------------
FOR i = 0 TO (Periods - 1)
MyVar = MyVar + ((square($barO[i] - MyAvg) + square($barH[i] - MyAvg) + square($barL[i] - MyAvg) + square($barC[i] - MyAvg)) / 4)
NEXT
//
StDev = SQRT(MyVar / Periods)
//
Middle1    = close * (1 + MyAvg)
MeanderHI = close * (1 + MyAvg + (Deviations * StDev))
MeanderLO = close * (1 + MyAvg - (Deviations * StDev))

//Berechnung Einstiege
if MeanderLO > MeanderLO[1] and not (MeanderLO[1]>MeanderLO[2]) then
b=1
else
if MeanderLO < MeanderLO[1] and not (MeanderLO[1]<MeanderLO[2]) then//and not (meanderlow[1]<meanderlow[2]) then
b=-1
else
b=0
endif
endif

// Bedingung für Long Viereck
if  (b[1]=1) and (H1Short) then

BeginnRechteckLong = 1
EndeRechteckLong = 4
Counter = LastSet($RechteckStartBar) + 1

ObereSeite = MeanderHI
UntereSeite = Middle1

// Speichert die Koordinaten des Rechtecks in Array-Variablen
$RechteckStartBar[Counter] = barindex - 1 + BeginnRechteckLong
$RechteckEndBar[Counter] = barindex - 1 + EndeRechteckLong
$RechteckObereSeite[Counter] = ObereSeite
$RechteckUntereSeite[Counter] = UntereSeite

// Aktualisieren des Zählers
Counter = Counter + 1
endif


$myTime[1] = $myTime[0]


// Zeichnet alle gespeicherten Rechtecke im Chart
for i = 0 to LastSet($RechteckStartBar) do
DRAWRECTANGLE($RechteckStartBar[i], $RechteckObereSeite[i], $RechteckEndBar[i], $RechteckUntereSeite[i]) coloured(0, 0, 255, 10) bordercolor(0, 0, 150)

// Zeichnen der horizontalen Linien im Rechteck
if horizontaleLinien = 1 then
x1 = $RechteckStartBar[i]
x2 = $RechteckEndBar[i]
yMid1 = ($RechteckObereSeite[i] + 2 * $RechteckUntereSeite[i]) / 3
yMid2 = (2 * $RechteckObereSeite[i] + $RechteckUntereSeite[i]) / 3
DRAWSEGMENT(x1, yMid1, x2, yMid1) COLOURED(255, 0, 0, 255)
DRAWSEGMENT(x1, yMid2, x2, yMid2) COLOURED(255, 0, 0, 255)
endif

// Berechnen der X- und Y-Koordinaten für die Sterne
xCoord = ($RechteckStartBar[i] + $RechteckEndBar[i]) / 2
yCoord = $RechteckObereSeite[i]

//// Berechnung von StarCount basierend auf dem Vierecks
if drawSterne = 1 then
RechteckMitte1 = yMid1
RechteckMitte2 = yMid2
maxHigh = highest[EndeRechteckLong - BeginnRechteckLong + 1](high)[barindex - $RechteckStartBar[i]]
//
if maxHigh > $RechteckObereSeite[i] then
StarCount = 3
elsif maxHigh > RechteckMitte2 then
StarCount = 2
else
StarCount = 1
endif
endif
//
//// Zeichnen der Sterne über dem Rechteck
if drawSterne = 1 then
for j = 1 to StarCount do
yPos = yCoord + (20 * j * pipsize)
DRAWTEXT("●", xCoord, yPos, Monospaced, Bold, 15) COLOURED(136, 136, 0)
next
endif
next

RETURN
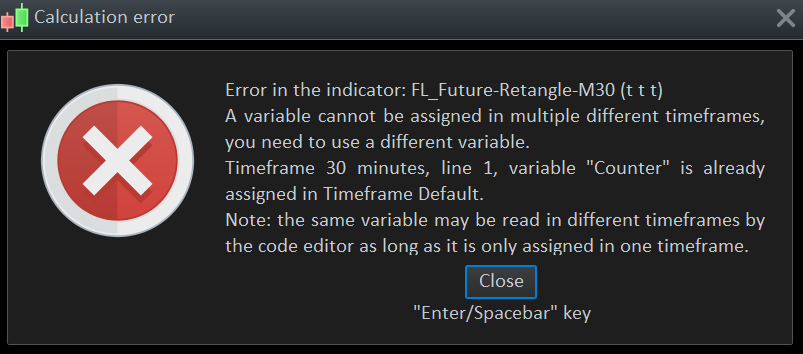
Well, I did not get anything plotted on the chart. There is an error of multiple assignment of the “counter” variable through different timeframes (which is not possible), so you have to change it in one of the timeframe (because I don’t think they are related to each other, you are using it in your loop).
My question is: why do you want to plot only one time on the current bar? Is it related to performance of calculation?
Some tips:
1/ in order to get an huge performance increase, make your calculation only when the last bar of the chart update by encapsulate the parts of the code that plot in the past with a condition: IF ISLASTBARUPDATE THEN … ENDIF
2/ to plot only one time per bar, check if the OPENTIMESTAMP is different from the last saved one:
IF OPENTIMESTAMP>$lastsaved[0] then

$lastsaved[0] = OPENTIMESTAMP

// YOUR CODE

ENDIF
Thanks for your answer.
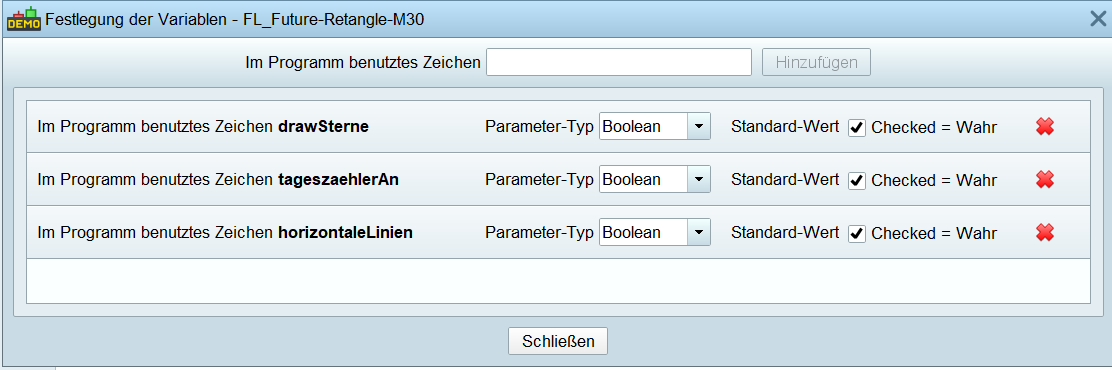
Did you add the 3 variables (booleans)?
For me it works, I attached the ITF-File to import.
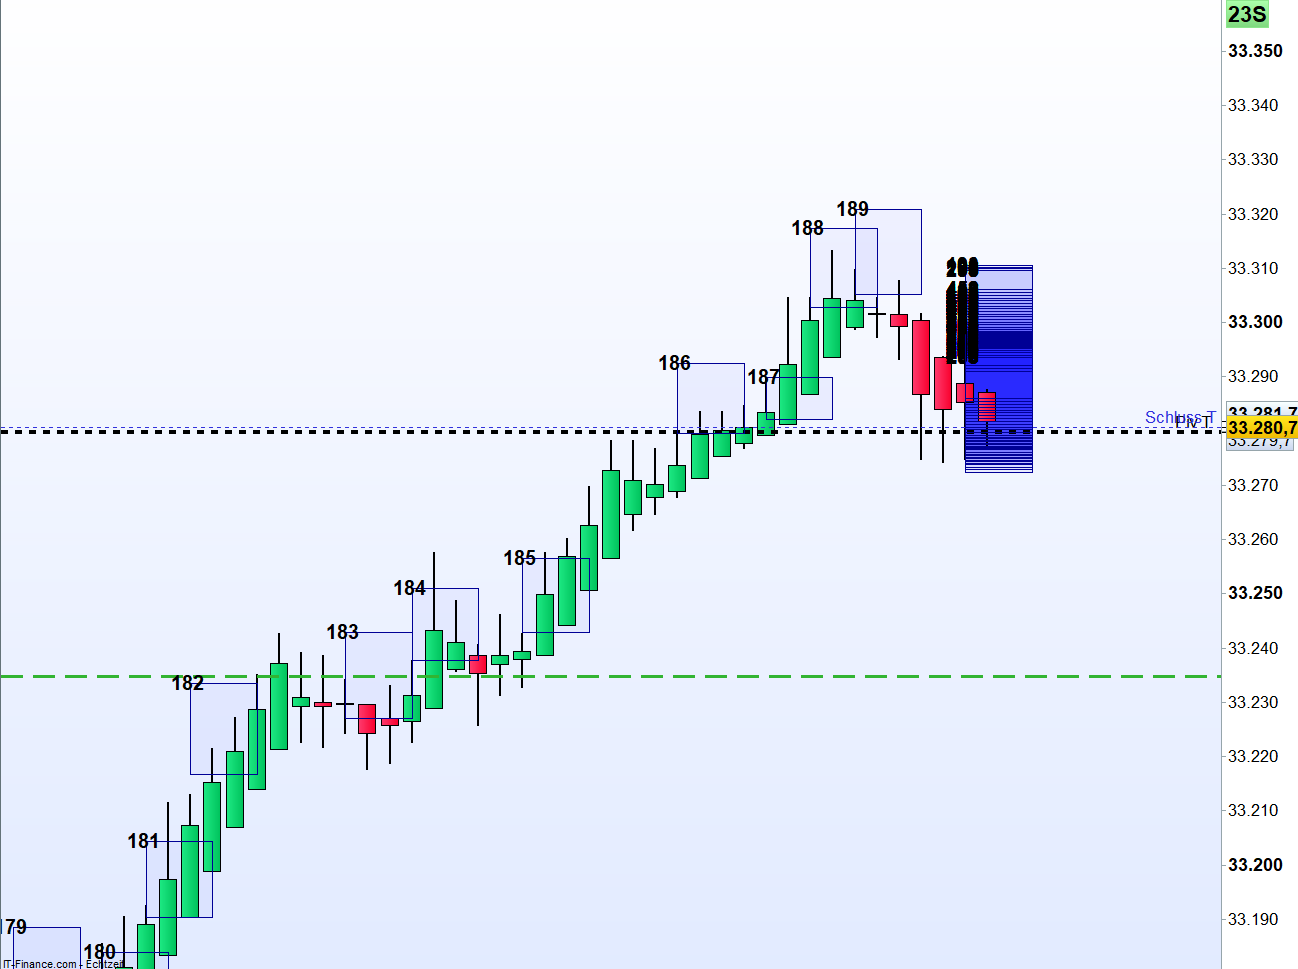
To come back to your question, because it then still looks like this. (See . PNG – Left retangle should be …)
Yes I added them. Got the error message about assignments of values for the same variable with different variables, with your code. No error for you??
Did you import the ITF-File also?
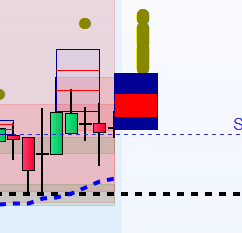
No, no error for me, this is a live screenshot seconds ago. (DJI 30 Minutes)
It worked all the time (except the infinite drawing during the candle-duration).
In fact, there is no problem, you are plotting 3 different rectangles on the same bar.
The X-axis coordinates are the same, but no the Y-axis (price). If you add this line right below the DRAWRECTANGLE, it will add the number of the plotted rectangle:
drawtext("#i#",$RechteckStartBar[i], $RechteckObereSeite[i],dialog,bold,20)
So if you consider that it can’t be more than 1 rectangle on the same bar, then do not increase you array that save the coordinates of the rectangle, just continuously save the coordinates in the same column.
Hi Nicolas,
Thanks for your answer.
When I use the extension under the draw function, no more retangle is drawn.
I’ve shortened the code and limited it to the core function for testing. (meander calculation + drawing the rectangle).
Unfortunately, I’ve not found a solution so far
//Calculation Meander
ONCE Periods    = 5
ONCE Deviations = 2
ONCE    Middle1    = 0
ONCE    MeanderHI = 0
ONCE    MeanderLO = 0
MyAvg             = 0
MyVar             = 0
StDev             = 0


FOR i = 0 TO (Periods - 1)
$barO[i] = (Open[i] - close[i+1]) / close[i+1]
$barH[i] = (High[i] - close[i+1]) / close[i+1]
$barL[i] = (Low[i]  - close[i+1]) / close[i+1]
$barC[i] = (Close[i]- close[i+1]) / close[i+1]
//-------------- average price --------------------------------------
Avg      = ($barO[i] + $barH[i] + $barL[i] + $barC[i]) / 4
MyAvg    = MyAvg + Avg
NEXT
MyAvg = MyAvg / Periods

//-------------- calculation of standard deviation ------------------
FOR i = 0 TO (Periods - 1)
MyVar = MyVar + ((square($barO[i] - MyAvg) + square($barH[i] - MyAvg) + square($barL[i] - MyAvg) + square($barC[i] - MyAvg)) / 4)
NEXT

StDev = SQRT(MyVar / Periods)

Middle1    = close * (1 + MyAvg)
MeanderHI = close * (1 + MyAvg + (Deviations * StDev))
MeanderLO = close * (1 + MyAvg - (Deviations * StDev))


//Calculation Entries
if MeanderLO > MeanderLO[1] and not (MeanderLO[1]>MeanderLO[2]) then
b=1
else
if MeanderLO < MeanderLO[1] and not (MeanderLO[1]<MeanderLO[2]) then//and not (meanderlow[1]<meanderlow[2]) then
b=-1
else
b=0
endif
endif


// Condition for rectangle
if  (b[1]=1) then
BeginnRechteckLong = 1
EndeRechteckLong = 4
Counter = LastSet($RechteckStartBar) + 1

ObereSeite = MeanderHI
UntereSeite = Middle1

// Saves the coordinates of the rectangle in array variables
$RechteckStartBar[Counter] = barindex - 1 + BeginnRechteckLong
$RechteckEndBar[Counter] = barindex - 1 + EndeRechteckLong
$RechteckObereSeite[Counter] = ObereSeite
$RechteckUntereSeite[Counter] = UntereSeite

// Updating the counter
Counter = Counter + 1
endif

// Draws all saved rectangles in the chart
for i = 0 to 0 do
DRAWRECTANGLE($RechteckStartBar[i], $RechteckObereSeite[i], $RechteckEndBar[i], $RechteckUntereSeite[i]) coloured(0, 0, 255, 10) bordercolor(0, 0, 150)
drawtext("#i#",$RechteckStartBar[i], $RechteckObereSeite[i],dialog,bold,20)
next

RETURN
defparam drawonlastbaronly = True
Was missing in 1. Line.