

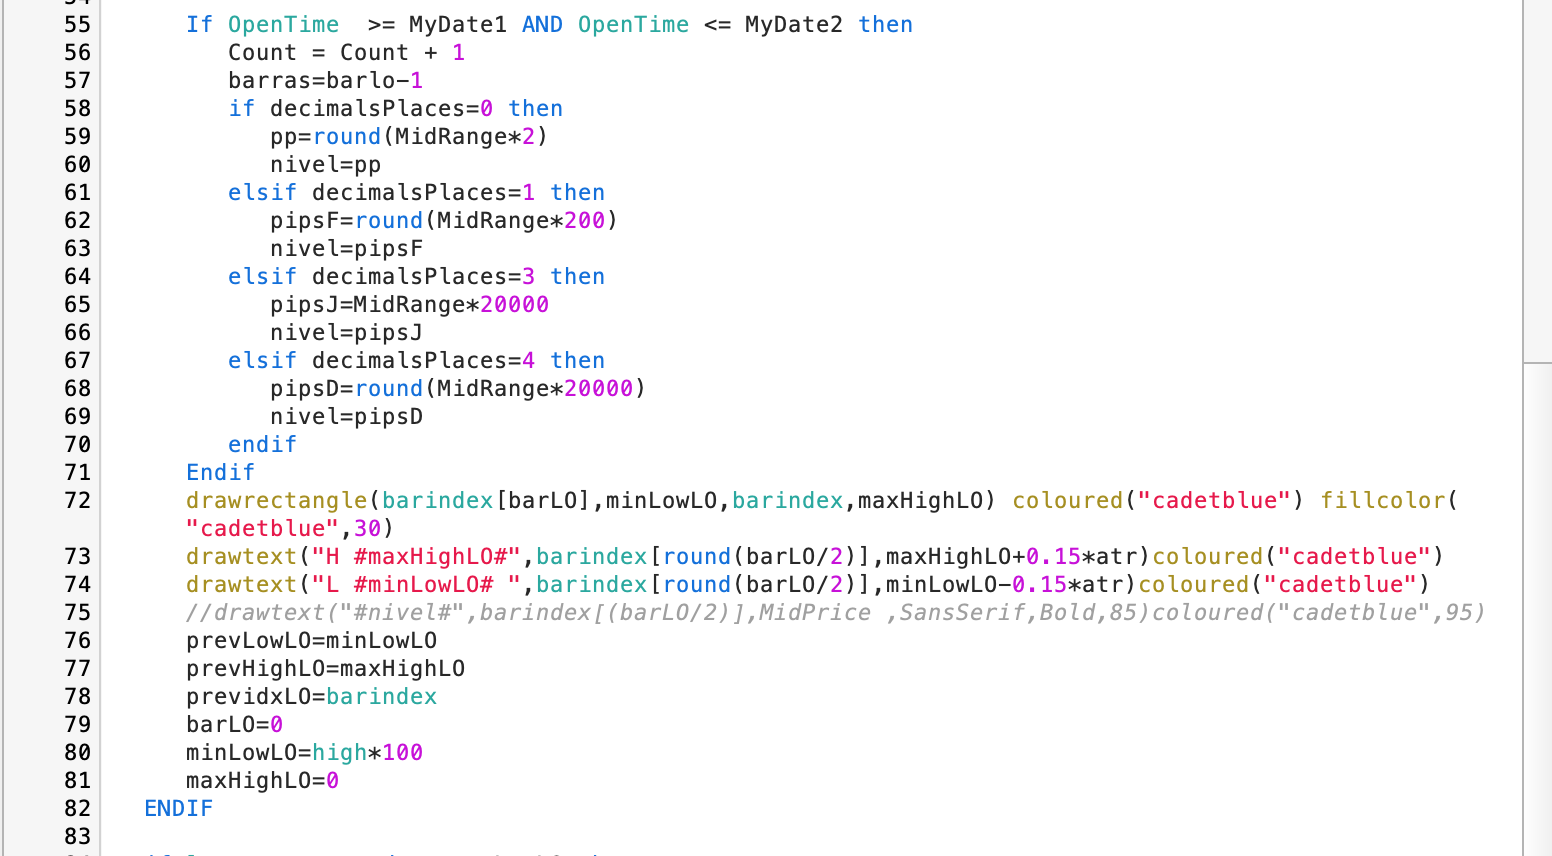
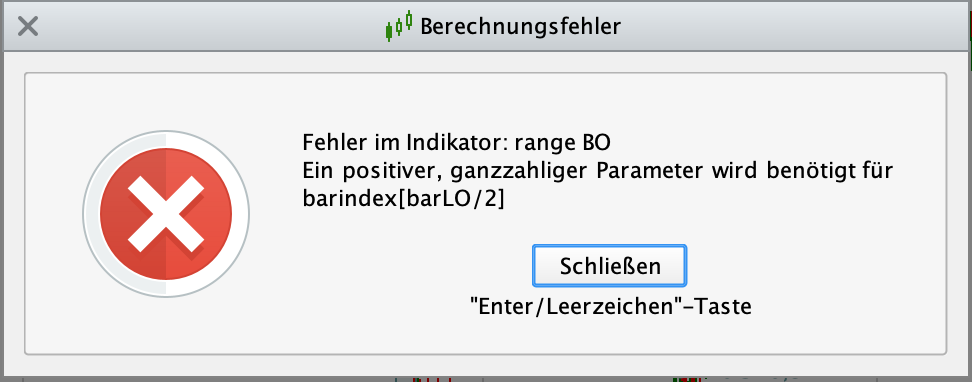
Poner el numero de Pips en el grafico del precio
Viewing 3 posts - 1 through 3 (of 3 total)
Viewing 3 posts - 1 through 3 (of 3 total)
- You must be logged in to reply to this topic.
New Reply

Summary
This topic contains 2 replies,
has 2 voices, and was last updated by ![]()
9 months, 4 weeks ago.
Topic Details
| Forum: | ProBuilder: Indicadores y Herramientas |
| Language: | Spanish |
| Started: | 06/12/2025 |
| Status: | Active |
| Attachments: | 2 files |
Loading...