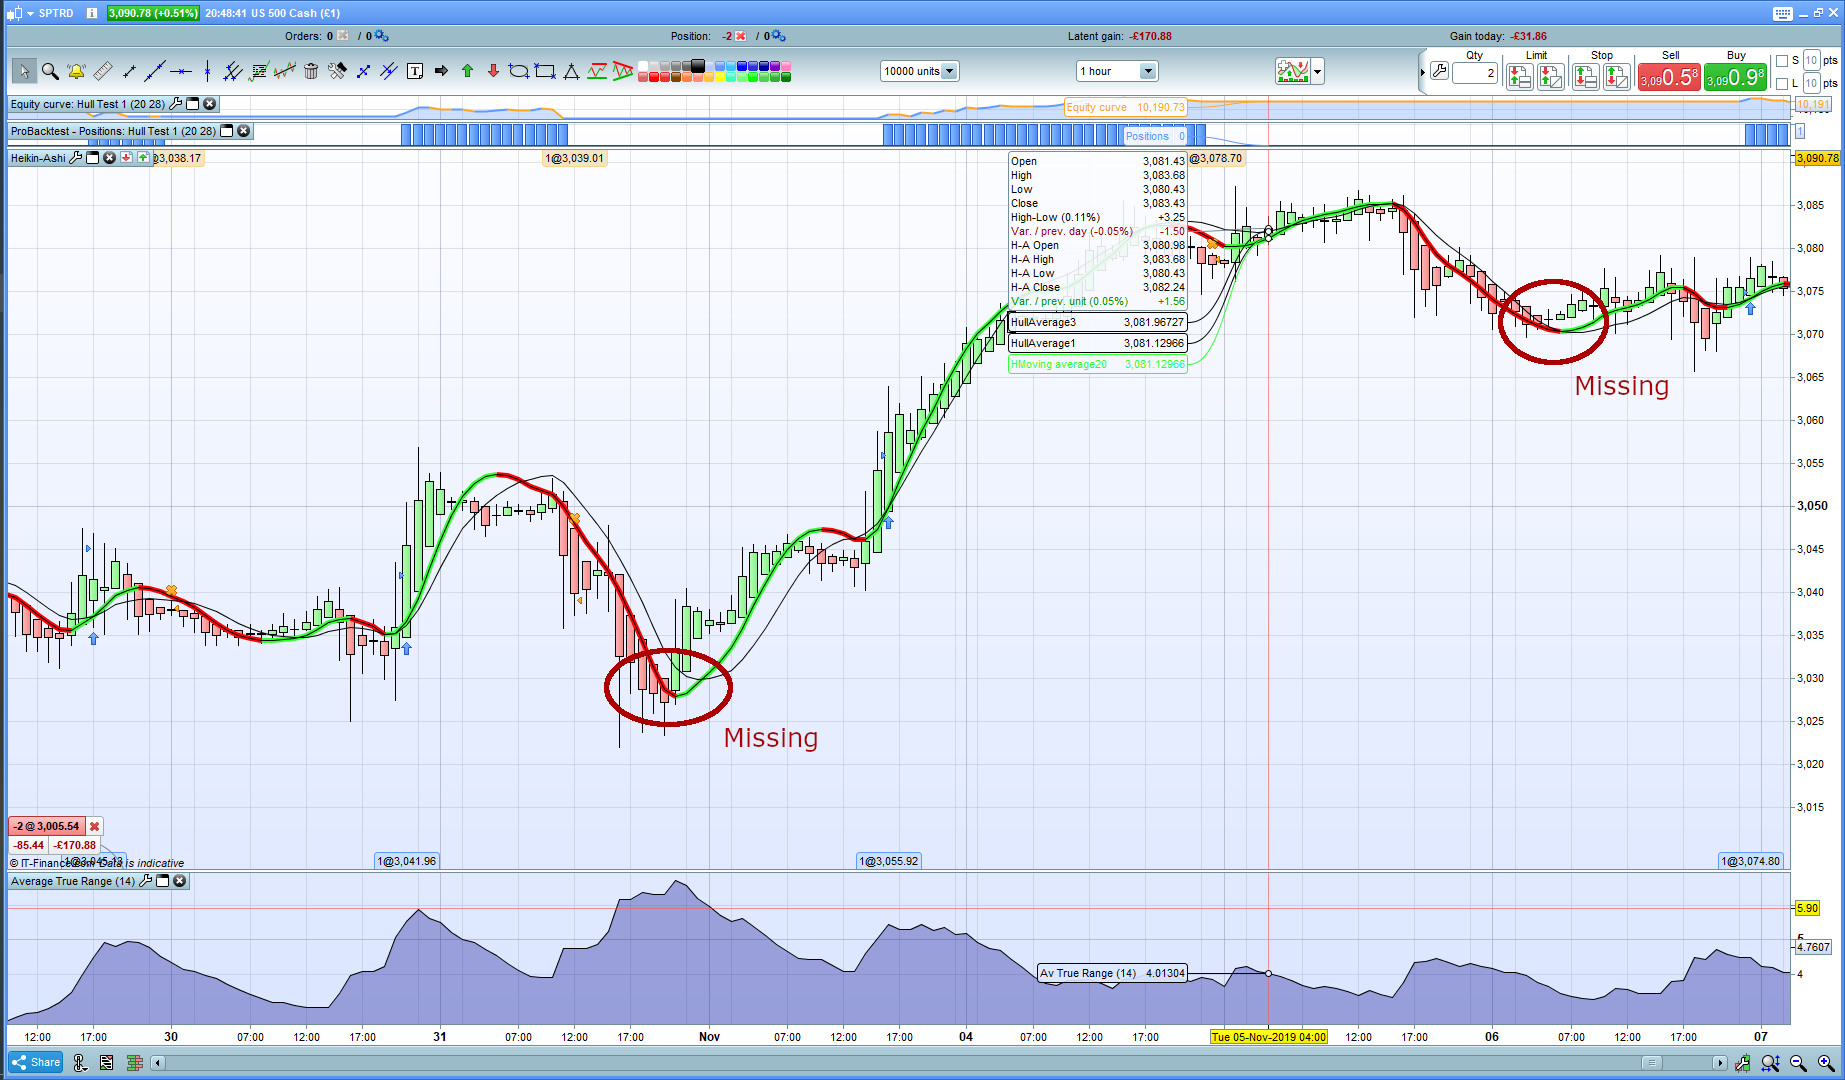
I am testing a few simple strategies, one of them being to buy when the Hull moving average changes from red to green. This has been addressed before and is easy to implement. However, when I run this strategy, ProRealTime only places orders at certain times and not others (see attachment). I have posted here the simplified code which is run on the US 500 Cash 1hour. What am I missing?
//Market: US 500 Cash
//Timeframe: 1h

DEFPARAM CumulateOrders=False
Period1=20
Period3=28
PositionSize = 1

timeframe(default)
HullAverage1=WeightedAverage[round(sqrt(Period1))](2*WeightedAverage[round(Period1/2)](close)-WeightedAverage[Period1](close))
Bull1 = HullAverage1 >= HullAverage1[1]
Bear1 = HullAverage1 =< HullAverage1[1]

If (Bull1 and Bear1[1]) then
buy PositionSize contract at market
//SET STOP pLOSS sl
endif

HullAverage3=WeightedAverage[round(sqrt(Period3))](2*WeightedAverage[round(Period3/2)](close)-WeightedAverage[Period3](close))
//Bull3=HullAverage3>HullAverage3[1]
Bear3 = HullAverage3 < HullAverage3[1]

If Bear3 then
sell at market
endif


graphonprice HullAverage1
graphonprice HullAverage3
Due to the “=” operator in lines 11 and 12, should this be true, line 12 would always override the result from line 11. You should place “=” only in one of them. In your case it’s the same as line 11 without the “=” operator.
Line 9 is useless when not using multiple time frames.
Set your price chart to japanese candlesticks, not heikin-ashi, or use HA in your code. They don’t match, obviously.
Thank you for the quick reply. The full strategy is mutliple time frame, and I left in line 9 by kistake when simplifying the code to try and resolve the specific problem.
If I take out the ‘=’ in lines 11 and 12, or in only one of the lines, the result is the same. Also, I am trading off the Hull moving average which is not affected by having candlesticks or Heikin Ashi – I have changed to candlesticks now but it makes no difference. The turning points still do not get noticed in some instances. It is really strange and I do not understand it.
This is the correct formula, the same one used by PRT:
x1     = WeightedAverage[Period](close)
x2     = (2 * WeightedAverage[round(Period/2)](close)) - x1
HullMA = WeightedAverage[round(sqrt(Period))](x2)
RETURN HullMA
Thank you. That is the same formula I have used. I am still puzzled by why, what seems a simple rule, does not always show in the trades. I assume it is something simple I am not doing.
One of the condition you set in the other timeframe could result “false” at that moment. Did you try to GRAPH all your variables to analyze them, @Analyst? 😆
You are using a 1-line formula that can be misinterpreted by the text parser.
”Divide and Conquer” is always a better approach. Keeping the code clearer and easier to read is the best choice not just to help other readers, but mainly yourself when maintaining code after months or years from when it was first written.
Adding comments when needed is also beneficial for future use.
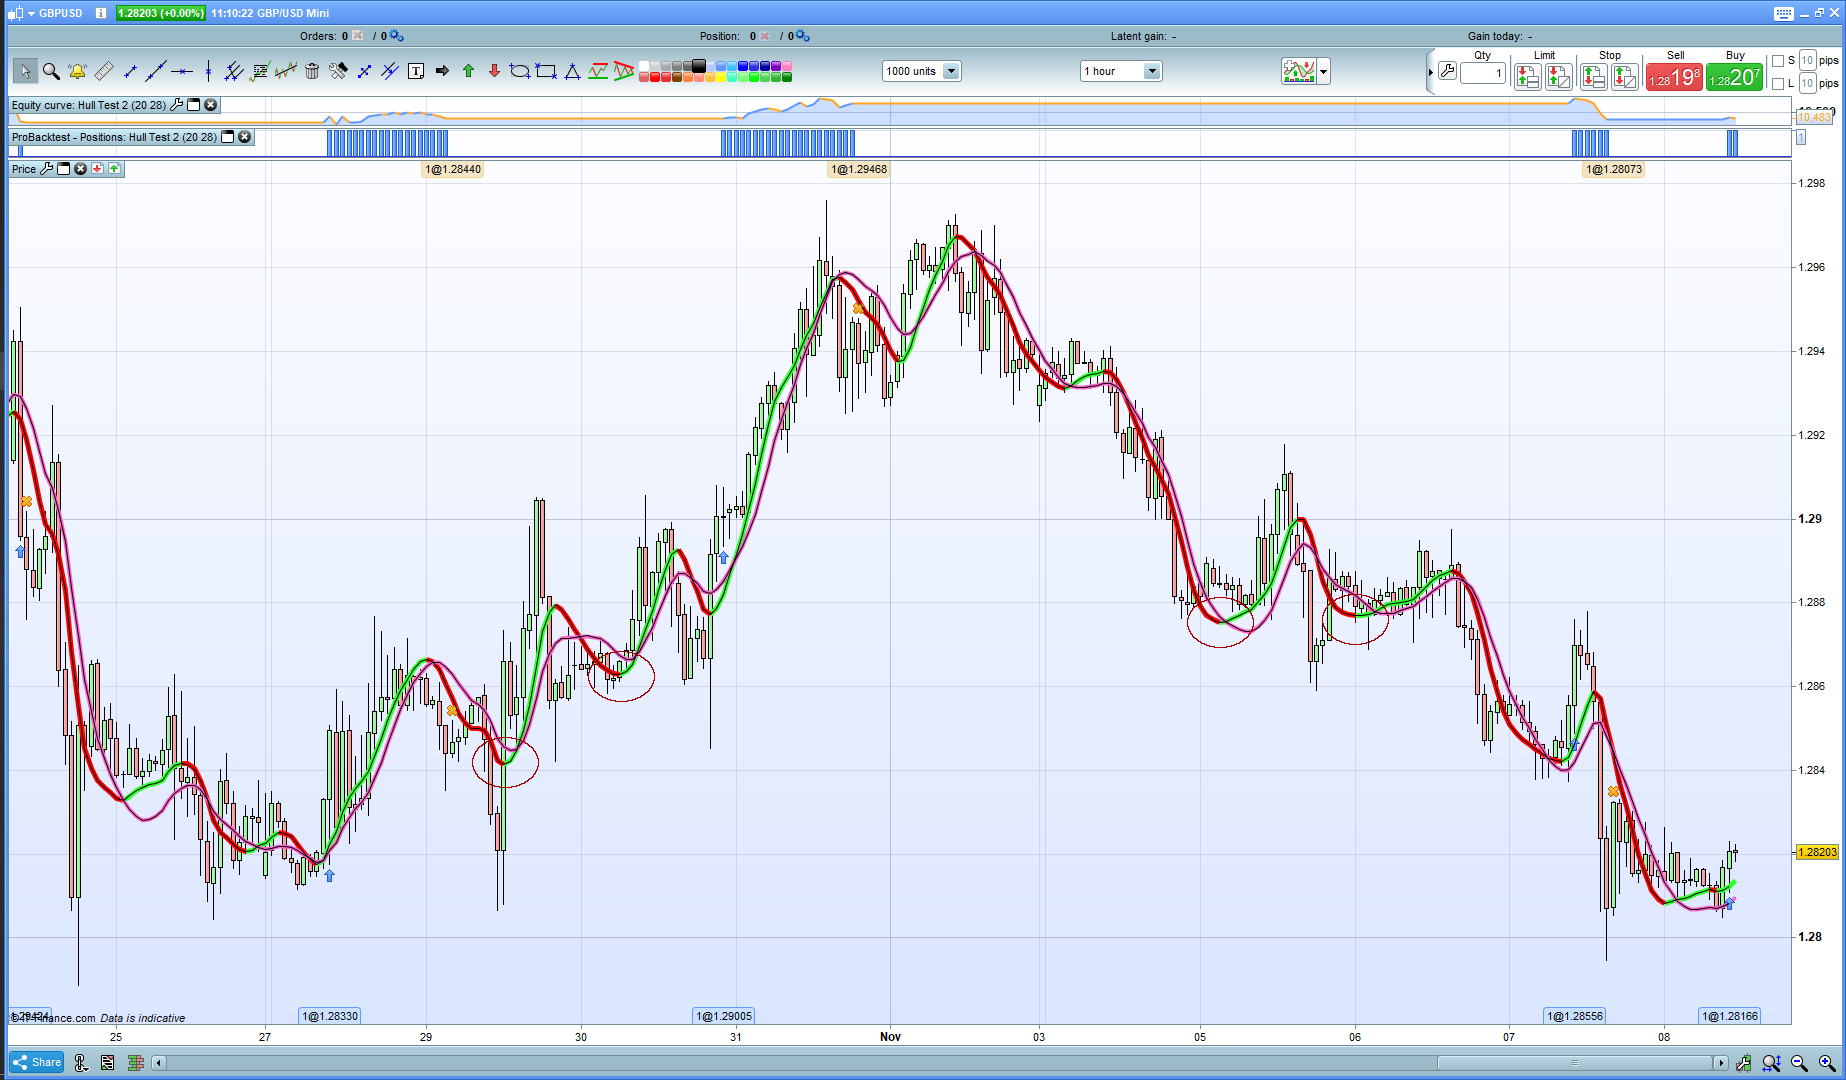
I have changed the code to reflect suggestions. I have also removed all reference to other time frames – this code runs on one time frame only. I have also attached a new picture. Note that the green/red Hull MA is created by the platform indicators. The thin black line on top is the graphed Hull MA from the code. They overlap. I am still puzzled. This is from today’s data so should be able to be easily replicated by anyone pasting the code into their own platform.
//Market: GBPUSD
//Timeframe: 1h

DEFPARAM CumulateOrders=False
Period1=20
Period3=28
PositionSize = 1

//Calculate Hull Moving Average for Entry signal
x1     = WeightedAverage[Period1](close)
x2     = (2 * WeightedAverage[round(Period1/2)](close)) - x1
HullMA1 = WeightedAverage[round(sqrt(Period1))](x2)

Bull1 = HullMA1 >= HullMA1[1]
Bear1 = HullMA1 < HullMA1[1]

If (Bull1 and Bear1[1]) then
buy PositionSize contract at market
//SET STOP pLOSS sl
endif

//Calculate Hull Moving Average for Exit signal
y1     = WeightedAverage[Period3](close)
y2     = (2 * WeightedAverage[round(Period3/2)](close)) - y1
HullMA3 = WeightedAverage[round(sqrt(Period3))](y2)
//Bull3=HullAverage3>HullAverage3[1]
Bear3 = HullMA3 < HullMA3[1]

If Bear3 then
sell at market
endif


graphonprice HullMA1
graphonprice HullMA3
I can’t see any thin black line on top on the image you posted … is it my eyes again!? 🙂 I have zoomed in also.
(Btw … much better equity curve / profit on 2 hour TF. but I know that is not the point of the Thread … just saying.)
PS I can see the black line now … I read on top as ‘above’! Doh me! 🙂
They overlap. I am still puzzled
Why are you puzzled?
What would you expect HullMA1 and HullMA3 to do (but overlap) as they are the same code (thanks to Roberto) which replicates the Platform code for Hull MA??
No worries. It was just to show that the code produced the same MA as the PRT indicator.
They overlap. I am still puzzled
Why are you puzzled?
What would you expect HullMA1 and HullMA3 to do (but overlap) as they are the same code (thanks to Roberto) which replicates the Platform code for Hull MA??
Sorry, a misunderstanding. I am not puzzled by the overlap (expected) but by the problem being discussed in the thread. It is very strange to me that a buy signal is sometimes produced but not always, and if one studies the chart, it should be there. It is based on one criteria, that being that the indicator changes direction.
buy signal is sometimes produced but not always
Right gotcha … and the red circles are where a BUY doesn’t happen (when expected to).
I’ll think on it now.
Cheers
PS have you tried using Cursor Details and looked at the exact values of HullMA1 on that bar … it can be deceiving looking at the overall curves and when you look at exact values for that bar it often shows that code works as it should
Change your exit conditions to the following and all will work as you think it should:
If onmarket and Bear3 then
The problem is that your entry and exit conditions can sometimes both be true at the same time and so the sell order cancels the buy order.
My test works perfectly, please attach the same pic as before (not with HA candlesticks) AND let the mouse sit on a candle so that data about onscreen MA’s are shown on the pic.
Vonasi is right, try that before.