


Pivot Support résistance bands

Viewing 3 posts - 1 through 3 (of 3 total)
  • Author
    Posts
  • #193077 quote
    Manu L.Manu L.
    Participant
    Average

    Bonjour à tous,

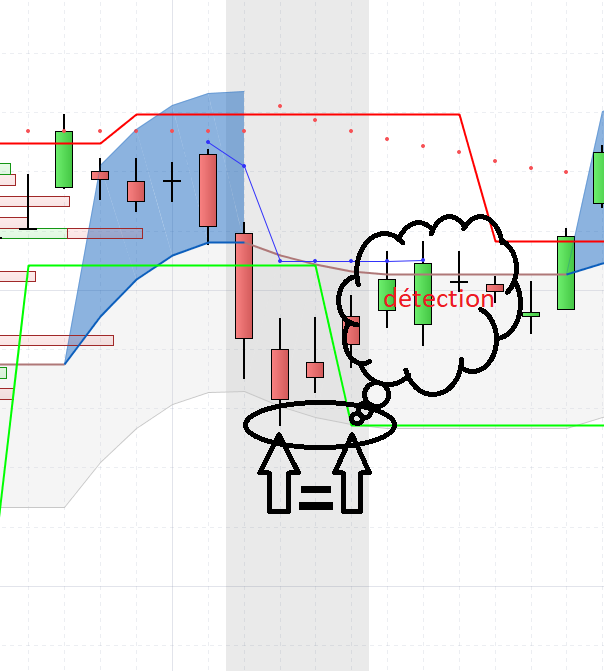
    une âme charitable qui pourrait créer ce screener sur la base de cet indicateur permettant de mettre en évidence la bougie (ouverture ou plus bas) = au support mais 2 jours en amont (voir pj pour mieux comprendre)  avec un capital échangé le jour même >= à 500 000.

    Pivot Support & Resistance Bands

    // Pivot Support & Resistance Bands
    //
    //
    DEFPARAM CalculateOnLastBars = 1000
    //p          = 2                      //2  periods
    //Type       = 1                      //1 = Ema
    p            = max(1,min(999,p))      //range 1 - 999
    Type         = max(0,min(6,Type))     //range 0 - 6
    PivotBAR     = 2                      //2  bars AFTER  pivot PASSAGE A 0 AU LIEU DE 2
    LookBack     = 4                      //4  bars BEFORE pivot
    BarLookBack  = PivotBAR + 1
    IF low[PivotBAR] < lowest[LookBack](low)[BarLookBack] THEN
    IF low[PivotBAR] = lowest[BarLookBack](low) THEN
    //MySupport     = BarIndex - PivotBAR
    SupportPrice  = low[PivotBAR]
    ENDIF
    ENDIF
    IF high[PivotBAR] > highest[LookBack](high)[BarLookBack] THEN
    IF high[PivotBAR]  = highest[BarLookBack](high) THEN
    //MyResistance    = BarIndex - PivotBAR
    ResistancePrice = high[PivotBAR]//high[BarIndex - MyResistance]
    ENDIF
    ENDIF
    EmaResistance  = average[p,Type](ResistancePrice)
    EmaSupport     = average[p,Type](SupportPrice)
    MidLine        = EmaSupport + ((EmaResistance - EmaSupport) / 2)
    //DRAWSEGMENT(MyResistance,ResistancePrice,BarIndex,ResistancePrice) COLOURED(255,0,0,255)
    //DRAWSEGMENT(MySupport,SupportPrice,BarIndex,SupportPrice) COLOURED(0,128,0,255)
    RETURN EmaResistance COLOURED(255,0,0,255) AS "EmaResistance",EmaSupport COLOURED(0,255,0,255) AS "EmaSupport",MidLine coloured(0,0,0,255) AS "MidLine"


    Merci d’avance 🙂

    Sans-titre-1.png Sans-titre-1.png
    #193326 quote
    NicolasNicolas
    Keymaster
    Legend

    Si j’ai bien compris, il faut alerter avec ProScreener quand la ligne verte a changé il y a moins de 2 jours ? (avec une condition de volume sur la barre actuelle), est-ce bien cela ?

    #194010 quote
    Manu L.Manu L.
    Participant
    Average

    Le but étant de détecter le changement d’état de la barre verte et que celle-ci se retrouve sur le même plan que le plus bas ou la clôture ou l’ouveture de la bougie antérieure à -2 périodes.

Viewing 3 posts - 1 through 3 (of 3 total)

  • You must be logged in to reply to this topic.

ProRealAI ProRealAI New

Stuck on this ProBuilder code?

Describe what this topic is trying to build, in plain English, and ProRealAI writes the ProRealTime™ indicator, screener or system for you.

Available in 7 languages
Try ProRealAI

Pivot Support résistance bands


ProScreener : Scanners de Marché & Détection

New Reply
Author
author-avatar
Manu L. @manu-l Participant
Summary

This topic contains 2 replies,
has 2 voices, and was last updated by Manu L.Manu L.

4 years, 4 months ago.

Topic Details
Forum: ProScreener : Scanners de Marché & Détection
Language: French
Started: 05/11/2022
Status: Active
Attachments: 1 files
ProRealCode ProRealCode
Loading...

