Bonjour
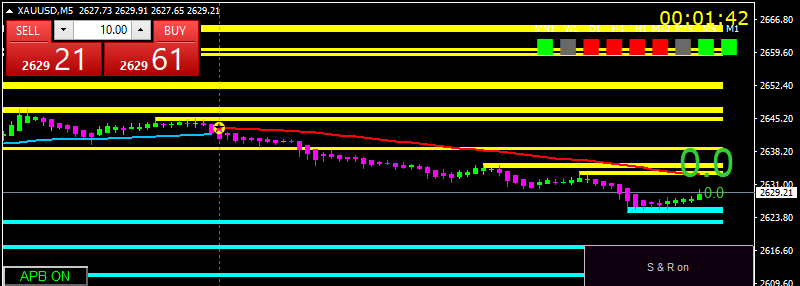
Pourriez-vous convertir cet indicateur mq4 vers prorealtime s’il vous plaît se sont les supports et résistances en jaune et bleu un grand merci d’avance
Cordialement
Je me permets de relancer cette demande de cet indicateur pour déceler des zones de support/résistance, J’ai essayé de traduire avec chatGPT mais je n’y arrive pas, si quelqu’un pourrait m’aider à traduire ce code, En vous remerciant pour votre aide Cordialement
Bonjour, quelqu’un pourrait m’aider à traduire ce code, En vous remerciant pour votre aide Cordialement
Bonjour, il faudrait copier le code et le poster directement ici… Tout le monde n’a pas metatrader.
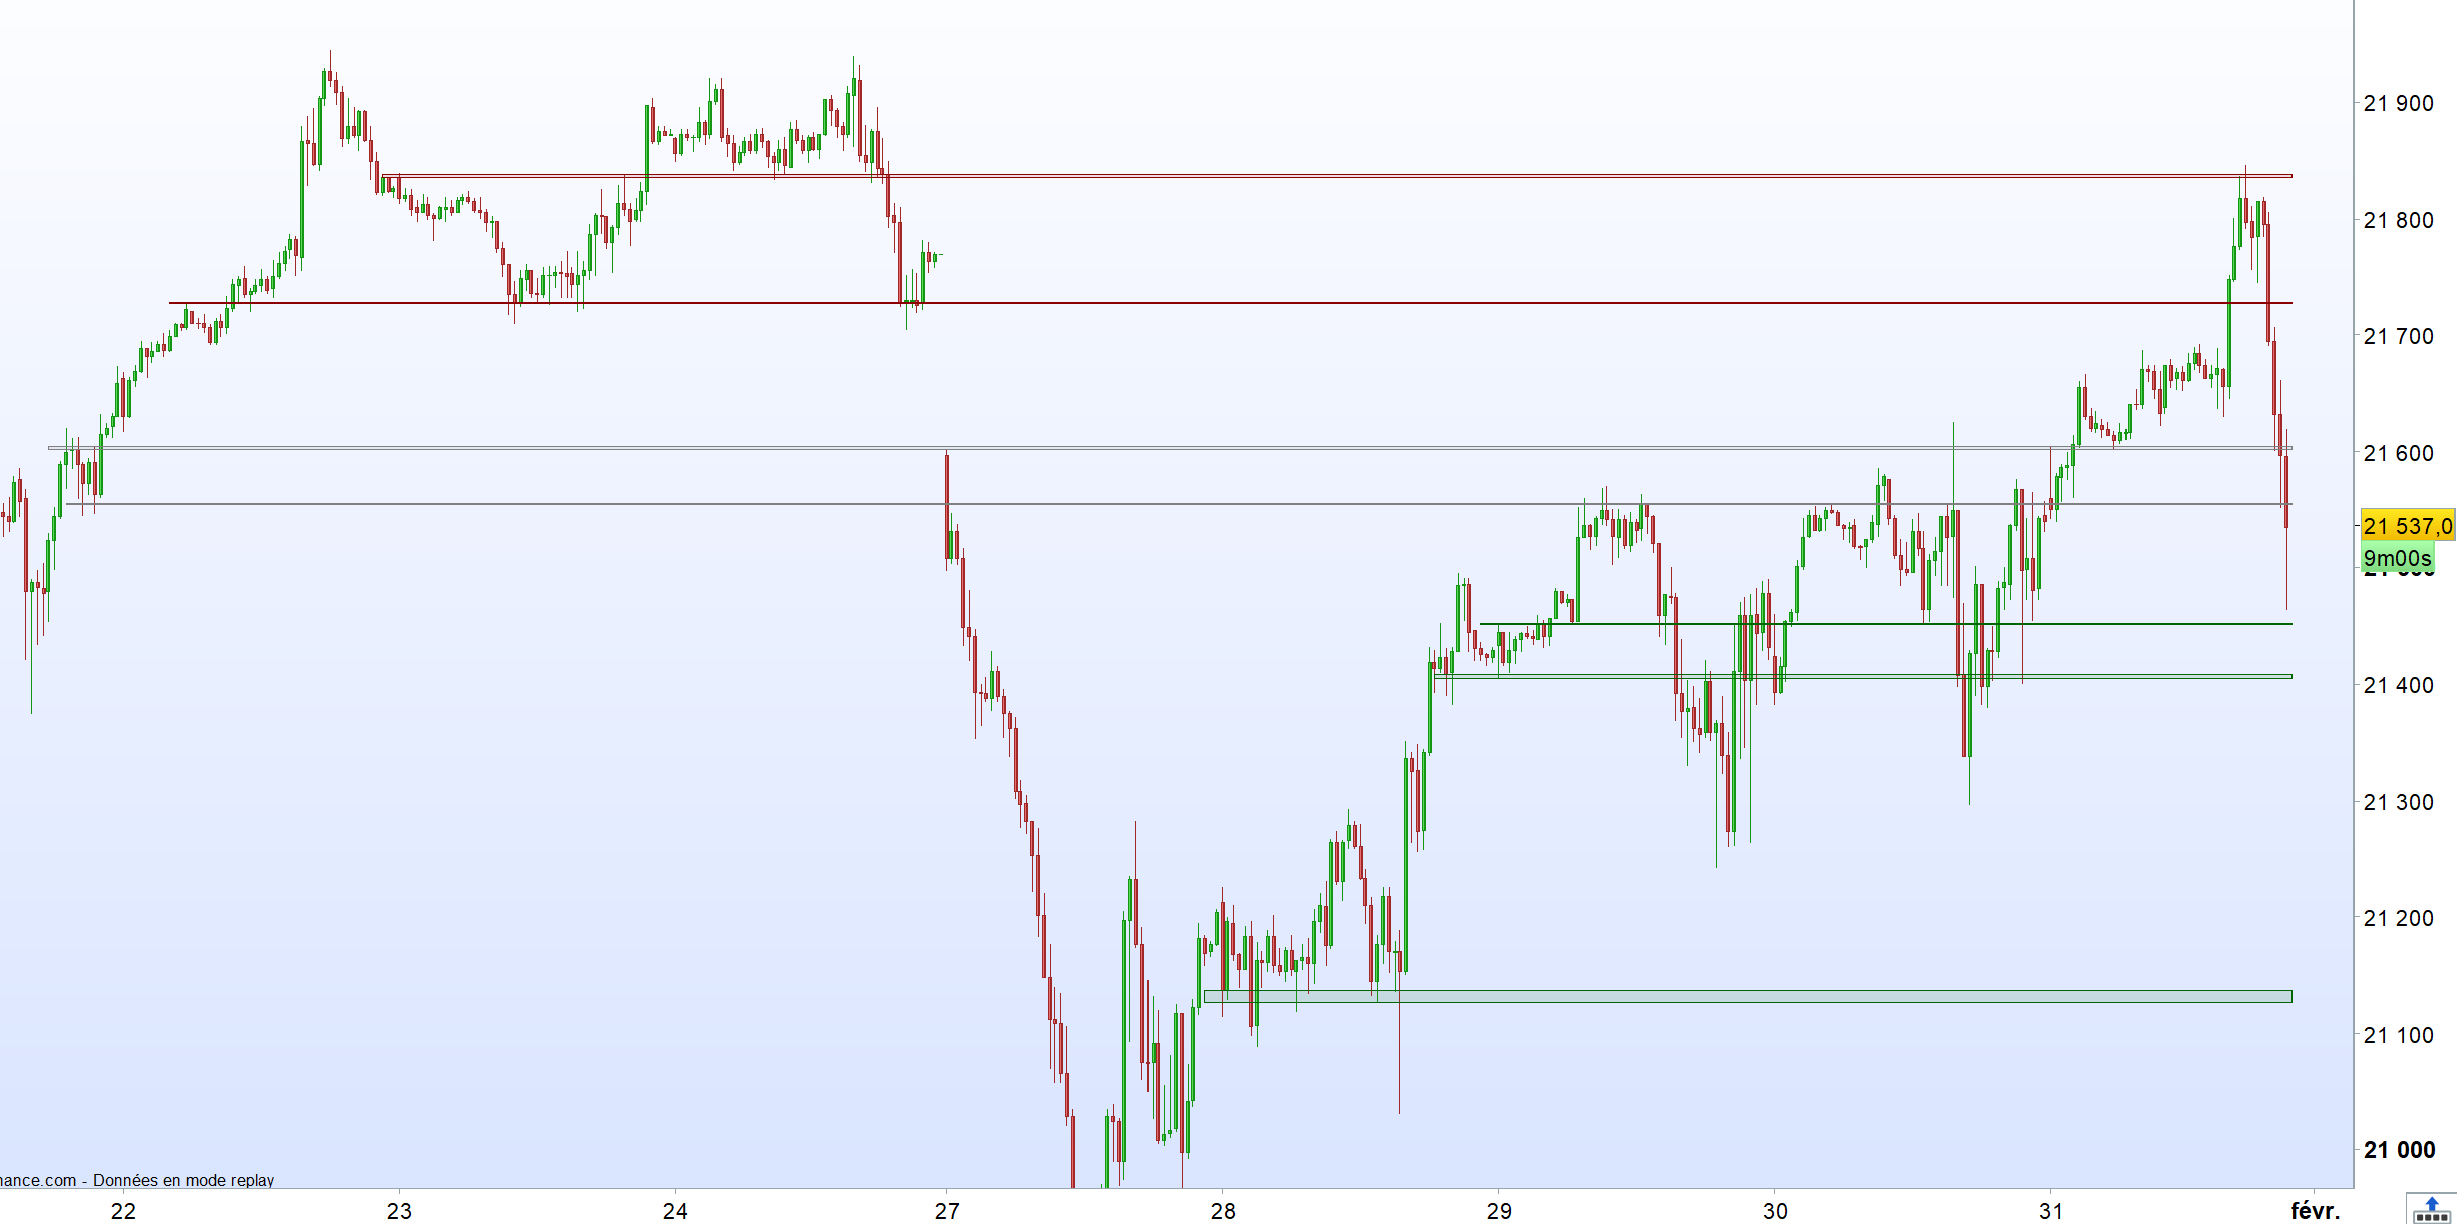
Sinon, voici un code simple mais certainement plus efficace pour détecter les supports et résistances :
DefParam DrawOnLastBarOnly = true

once PHn = -1
once PLn = -1
once Bindex = -1
once LastHigh= 0
once LastLow = 0

IF barindex >= prdG+prdD+1 then

If high[prdD] = highest[prdG+prdD+1](high) and barindex > LastHigh+prdD then
Bindex = Bindex+1
$BoxI[Bindex]=barindex-prdG-prdD
$BoxH[Bindex]=high[prdD]
$BoxL[Bindex]=highest[prdG+prdD+1](close)
LastHigh = barindex
Endif

If low[prdD] = lowest[prdG+prdD+1](low) and barindex > LastLow+prdD then
Bindex = Bindex+1
$BoxI[Bindex]=barindex-prdG-prdD
$BoxH[Bindex]=lowest[prdG+prdD+1](close)
$BoxL[Bindex]=low[prdD]
LastLow = barindex
Endif

If islastbarupdate then

unset($BH)
unset($BL)
unset($BI)
unset($BS)
Bi = -1

Start = Max(0,Bindex-MinPivotsCheck+1)

For i = start to Bindex do
BH1 = $BoxH[i]
BL1 = $BoxL[i]
BS = 1

For j = i+1 to Bindex do

if j = i then
break
endif

BH2 = $BoxH[j]
BL2 = $BoxL[j]

plushaut = BL2 > BH1
plusbas = BH2 < BL1
if not plushaut and not plusbas then
BH1 = min(BH1,BH2)
BL1 = max(BL1,BL2)
BS = BS+1
endif
Next

If BS >= MinReject then
ok = 1
for k = 0 to Bi do
BH2 = $BH[k]
BL2 = $BL[k]
plushaut = BL2 > BH1
plusbas = BH2 < BL1
if not plushaut and not plusbas then
BH1 = min(BH1,BH2)
BL1 = max(BL1,BL2)
ok = 0
$BH[k]= BH1
$BL[k]= BL1
$BS[k]= BS
break
endif
next
if ok then
Bi = Bi+1
$BH[Bi]= BH1
$BL[Bi]= BL1
$BI[Bi]= $BoxI[i]
$BS[Bi]= BS
endif
endif
Next

For i = 0 to Bi do
if high < $BH[i] then
Drawrectangle($BI[i],$BH[i],barindex+1,$BL[i]) bordercolor("darkred",255) style(line,1) coloured("darkred",30)
elsif low > $BL[i] then
Drawrectangle($BI[i],$BH[i],barindex+1,$BL[i]) bordercolor("Darkgreen",255) style(line,1) coloured("darkgreen",30)
else
Drawrectangle($BI[i],$BH[i],barindex+1,$BL[i]) bordercolor("grey",255) style(line,1) coloured("grey",30)
endif
Next
Endif
Endif

Return
Bonjour, Je vous remercie pour votre réponse
Mais si c’était possible de traduire
Le code que J’ai fourni ça serait cool
En vous remerciant pour votre aide
Ci-joint le codes
//+——————————————————————+
//| Gann high-low activator |
//| |
//+——————————————————————+
#property copyright “www.forex-station.com”
#property link “www.forex-station.com”
#property indicator_chart_window
#property indicator_buffers 3
#property indicator_color1 CLR_NONE
#property indicator_color2 CLR_NONE
#property indicator_color3 CLR_NONE
#property indicator_width1 2
#property indicator_width2 2
#property indicator_width3 2
extern string TimeFrame = “Current time frame”;
extern int Lb = 51;
extern bool alertsOn = false;
extern bool alertsOnCurrent = false;
extern bool alertsMessage = false;
extern bool alertsSound = false;
extern bool alertsEmail = false;
extern bool Interpolate = false;
extern int MaxBars = 1000; // Dodane ograniczenie liczby świec
double gup[];
double gdna[];
double gdnb[];
double trend[];
int timeFrame;
string indicatorFileName;
bool returnBars;
bool calculateValue;
//+——————————————————————
//| Initialization |
//+——————————————————————
int init()
{
for (int i = 0; i < indicator_buffers; i++) SetIndexStyle(i, DRAW_LINE);
IndicatorBuffers(4);
SetIndexBuffer(0, gup); SetIndexDrawBegin(0, Lb + 1);
SetIndexBuffer(1, gdna); SetIndexDrawBegin(1, Lb + 1);
SetIndexBuffer(2, gdnb); SetIndexDrawBegin(2, Lb + 1);
SetIndexBuffer(3, trend);
indicatorFileName = WindowExpertName();
calculateValue = (TimeFrame == “calculateValue”); if (calculateValue) return(0);
returnBars = (TimeFrame == “returnBars”); if (returnBars) return(0);
timeFrame = stringToTimeFrame(TimeFrame);
IndicatorShortName(“”);
SetIndexLabel(0, NULL);
SetIndexLabel(1, NULL);
SetIndexLabel(2, NULL);
SetIndexLabel(3, NULL);
return(0);
}
//+——————————————————————
//| Deinitialization |
//+——————————————————————
int deinit()
{
// Remove all vertical lines created by this indicator
for (int i = ObjectsTotal() – 1; i >= 0; i–)
{
string name = ObjectName(i);
if (StringSubstr(name, 0, 4) == “Line”)
{
ObjectDelete(name);
}
}
return(0);
}
//+——————————————————————
//| Calculation |
//+——————————————————————
int start()
{
int counted_bars = IndicatorCounted();
int i, limit;
if (counted_bars < 0) return(-1);
if (counted_bars > 0) counted_bars–;
limit = MathMin(Bars – counted_bars, Bars – 1);
// Zastosowanie ograniczenia MaxBars
limit = MathMin(limit, MaxBars);
if (returnBars) { gup[0] = limit + 1; return(0); }
if (calculateValue || timeFrame == Period())
{
if (!calculateValue && trend[limit] == -1) CleanPoint(limit, gdna, gdnb);
for (i = limit; i >= 0; i–)
{
gdna[i] = EMPTY_VALUE;
gdnb[i] = EMPTY_VALUE;
trend[i] = trend[i + 1];
if (Close[i] > iMA(Symbol(), 0, Lb, 0, MODE_EMA, PRICE_HIGH, i + 1)) trend[i] = 1;
if (Close[i] < iMA(Symbol(), 0, Lb, 0, MODE_EMA, PRICE_LOW, i + 1)) trend[i] = -1;
if (trend[i] == -1)
gup[i] = iMA(Symbol(), 0, Lb, 0, MODE_EMA, PRICE_HIGH, i + 1);
else
gup[i] = iMA(Symbol(), 0, Lb, 0, MODE_EMA, PRICE_LOW, i + 1);
if (!calculateValue && trend[i] == -1) PlotPoint(i, gdna, gdnb, gup);
// Check for trend change and draw vertical line
if (i < Bars – 1 && trend[i] != trend[i + 1] && trend[i] != 0)
{
DrawVerticalLine(i, trend[i]);
}
}
ManageVerticalLines();
manageAlerts();
return(0);
}
limit = MathMax(limit, MathMin(Bars – 1, iCustom(NULL, timeFrame, indicatorFileName, “returnBars”, 0, 0) * timeFrame / Period()));
if (trend[limit] == -1) CleanPoint(limit, gdna, gdnb);
for (i = limit; i >= 0; i–)
{
int y = iBarShift(NULL, timeFrame, Time[i]);
gdna[i] = EMPTY_VALUE;
gdnb[i] = EMPTY_VALUE;
gup[i] = iCustom(NULL, timeFrame, indicatorFileName, “calculateValue”, Lb, 0, y);
trend[i] = iCustom(NULL, timeFrame, indicatorFileName, “calculateValue”, Lb, 3, y);
if (timeFrame <= Period() || y == iBarShift(NULL, timeFrame, Time[i – 1])) continue;
if (!Interpolate) continue;
datetime time = iTime(NULL, timeFrame, y);
for (int n = 1; i + n < Bars && Time[i + n] >= time; n++) continue;
for (int k = 1; k < n; k++)
gup[i + k] = gup[i] + (gup[i + n] – gup[i]) * k / n;
}
for (i = limit; i >= 0; i–) if (trend[i] == -1) PlotPoint(i, gdna, gdnb, gup);
ManageVerticalLines();
manageAlerts();
return(0);
}
//+——————————————————————
//| Manage Alerts |
//+——————————————————————
void manageAlerts()
{
if (!calculateValue && alertsOn)
{
int whichBar = alertsOnCurrent ? 0 : 1;
whichBar = iBarShift(NULL, 0, iTime(NULL, timeFrame, whichBar));
if (trend[whichBar] != trend[whichBar + 1])
{
if (trend[whichBar] == 1) doAlert(whichBar, “UP TREND”);
if (trend[whichBar] == -1) doAlert(whichBar, “DOWN TREND”);
}
}
}
//+——————————————————————
//| Do Alert |
//+——————————————————————
void doAlert(int forBar, string doWhat)
{
static string previousAlert = “nothing”;
static datetime previousTime;
string message;
if (previousAlert != doWhat || previousTime != Time[forBar])
{
previousAlert = doWhat;
previousTime = Time[forBar];
message = StringConcatenate(Symbol(), Period(), ” at “, TimeToStr(TimeLocal()), “::: “, doWhat);
if (alertsMessage) Alert(message);
if (alertsEmail) SendMail(StringConcatenate(Symbol(), “Gann HL “), message);
if (alertsSound) PlaySound(“alert2.wav”);
}
}
//+——————————————————————
//| Draw Vertical Line |
//+——————————————————————
void DrawVerticalLine(int i, int trendValue)
{
datetime lineTime = Time[i];
string lineName = “Line” + TimeToStr(lineTime, TIME_DATE|TIME_MINUTES);
color lineColor = (trendValue == 1) ? Lime : Magenta;
// Check if the line already exists
if (ObjectFind(0, lineName) == -1)
{
ObjectCreate(0, lineName, OBJ_VLINE, 0, lineTime, 0);
ObjectSetInteger(0, lineName, OBJPROP_COLOR, lineColor);
ObjectSetInteger(0, lineName, OBJPROP_STYLE, STYLE_DOT);
ObjectSetInteger(0, lineName, OBJPROP_WIDTH, 1);
ObjectSetInteger(0, lineName, OBJPROP_RAY_RIGHT, false); // Ensure label is not printed
ObjectSetInteger(0, lineName, OBJPROP_BACK, true); // Draw line in background
}
else
{
ObjectSetInteger(0, lineName, OBJPROP_COLOR, lineColor); // Update line color if it exists
}
}
//+——————————————————————
//| Utility Functions |
//+——————————————————————
string sTfTable[] = {“M1”, “M5”, “M15”, “M30”, “H1”, “H4”, “D1”, “W1”, “MN”};
int iTfTable[] = {1, 5, 15, 30, 60, 240, 1440, 10080, 43200};
int stringToTimeFrame(string tfs)
{
tfs = stringUpperCase(tfs);
for (int i = ArraySize(iTfTable) – 1; i >= 0; i–)
if (tfs == sTfTable[i] || tfs == “” + iTfTable[i]) return(MathMax(iTfTable[i], Period()));
return(Period());
}
string timeFrameToString(int tf)
{
for (int i = ArraySize(iTfTable) – 1; i >= 0; i–)
if (tf == iTfTable[i]) return(sTfTable[i]);
return(“”);
}
string stringUpperCase(string str)
{
string s = str;
for (int length = StringLen(str) – 1; length >= 0; length–)
{
int tchar = StringGetChar(s, length);
if ((tchar > 96 && tchar < 123) || (tchar > 223 && tchar < 256))
s = StringSetChar(s, length, tchar – 32);
else if (tchar > -33 && tchar < 0)
s = StringSetChar(s, length, tchar + 224);
}
return(s);
}
void CleanPoint(int i, double& first[], double& second[])
{
if ((second[i] != EMPTY_VALUE) && (second[i + 1] != EMPTY_VALUE))
second[i + 1] = EMPTY_VALUE;
else if ((first[i] != EMPTY_VALUE) && (first[i + 1] != EMPTY_VALUE) && (first[i + 2] == EMPTY_VALUE))
first[i + 1] = EMPTY_VALUE;
}
void PlotPoint(int i, double& first[], double& second[], double& from[])
{
if (first[i + 1] == EMPTY_VALUE)
{
if (first[i + 2] == EMPTY_VALUE)
{
first[i] = from[i];
first[i + 1] = from[i + 1];
second[i] = EMPTY_VALUE;
}
else
{
second[i] = from[i];
second[i + 1] = from[i + 1];
first[i] = EMPTY_VALUE;
}
}
else
{
first[i] = from[i];
second[i] = EMPTY_VALUE;
}
}
//+——————————————————————
//| New Utility Function to Remove Vertical Line if Trend Reverts |
//+——————————————————————
void RemoveVerticalLineIfTrendReverts(int i)
{
datetime lineTime = Time[i];
string lineName = “Line” + TimeToStr(lineTime, TIME_DATE|TIME_MINUTES);
if (ObjectFind(0, lineName) != -1)
{
ObjectDelete(lineName);
}
}
//+——————————————————————
//| New Function to Manage Vertical Lines |
//+——————————————————————
void ManageVerticalLines()
{
int currentTrend = trend[0];
int previousTrend = trend[1];
if (currentTrend != previousTrend)
{
DrawVerticalLine(0, currentTrend);
}
else if (currentTrend == previousTrend && ObjectFind(0, “Line” + TimeToStr(Time[0], TIME_DATE|TIME_MINUTES)) != -1)
{
RemoveVerticalLineIfTrendReverts(0);
}
Bonjour. Voici l’indicateur.
// ---------------------------------------------------------
// Gann High-Low Activator
// ---------------------------------------------------------
DEFPARAM DrawOnLastBarOnly = false
// Parámetro
Lb = 51
// EMAs de High y Low (desplazadas 1 barra como en el original)
emaHigh = ExponentialAverage[Lb](high)[1]
emaLow = ExponentialAverage[Lb](low)[1]
// Detección de tendencia
IF close > emaHigh THEN
   trend = 1
ELSIF close < emaLow THEN
   trend = -1
ENDIF
// Valor a mostrar según tendencia
IF trend = -1 THEN
   gannLine = emaHigh
ELSE
   gannLine = emaLow
ENDIF
// Líneas verticales en cambios de tendencia
IF trend  trend[1] AND trend[1]  0 THEN
   IF trend = 1 THEN
      DRAWVLINE(barindex) COLOURED("Lime")style(dottedline)
   ELSE
      DRAWVLINE(barindex) COLOURED("Magenta")style(dottedline)
   ENDIF
ENDIF
// Color de la línea principal
IF trend = 1 THEN
   R = 0
   G = 255
   B = 0
ELSE
   R = 255
   G = 0
   B = 255
ENDIF
// ---------------------------------------------------------
RETURN gannLine COLOURED(R, G, B) STYLE(line, 2)AS "Gann HiLo"