Wing
WingParticipant
Veteran
I am wondering if anyone out there has experimented with pattern matching, in PRT, or using another platform/language.
By pattern matching, I mean for example: comparing the last 20 bars, trying to find a sequence of 20 bars in previous history that best match it. From this you can make predictions on how such a similar event will fall out. You compare two price sequences by finding a common low and/or high point as your base(s), and then compare each close. The difference between each close is then squared and a total score is produced for the sequence. The sequence with lowest score is the best match. Advanced algorithms would compare highs and lows as well.
Now, the problem is that PRT has a limitation on the number of iterations (for loops/if statements) that you can include in a system. This is probably to reduce server load. It also counts all indicators used in a system, so the max iterations are applied to the whole system. I believe this limit is 150 iterations per bar or something. It is possible to check for example this day’s price movement from 9;00 to 11:00 as compared to the same time period for each of the previous 100 days or so. To me, this is not enough. I have tried this out, but I am still unsure whether pattern matching is a viable strategy. In what markets/timeframes do you know/believe it performs well, or at all?
To battle this limit on PRT iterations, I have a few ideas in mind:
- Create multiple systems/indicators, that each check a certain time period every day.
- Build a smarter pattern matching algorithm that relies on high/low points instead of brute-forcing and checking every bar in every sequence. Does anyone have any ideas on this?
- If I can only compare a 15-bar sequence to 100 other 15-bar sequences, then create a filter that only compares it to good sequences. For example: sequence has a minimum range or is in a down/up trend.
- Reducing the number of iterations by storing/checking information in variables in a better way. Why, oh why, are there no arrays (except indicator arrays) in probuilder/proorder?
- If the above fails (which may be likely), build this pattern matching algorithm in another language.
Would appreciate any ideas on how to accomplish this. Ready to explain my ideas further if there are questions. I might post some code soon of my experiments so far.
I will also add that a bar sequence can be compared in two ways: with or without relativity. To compare two price movements that look similar, but where one has a range of 100 points and the other 50 points, the large one will be compressed to more easily be compared with the smaller one.
WingParticipant
Veteran
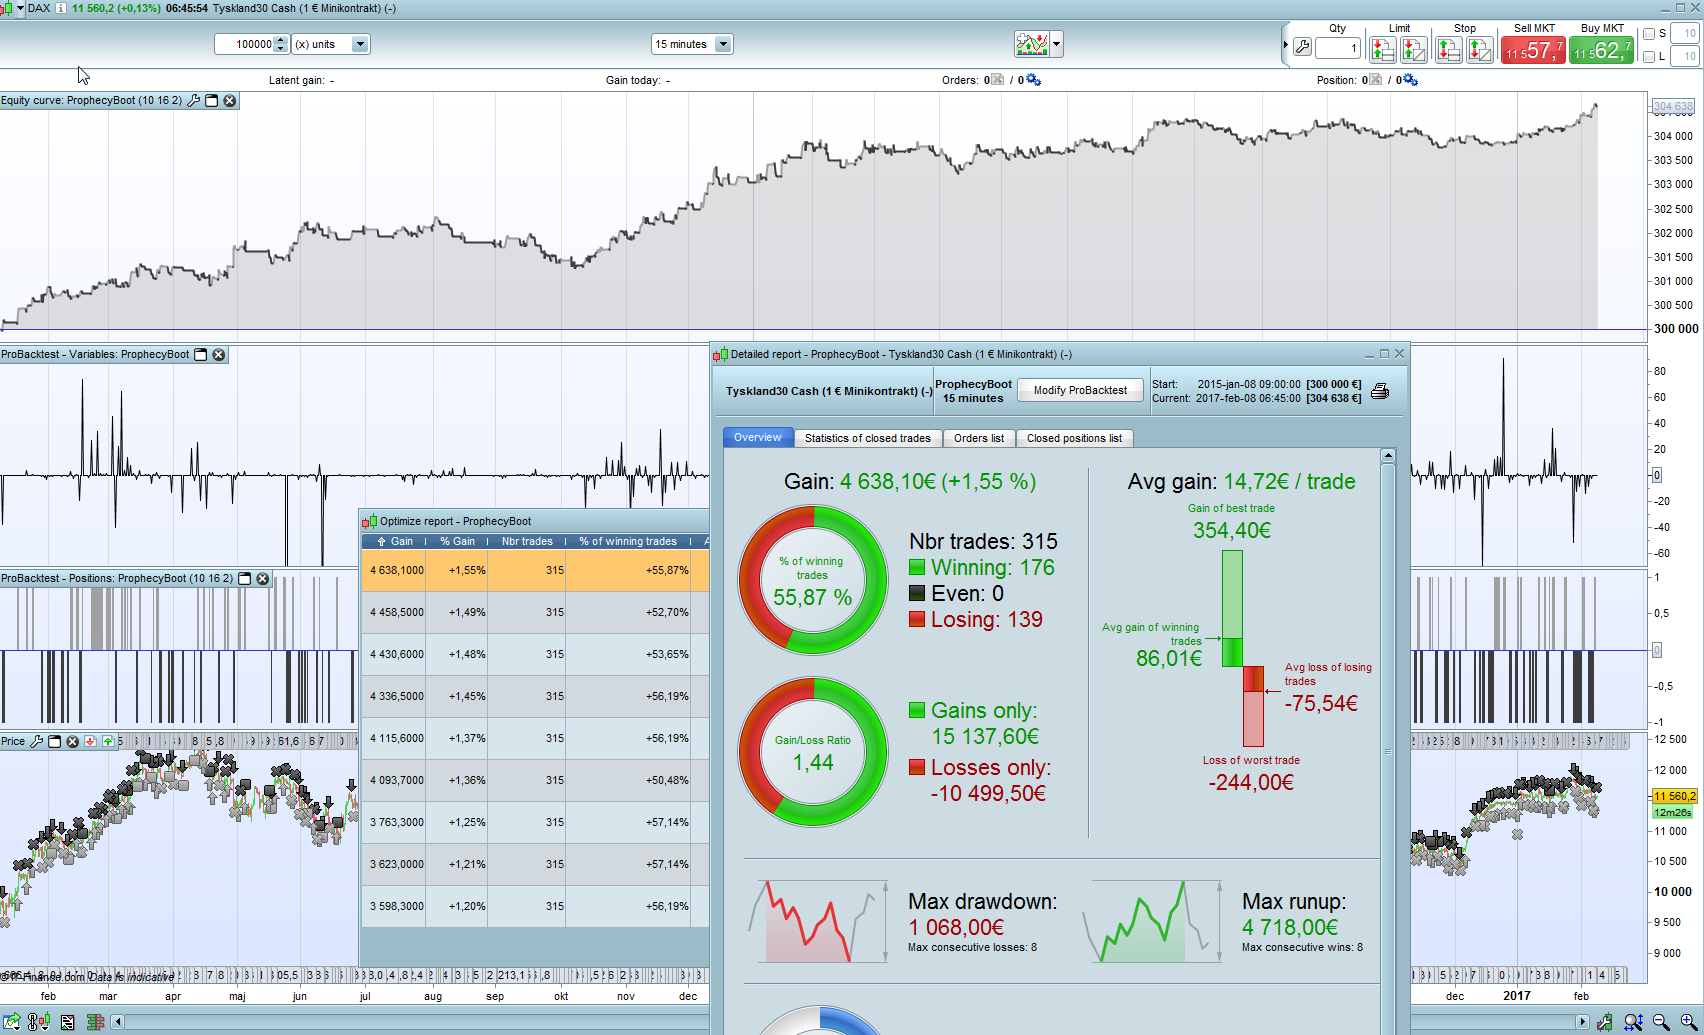
Since I have no replies I will share some code and promising results I have. This code is a proof-of-concept indicator that uses pattern matching to analyze for example the daily open of DAX30 on a 15m or 30m timeframe. I have included an image also that shows that this indicator can be used to create an edge. Since neither the indicator or system is finished, I don’t want to publish it in the library yet, but feel free to experiment with the indicator below. If people find this prototype of use it can be published in the library.
Indicator name: Wing’s Prophecy Boot version 0.1
Indicator description: Every day at a set time (time of open for example) indicator returns a score of positive or negative. This is the indicators prediction of how price will move. Bigger score means more probability.
How it works: At set time (example: 090000) check the 10 preceding bars. Compare these 10 bars to the exact same sequence of bars, in each of the approx. 100 previous days. Find the three best matches. Look how these best matches did, in terms of price change n bars later. Based on these previous movements, and their build-up’s similarities to this day’s price movements (accuracy of the pattern matching), form a ‘prophecy’ for how this day’s price will move.
Redommended timeframe: 15m or 30m.
////////////////////////////////////////////////////
//
// Wing's Prophecy Boot version 0.1 - (Pattern Matching indicator)
//
// Made by user "Wing" of ProRealCode.com
// https://www.prorealcode.com/user/wing/
//
//////////////////////////////////////////////////
//
// Parameters:

sep=92 // Number of bars between each pattern match. Should be equivalent to the amount of bars per day. Roughly 47 for 30m TF, 92 for 15m etc
starttime=090000 // What time each day to compare current pattern to previous days
fut= 16 // How many bars from best pattern match to look forward and see if pattern results in price increase/decrease. Must be less than 'sep'.
hindsight=95 // Number of days to look back. DO NOT CHANGE THIS PARAMETER unless you receive an error message. Generally, it can't look back more than 100 days.

//////////////////////////////////////////////////


best=0
waw=barindex
tbest=100000
tbest2=100000
tbest3=100000


lo=lowest[10](close)
cl=close

if time=starttime then

sep2=sep
if time[(sep-4)]=starttime then
sep2=sep-4
elsif time[(sep-3)]=starttime then
sep2=sep-3
elsif time[(sep-2)]=starttime then
sep2=sep-2
elsif time[(sep-1)]=starttime then
sep2=sep-1
elsif time[(sep+1)]=starttime then
sep2=sep+1
elsif time[(sep+2)]=starttime then
sep2=sep+2
elsif time[(sep+3)]=starttime then
sep2=sep+3
elsif time[(sep+4)]=starttime then
sep2=sep+4
endif


waw=waw-sep2

FOR i = hindsight DOWNTO 0 DO

best=(0.01*(square((cl-lo)-(cl[barindex-waw]-lo[barindex-waw]))+square((cl[1]-lo)-(cl[barindex-waw+1]-lo[barindex-waw]))+square((cl[2]-lo)-(cl[barindex-waw+2]-lo[barindex-waw]))+square((cl[3]-lo)-(cl[barindex-waw+3]-lo[barindex-waw]))+square((cl[4]-lo)-(cl[barindex-waw+4]-lo[barindex-waw]))+square((cl[5]-lo)-(cl[barindex-waw+5]-lo[barindex-waw]))+square((cl[6]-lo)-(cl[barindex-waw+6]-lo[barindex-waw]))+square((cl[7]-lo)-(cl[barindex-waw+7]-lo[barindex-waw]))+square((cl[8]-lo)-(cl[barindex-waw+8]-lo[barindex-waw]))+square((cl[9]-lo)-(cl[barindex-waw+9]-lo[barindex-waw]))))

if best<tbest then
tbest=best
ind=cl[barindex-waw-fut]-cl[barindex-waw]
elsif best<tbest2 then
tbest2=best
ind2=cl[barindex-waw-fut]-cl[barindex-waw]
elsif best<tbest3 then
tbest3=best
ind3=cl[barindex-waw-fut]-cl[barindex-waw]
endif

sep2=sep

if time[barindex-(waw-(sep-4))]=starttime then
sep2=sep-4
elsif time[barindex-(waw-(sep-3))]=starttime then
sep2=sep-3
elsif time[barindex-(waw-(sep-2))]=starttime then
sep2=sep-2
elsif time[barindex-(waw-(sep-1))]=starttime then
sep2=sep-1
elsif time[barindex-(waw-(sep+1))]=starttime then
sep2=sep+1
elsif time[barindex-(waw-(sep+2))]=starttime then
sep2=sep+2
elsif time[barindex-(waw-(sep+3))]=starttime then
sep2=sep+3
elsif time[barindex-(waw-(sep+4))]=starttime then
sep2=sep+4
endif

waw=waw-sep2

if waw<200 then
i=0
endif

next

endif


goer1=0
goer2=0
goer3=0

goer1=(ind/square(tbest))
goer2=(ind2/square(tbest2))
goer3=(ind3/square(tbest3))

goerz=goer1+goer2+goer3


return goerz
That’s what I talked about yesterday when I was talking about interesting thread I have lost in the forums.. 🙂 I’m subscribing!
Arrays should have been useful here you are right, and I’m impressed by your work to fill the void of it.
Your approach is a kind of Goertzel algorithm? Find an already known frequency in a larger spectrum? Should be a great idea to comment a bit your indicator’s code, otherwise you’ll lost a lot of people..
Many statistical studies have concluded that the ORB (open range breakout), the direction of the price at the opening of the market is significant for 30% of the sample.
WingParticipant
Veteran
I’m glad you like it. It took some thinking to figure out a good approach.
I have not heard of the Geortzel algorithm previously, but since it is used in tone detection, it should be fairly similar.
I can’t edit the code post to add comments, so I will do it below:
////////////////////////////////////////////////////
//
// Wing's Prophecy Boot version 0.1 - (Pattern Matching indicator)
//
// Made by user "Wing" of ProRealCode.com
// https://www.prorealcode.com/user/wing/
//
//////////////////////////////////////////////////
//
// Parameters:

sep=92 // Number of bars between each pattern match. Should be equivalent to the amount of bars per day. Roughly 47 for 30m TF, 92 for 15m etc
starttime=090000 // What time each day to compare current pattern to previous days
fut= 16 // How many bars from best pattern match to look forward and see if pattern results in price increase/decrease. Must be less than 'sep'.
hindsight=95 // Number of days to look back. DO NOT CHANGE THIS PARAMETER unless you receive an error message. Generally, it can't look back more than 100 days.

//////////////////////////////////////////////////


best=0
waw=barindex
tbest=100000
tbest2=100000
tbest3=100000


lo=lowest[10](close) // Set a base line. Each sequence is compared by placing their lowest close on the same level.
cl=close

if time=starttime then

// correct the day separator, so the right time is compared. Some days can have 98 bars, others 96 bars etc.
sep2=sep
if time[(sep-4)]=starttime then
sep2=sep-4
elsif time[(sep-3)]=starttime then
sep2=sep-3
elsif time[(sep-2)]=starttime then
sep2=sep-2
elsif time[(sep-1)]=starttime then
sep2=sep-1
elsif time[(sep+1)]=starttime then
sep2=sep+1
elsif time[(sep+2)]=starttime then
sep2=sep+2
elsif time[(sep+3)]=starttime then
sep2=sep+3
elsif time[(sep+4)]=starttime then
sep2=sep+4
endif


waw=waw-sep2

// Check each day
FOR i = hindsight DOWNTO 0 DO

// compare each sequence to the current one, and create an accuracy score. The lower score the better
best=(0.01*(square((cl-lo)-(cl[barindex-waw]-lo[barindex-waw]))+square((cl[1]-lo)-(cl[barindex-waw+1]-lo[barindex-waw]))+square((cl[2]-lo)-(cl[barindex-waw+2]-lo[barindex-waw]))+square((cl[3]-lo)-(cl[barindex-waw+3]-lo[barindex-waw]))+square((cl[4]-lo)-(cl[barindex-waw+4]-lo[barindex-waw]))+square((cl[5]-lo)-(cl[barindex-waw+5]-lo[barindex-waw]))+square((cl[6]-lo)-(cl[barindex-waw+6]-lo[barindex-waw]))+square((cl[7]-lo)-(cl[barindex-waw+7]-lo[barindex-waw]))+square((cl[8]-lo)-(cl[barindex-waw+8]-lo[barindex-waw]))+square((cl[9]-lo)-(cl[barindex-waw+9]-lo[barindex-waw]))))

// save the three best matches
if best<tbest then
tbest=best
ind=cl[barindex-waw-fut]-cl[barindex-waw]
elsif best<tbest2 then
tbest2=best
ind2=cl[barindex-waw-fut]-cl[barindex-waw]
elsif best<tbest3 then
tbest3=best
ind3=cl[barindex-waw-fut]-cl[barindex-waw]
endif

sep2=sep

if time[barindex-(waw-(sep-4))]=starttime then
sep2=sep-4
elsif time[barindex-(waw-(sep-3))]=starttime then
sep2=sep-3
elsif time[barindex-(waw-(sep-2))]=starttime then
sep2=sep-2
elsif time[barindex-(waw-(sep-1))]=starttime then
sep2=sep-1
elsif time[barindex-(waw-(sep+1))]=starttime then
sep2=sep+1
elsif time[barindex-(waw-(sep+2))]=starttime then
sep2=sep+2
elsif time[barindex-(waw-(sep+3))]=starttime then
sep2=sep+3
elsif time[barindex-(waw-(sep+4))]=starttime then
sep2=sep+4
endif

waw=waw-sep2

if waw<200 then
i=0
endif

next

endif


goer1=0
goer2=0
goer3=0

// the three best matches. the price change is divided by the preceding sequence's similarity to current sequence. A low similarity score means more similarity, which results in a stronger signal.
goer1=(ind/square(tbest))
goer2=(ind2/square(tbest2))
goer3=(ind3/square(tbest3))

// add the three best matches together, for a better prediction
goerz=goer1+goer2+goer3


return goerz
WingParticipant
Veteran
I will also add that there is the possibility to create a REVERSE pattern matcher. I have that code somewhere, and I might post it later if I find it.
A reverse pattern matcher creates composite images of all patterns that preceded event A. For example, event A could be price moving over 1 % upwards within a span of 10 hours. The average of all preceding price movements to event A can then be compared to the current price movement and maybe predict when new such events will occur.
This approach is much less taxing on the PRT servers, and therefore let’s you take more data into account, compared to the code posted above. However, it is less versatile and accurate.
I changed the bars comparison sequence with a loop to have more bars than 10:
// compare each sequence to the current one, and create an accuracy score. The lower score the better
//best=(0.01*(square((cl-lo)-(cl[barindex-waw]-lo[barindex-waw]))+square((cl[1]-lo)-(cl[barindex-waw+1]-lo[barindex-waw]))+square((cl[2]-lo)-(cl[barindex-waw+2]-lo[barindex-waw]))+square((cl[3]-lo)-(cl[barindex-waw+3]-lo[barindex-waw]))+square((cl[4]-lo)-(cl[barindex-waw+4]-lo[barindex-waw]))+square((cl[5]-lo)-(cl[barindex-waw+5]-lo[barindex-waw]))+square((cl[6]-lo)-(cl[barindex-waw+6]-lo[barindex-waw]))+square((cl[7]-lo)-(cl[barindex-waw+7]-lo[barindex-waw]))+square((cl[8]-lo)-(cl[barindex-waw+8]-lo[barindex-waw]))+square((cl[9]-lo)-(cl[barindex-waw+9]-lo[barindex-waw]))))
barstocompare=11
result=0
for a = 0 to barstocompare do
result = result+square((cl[a]-lo)-(cl[barindex-waw+a]-lo[barindex-waw]))
next
best = 0.01*result
I fell into the infinite loop bug of the platform if I set “barstocompare” to 20, only tested 11, currently testing more bars. Is it still accurate for you? Maybe adding this code into an external indicator as a function would reduce the phenomena.
edit: 15 bars is workings ok.
WingParticipant
Veteran
Nice loop. My goal is of course to increase the amount of bars per sequence, and days checked.
I have no idea what the maximum bars are, but the more the merrier. The maximum iterations limit counts everything called in the program I believe.
And yes, adding things as external indicators and calling them in an indicator or system sometimes helps.
So in your own development, you were trying to compare pre-open price behaviour to predict the whole daily movement or only for a short period of time?
Did you try to compare the London session instead to predict price direction of the NY one?
WingParticipant
Veteran
My system where I have tried this indicator, I check price change for the whole daily movement. From open to close. Optimal prediction depends on the length of sequence, time of day, market, timeframe etc.
You do have a point with your example of London and NY. Pre-open movements are less reliable. It is something I have to look into.
WingParticipant
Veteran
So far I am unsure if pattern matching works. On the 15/30m timeframe I can create an edge in DAX. But the system has many moving parts (variables) that make biases and over-optimization a risk. It seems it works best on indices though. My next move will be to investigate if it can perform in equities and maybe on new timeframes.
WingParticipant
Veteran
I have abandoned the approach of price pattern matching, since I couldn’t produce any compelling strategies. An edge exists, but not enough to cover spreads and drawdowns. I am however experimenting with indicator movement matching. For example, the movement pattern of an momemtum indicator compared to previous days, combined with also pattern-matching movement patterns for trend indicators etc. This is an attempt to find a similar price movement, but not by comparing price, but by taking other perspectives into account (different indicator types and periods, etc). This approach could be even more complex than the previous one and therefore less reliable and understandable, but I will post more if it turns out to be good.
Your code is an interesting approach and be sure I can help if you need assistance on any project related to pattern matching.
You are right about the existence of an edge somewhere in pattern matching, but reducing it only to candlesticks patterns is almost like trading market noises IMO. I’d like to train an algorithm to find every combination of short term market’s “pause”, sounds tricky though..
 Maz
MazParticipant
Veteran
This topic is my bag…. Can we discuss offline?
Good job for getting this far with top-down code without arrays @Wing, I am impressed. So just some background – we have systems using multi layer SOMs, running in OpenCL on some very custom hardware. With arrays in PRT this could also be attempted there. The top-down structure is not really adept for this kind of work – you need parallel processing to harness the power of it. But seriously good work. Would like to get in touch.
Thank you Wing for your outstanding work, I have been wandering wheter machine learning algos could be used on PRT, I’ll do my best to help on this
WingParticipant
Veteran
I have a system based on another form of machine learning I can maybe show if you contact me. I have planned to post it publicly but have not had time to do so yet.