qui pourrait transcrire ce programme de détection des FVG de Tradingview? merci d’avance.
//@version=5
indicator(“Fair Value Gap (FVG)”, overlay=true)
// Paramètres
fvgLookback = input.int(1, title=”Lookback (bougie avant et après)”, minval=1)
// Données des bougies
prevHigh = high[fvgLookback]
prevLow = low[fvgLookback]
nextHigh = high[-fvgLookback]
nextLow = low[-fvgLookback]
// Calcul du FVG
bullishFVG = low > prevHigh
bearishFVG = high < prevLow
// Affichage des FVGs
if bullishFVG
box.new(bar_index – fvgLookback, prevHigh, bar_index + fvgLookback, low, border_color=color.green, bgcolor=color.new(color.green, 85))
if bearishFVG
box.ew(bar_index – fvgLookback, high, bar_index + fvgLookback, prevLow, border_color=color.red, bgcolor=color.new(color.red, 85))
pas testé
//@version=5
//indicator(“Fair Value Gap (FVG)”, overlay=true)

// Paramètres
fvgLookback = 1

// Données des bougies
prevHigh = high[fvgLookback]
prevLow = low[fvgLookback]
nextHigh = high[-fvgLookback]
nextLow = low[-fvgLookback]

// Calcul du FVG
bullishFVG = low > prevHigh
bearishFVG = high < prevLow

// Affichage des FVGs
if bullishFVG then
DRAWRECTANGLE(barindex – fvgLookback,prevHigh,barindex+ fvgLookback, low) COLOURED("green")
endif

if bearishFVG then

DRAWRECTANGLE(barindex – fvgLookback,high,barindex+ fvgLookback, prevLow) COLOURED("red")
endif
return
Merci bien mais en effet les FVG ne s’affichent pas
en fait ce programme affiche les gaps mais pas les FVG
 JS
JSParticipant
Veteran
//@version=5
//indicator("Fair Value Gap (FVG)", overlay=true)

// Parameters
fvgLookback = 1//input.int(1, title="Lookback (candle before and after)", minval=1)

// Données des bougies
prevHigh = high[fvgLookback]
prevLow = low[fvgLookback]
nextHigh = high[0]
nextLow = low[0]

// Calcul du FVG
bullishFVG = low > prevHigh
bearishFVG = high < prevLow

// Affichage des FVGs
If bullishFVG then
DrawRectangle((BarIndex-fvgLookback),prevHigh,BarIndex,low)Coloured("Green",255)FillColor(0,50,0)
EndIf

If bearishFVG then
DrawRectangle(BarIndex,High,(BarIndex-fvgLookback),prevLow)Coloured("Red",255)FillColor(50,0,0)
EndIf

Return
JSParticipant
Veteran
fvgLookback=2
//@version=5
//indicator("Fair Value Gap (FVG)", overlay=true)

// Parameters
fvgLookback = 2//input.int(1, title="Lookback (candle before and after)", minval=1)

// Données des bougies
prevHigh = high[fvgLookback]
prevLow = low[fvgLookback]
nextHigh = high[0]
nextLow = low[0]

// Calcul du FVG
bullishFVG = low > prevHigh
bearishFVG = high < prevLow

// Affichage des FVGs
If bullishFVG then
DrawRectangle((BarIndex-fvgLookback),prevHigh,BarIndex,low)Coloured("Green",255)FillColor(0,50,0)
EndIf

If bearishFVG then
DrawRectangle(BarIndex,High,(BarIndex-fvgLookback),prevLow)Coloured("Red",255)FillColor(50,0,0)
EndIf

Return
Jai demandé à chatgpt de programmer un FVG mais il affiche une erreur
// Indicateur Fair Value Gap (FVG) pour ProRealTime
// Détection des zones de déséquilibre haussier et baissier
// Paramètres configurables
DEFPARAM CumulateOrders = False // Ne pas cumuler les ordres pour éviter les conflits
RangeThreshold = 0.001 // Seuil minimum pour la taille du gap (ajustable selon l’instrument)
ExtendBars = 100 // Nombre de barres pour étendre les rectangles à droite
// Variables pour stocker les niveaux du FVG
fvgUpTop = 0
fvgUpBottom = 0
fvgDownTop = 0
fvgDownBottom = 0
// Conditions pour un FVG haussier
// Un FVG haussier se forme quand le bas de la bougie actuelle est supérieur au haut de la bougie d’il y a deux barres
IF Low > High[2] THEN
fvgUpTop = Low // Haut du FVG haussier
fvgUpBottom = High[2] // Bas du FVG haussier
// Vérifier si la taille du gap est significative
IF (fvgUpTop – fvgUpBottom) / fvgUpBottom > RangeThreshold THEN
// Dessiner un rectangle pour le FVG haussier
DRAWRECTANGLE(fvgUpBottom, BarIndex, fvgUpTop, BarIndex + ExtendBars) COLOURED(0, 255, 0, 20) BORDERCOLOUR(0, 255, 0)
ENDIF
ENDIF
// Conditions pour un FVG baissier
// Un FVG baissier se forme quand le haut de la bougie actuelle est inférieur au bas de la bougie d’il y a deux barres
IF High < Low[2] THEN
fvgDownTop = Low[2] // Haut du FVG baissier
fvgDownBottom = High // Bas du FVG baissier
// Vérifier si la taille du gap est significative
IF (fvgDownTop – fvgDownBottom) / fvgDownTop > RangeThreshold THEN
// Dessiner un rectangle pour le FVG baissier
DRAWRECTANGLE(fvgDownBottom, BarIndex, fvgDownTop, BarIndex + ExtendBars) COLOURED(255, 0, 0, 20) BORDERCOLOUR(255, 0, 0)
ENDIF
ENDIF
// Retourner 0 pour éviter les erreurs
RETURN 0
JS est ce possible de rajouter un trait à 50% du FVG?
JSParticipant
Veteran
Dans la première ou la deuxième version ?
Une ligne horizontale dans la « Box » ou une ligne qui continue vers « Gauche et/ou Droite » ?
JSParticipant
Veteran
//@version=5
//indicator("Fair Value Gap (FVG)", overlay=true)

// Parameters
fvgLookback = 2//input.int(1, title="Lookback (candle before and after)", minval=1)

// Données des bougies
prevHigh = high[fvgLookback]
prevLow = low[fvgLookback]
nextHigh = high[0]
nextLow = low[0]

// Calcul du FVG
bullishFVG = low > prevHigh
bearishFVG = high < prevLow

// Affichage des FVGs
If bullishFVG then
DrawRectangle((BarIndex-fvgLookback),prevHigh,BarIndex,low)Coloured("Green",255)FillColor(0,50,0)
Median=prevHigh+(Low-prevHigh)/2
DrawSegment(BarIndex-fvgLookback,Median,BarIndex,Median)Coloured("Green")
EndIf

If bearishFVG then
DrawRectangle(BarIndex,High,(BarIndex-fvgLookback),prevLow)Coloured("Red",255)FillColor(50,0,0)
Median=High+(prevLow-High)/2
DrawSegment(BarIndex-fvgLookback,Median,BarIndex,Median)Coloured("Red")
EndIf

Return
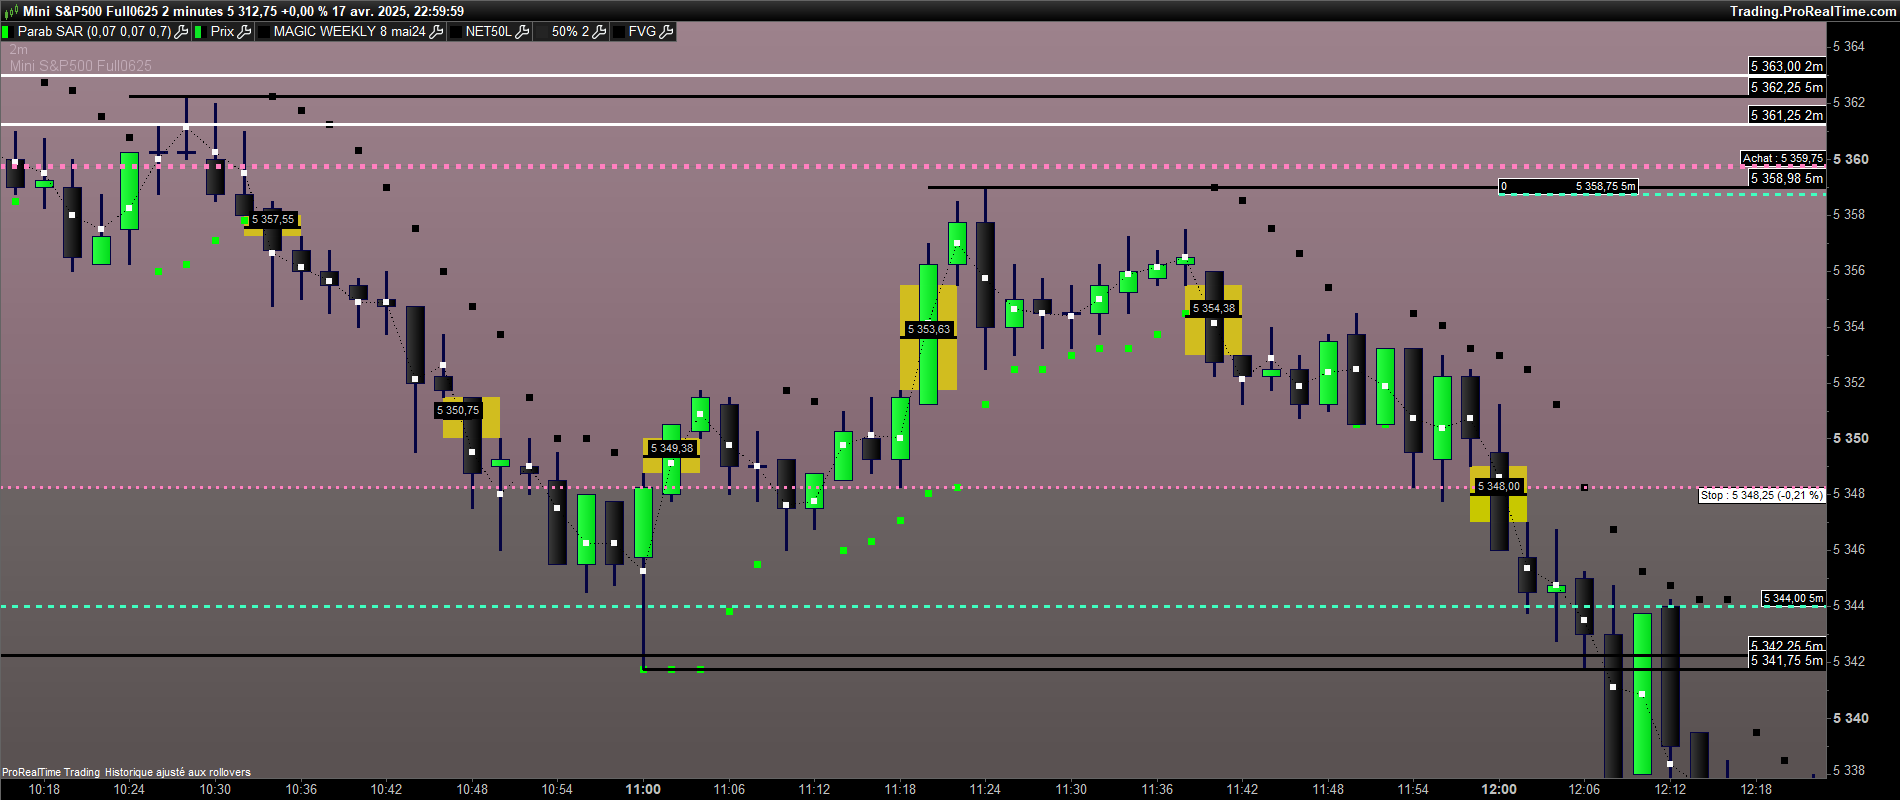
un trait avec le niveau de prix comme sur le chart ci joint , ça serait fantastique
JSParticipant
Veteran
//@version=5
//indicator("Fair Value Gap (FVG)", overlay=true)

// Parameters
fvgLookback = 2//input.int(1, title="Lookback (candle before and after)", minval=1)

// Données des bougies
prevHigh = high[fvgLookback]
prevLow = low[fvgLookback]
nextHigh = high[0]
nextLow = low[0]

// Calcul du FVG
bullishFVG = low > prevHigh
bearishFVG = high < prevLow

// Affichage des FVGs
If bullishFVG then
DrawRectangle((BarIndex-fvgLookback),prevHigh,BarIndex,low)Coloured("Green",255)FillColor(0,50,0)
Median=prevHigh+(Low-prevHigh)/2
DrawSegment(BarIndex-fvgLookback,Median,BarIndex,Median)Coloured("Green")
DrawText("#Median#",BarIndex-1,Median)
EndIf

If bearishFVG then
DrawRectangle(BarIndex,High,(BarIndex-fvgLookback),prevLow)Coloured("Red",255)FillColor(50,0,0)
Median=High+(prevLow-High)/2
DrawSegment(BarIndex-fvgLookback,Median,BarIndex,Median)Coloured("Red")
DrawText("#Median#",BarIndex-1,Median)
EndIf

Return
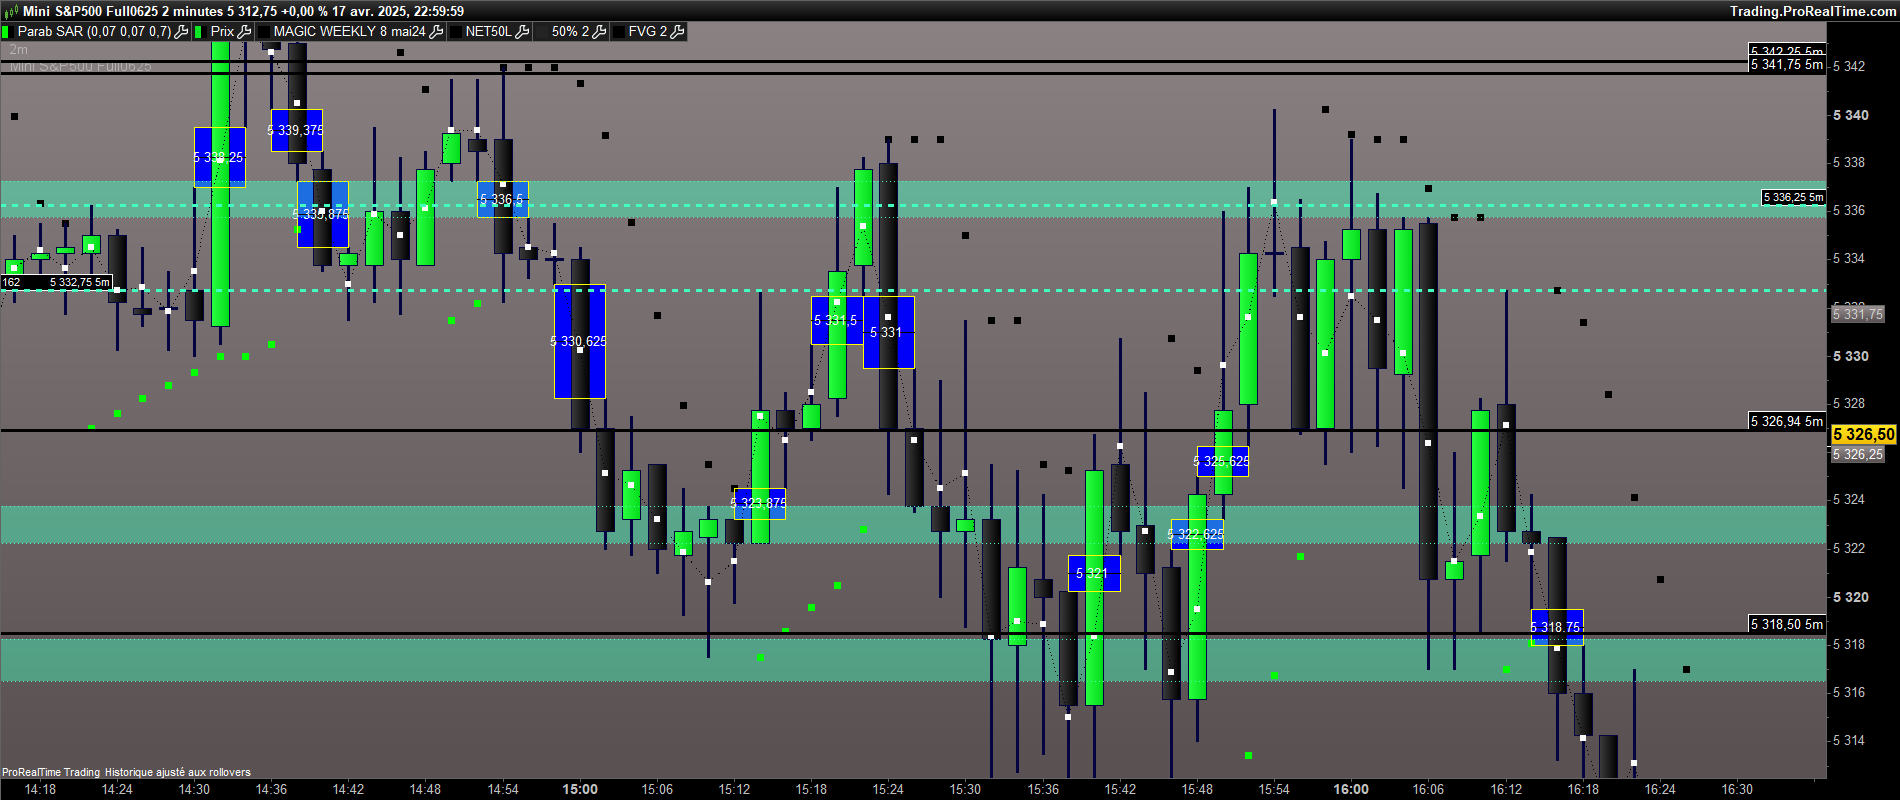
super merci, j ai mis les FVG en bleu pour bien voir le texte “median”. est ce possible de le mettre en “bold” pour que ce niveau de prix soit bien visible?
JSParticipant
Veteran
//@version=5
//indicator("Fair Value Gap (FVG)", overlay=true)

// Parameters
fvgLookback = 2//input.int(1, title="Lookback (candle before and after)", minval=1)

// Données des bougies
prevHigh = high[fvgLookback]
prevLow = low[fvgLookback]
nextHigh = high[0]
nextLow = low[0]

// Calcul du FVG
bullishFVG = low > prevHigh
bearishFVG = high < prevLow

// Affichage des FVGs
If bullishFVG then
DrawRectangle((BarIndex-fvgLookback),prevHigh,BarIndex,low)Coloured("Green",255)FillColor(0,50,0)
Median=prevHigh+(Low-prevHigh)/2
DrawSegment(BarIndex-fvgLookback,Median,BarIndex,Median)Coloured("Green")
DrawText("#Median#",BarIndex-1,Median,SansSerif,Bold,16)
EndIf

If bearishFVG then
DrawRectangle(BarIndex,High,(BarIndex-fvgLookback),prevLow)Coloured("Red",255)FillColor(50,0,0)
Median=High+(prevLow-High)/2
DrawSegment(BarIndex-fvgLookback,Median,BarIndex,Median)Coloured("Red")
DrawText("#Median#",BarIndex-1,Median,SansSerif,Bold,16)
EndIf

Return