I have just started to learn Pro Real code and unfamiliar with lots of stuff. All I am trying to do at this stage is automate order placement. I prefer stop orders rather than market order. I have managed to put together the code but I have few things that I am not sure about.
- i want a buy stop order at 1 Bar high – the code i have probably does the job but my question is what if the previous bar closed lower than current price. Brokers need the stop orders to be certain distance from the market price (for example AUDNZD need quite a large distance for stop orders). What do i do to get around this?
- The below code has money management section, I have the STOP LOSS level set at low of the recent few bars. I want the position size to be calculated based on this STOP LOSS Size. If the low of the previous bar is 10 pips, the i want the position size to be based on this risk. And if it is 15 pips, it will give smaller position size. I have used StopLoss = Close – LL . Here I am assuming that we are calculating pips by getting the difference in close price and the stop level LL. But i think there is some problem with this as the resulting position size i am getting does not look accurate. To be clearer – if my max risk amount is $50, I want to buy as much quantity as I can while i place the stop at LL as long as the risk is still $50. Because the stop level for each trade will be different – some large and some small allowing different quantities to be ordered, how can i make the code work.
- Would it be possible to trail the stop level to the low of each stochastic swing? Trailing done after the recent high is taken out following stochastic bullish reversal. After trailing it for 2 stochastic swings, then trail the stop to 1 Bar Low position. Please note that the code below is for Long entry only.
// Definition of code parameters
DEFPARAM CumulateOrders = False // Cumulating positions deactivated

// Conditions to enter long positions
timeframe(Daily)
indicator1 = Stochastic[5,3](close)
indicator2 = Average[3](indicator1)
indicator0 = Average[3](Stochastic[5,3](close))
c1 = (indicator1 > indicator2)
c0 = (indicator0 < 50)

timeframe(1 hour, updateonclose)
indicator3 = Stochastic[5,3](close)
indicator4 = Average[3](indicator3)
c2 = (indicator3[3] > indicator4)
indicator5 = Average[3](Stochastic[5,3](close))
c3 = (indicator5 > 25)
indicator6 = Average[3](Stochastic[5,3](close))
c4 = (indicator6 < 60)
LL = lowest[6](low)-pipsize
BARHIGH = High [1] + pipsize*3

REM Money Management
Capital = 5000
Risk = 0.01
StopLoss = Close - LL // Could be our variable X

REM Calculate contracts
equity = Capital + StrategyProfit
maxrisk = round(equity*Risk)
PositionSize = abs(round((maxrisk/StopLoss)/PointValue)*pipsize)

IF c0 AND c1 AND c2 AND c3 AND c4 THEN
Buy Positionsize CONTRACT AT BARHIGH STOP
Set Stop loss LL
Set target profit averagetruerange[14]*20
ENDIF
s00071609 – please follow the forum rules and always use the ‘Insert PRT Code’ button when posting code to make it easier for others to read. I have tidied up your post for you. 🙂
To abide by the distance requirements you can calculate your entry price as:
BARHIGH = max(High [1] + pipsize*3,close + distance)
you’ll replace DISTANCE with a variable of your choice or a constant in pips, such as 10*pipsize.
As for entry price, also SL requires to be no less than X, I think 5 pips is to small as SL.
It’s quite difficult to trail such small quantities with code, since having a 10-pip SL and start trailing at a 5-pip profit would keep a 5-pip SL which is too close to price!
I suggest using native SET STOP PTRAILING 10 (or whatever else you need, provided it’s not too small). This will grant you a 1 pip trailing.
LL = lowest[6](low)-pipsize
Hi Robert and Vonasi
thanks for suggestions regarding the entry and the pip. I am fine with entry as suggested.
I was just giving an example about pip and i don’t use fixed SL size, but use the low of recent candles in hourly TF.
Is the above code for STOP LOSS LL correct? When i graph it into the chart, it shows graph line at correct value just below the lowest candle, however I am doubtful that it is working correctly as its giving too high win rate – i think the stop is being ignored. I want the stop to be under the low of 5-6 candles.
Also the position size seems to be working correctly in some stocks but not in Forex, so i am not sure where i have got it wrong?
Any help would be great.
Thanks
No, pipsize has no value by itself, it’s just a converter.
Number * pipsize returns a (difference in) price.
Price / pipsize returns (a difference in) pips
You cannot set a SL to a price, but to a difference in price instead.
LL = lowest[6](low)
SL = close - LL
you can then use either:
set stop Ploss SL * pipsize
set stop  loss  SL
LL = lowest[6](low)
SL = close - LL
BARHIGH = max(High [1] + pipsize*3,close + 10*pipsize)

REM Money Management
Capital = 5000
Risk = 0.01
//Stoploss = 5
StopLoss = abs((BARHIGH - SL)/pointsize) // Could be our variable X

REM Calculate contracts
equity = Capital + StrategyProfit
maxrisk = round(equity*Risk)
PositionSize = abs(((maxrisk/StopLoss)/PointValue)*pipsize)


IF c0 AND c1 AND c2 AND c3 AND c4 THEN
Buy Positionsize CONTRACT AT BARHIGH STOP
set stop Ploss SL * pipsize
Set target profit SL*3
ENDIF
GRAPHONPRICE SL coloured(0,200,0) as "Stop"
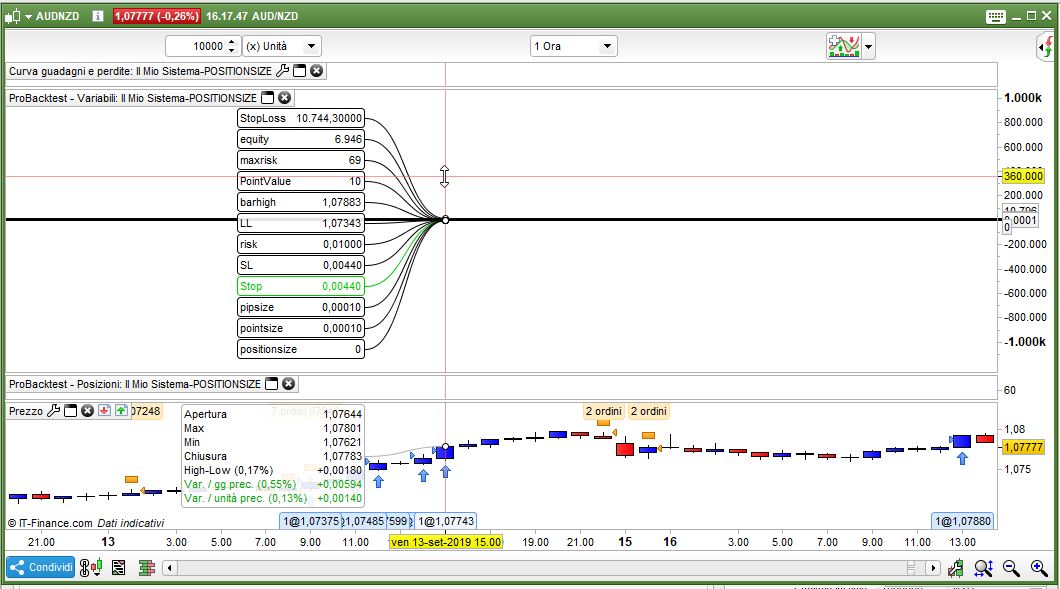
Great thanks for your help. It appears to be working correctly.
I am stuck with the position size calculation which seem to change with different instrument.
With the above capital, loss should be around $50 but its giving loss of around $6 in forex. Is my code StopLoss (used in PositionSize calculation) correct? The idea was to get the value for maxrisk/StopLoss in the position calculation code above. Could i have just used Maxrisk/SL instead and remove the StopLoss?
I was trying to graph the SL level in the price chart to see what its doing, is there a way to plot the SL level in chart. Above graph on price does not plot anything.
Thanks
I can’t test your calculations until tomorrow.
As for GRAPHONPRICE, it plots your SL where it is.
If your SL 20, then it will be plotted at level 20, if it is 0.0020 it will be plotted at 0.0020, either use GRAPH or shrink the chart scale.
No problem, i will wait until tomorrow. A quick test would be great as this is my first code, I might be overlooking some big mistakes.
Graph does plot it as you have said and shows 0.0040 etc which seem to match with distance from low to close of entry bar – this looks fine
You should replace *PIPSIZE with /PIPSIZE at line 14, then rounding it:
PositionSize = round(abs(((maxrisk/StopLoss)/PointValue)/pipsize))
Adding these lines could also help you a lot:
GRAPH SL coloured(0,200,0) as "Stop"
GRAPH equity
graph risk
graph maxrisk
graph StopLoss
graph PointValue
graph pipsize
graph barhigh
graph positionsize
graph LL
graph SL
graph pointsize
Thanks for that. I changed the code for positionsize now the loss is way over the required amount. I tested in GBP CAD Mini. A single losing trade has CAD 284 loss. I suspect the linked code to Positionsize calculation is not right and I am unable to figure out where the bug is.
I believe that no trade should exceed a loss of $50 as per the 0.1% risk. I excluded the Running Profit, even then size is incorrect.
Buy the way i got the code snippet for Position size from https://www.prorealcode.com/blog/learning/money-management-prorealtime-code/
Exact code was used above ie. *Pipsize. I changed it as suggested but its still not giving right quantity.
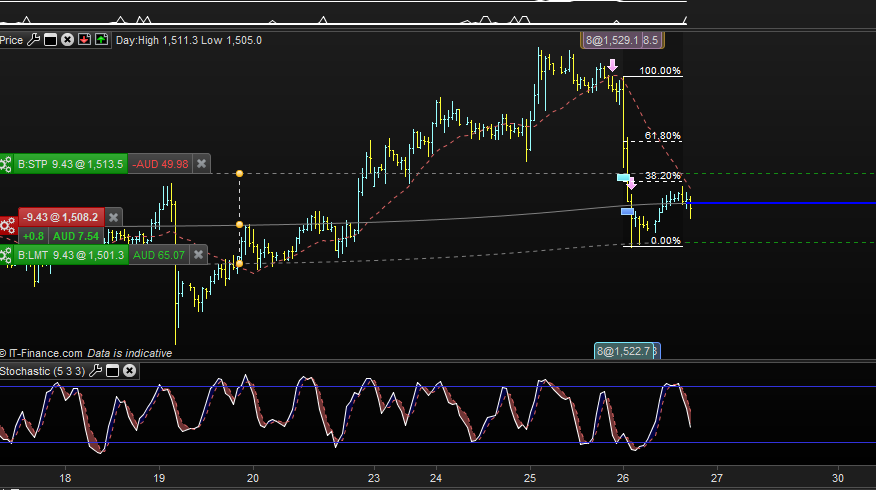
I am totally Lost with STOP LOSS Calculation,
SL = abs(((Low - highest[5](high))/Pointsize)-2*Pointsize)
set stop Loss SL
I did a forward test on this code and it put the stop for Short Order in right place. But when i check in forums, it says with STOP LOSS code, it should be like Close – Someprice and not like above.
Is the syntax above correct? The below screenshot is GOLD. Is it working only because point and price difference are same for this instrument?
Getting so confused.
Use extensively GRAPH to monitor all variables you need to, in your case you should add:
GRAPH Low
GRAPH highest[5](high)
GRAPH Pointsize
GRAPH SL
GRAPH Low - highest[5](high)
GRAPH (Low - highest[5](high))/Pointsize
this might help you a lot.
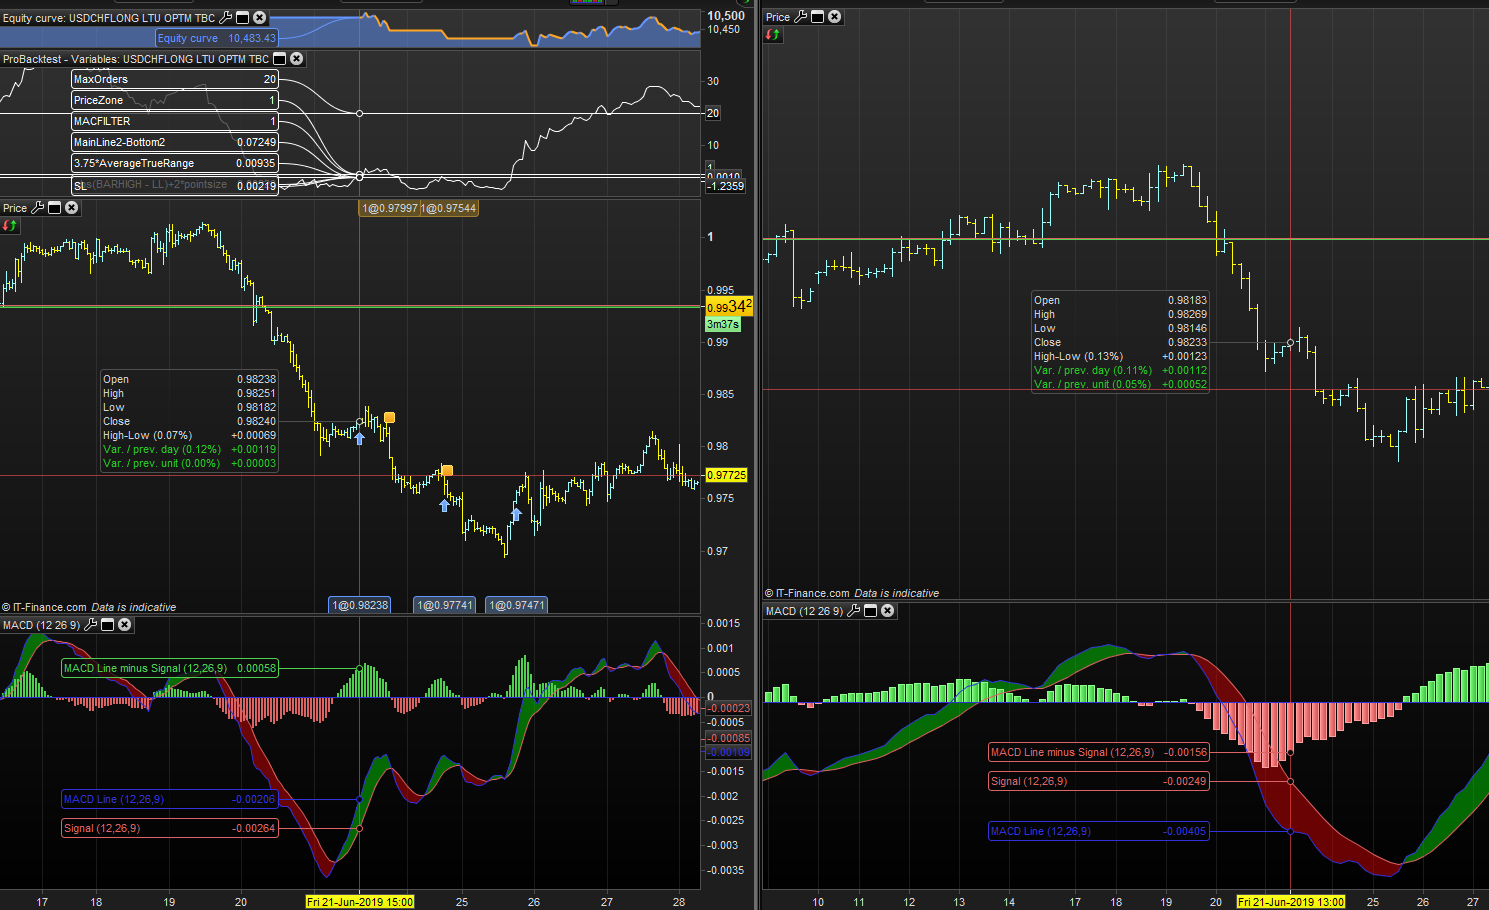
With the graph function. I am unable to understand why these orders are placed. I am testing MACD so i can use it to cut bad trades that should not have been entered. Its a very simple rule, if MACD is bearish in 4 Hour TF, do not enter Long. Entry timeframe is 1 hour. I am testing this code using graph, and in these sections, 4 hour MACD is clearly bearish and I am using close with MACD. MACFILTER is showing as 1 which means condition is true, it should have been 0 for false. I is working in other sections, not here,
Timeframe (4 Hour)
MACDD = MACD[12,26,9](close)
SIGNALD = ExponentialAverage[9](MACDline[12,26,9](close))
MACFILTER= MACDD>SIGNALD //DO NOt enter if MACD is bearish
Please see the image for illustration,
Because you compare the MACD Close value with its own value that change over time during a 4-hours bar!
If you want to use the Close value of the MACD during its bar, you should add this to the timeframe instruction:
Timeframe (4 Hour,updateonclose)