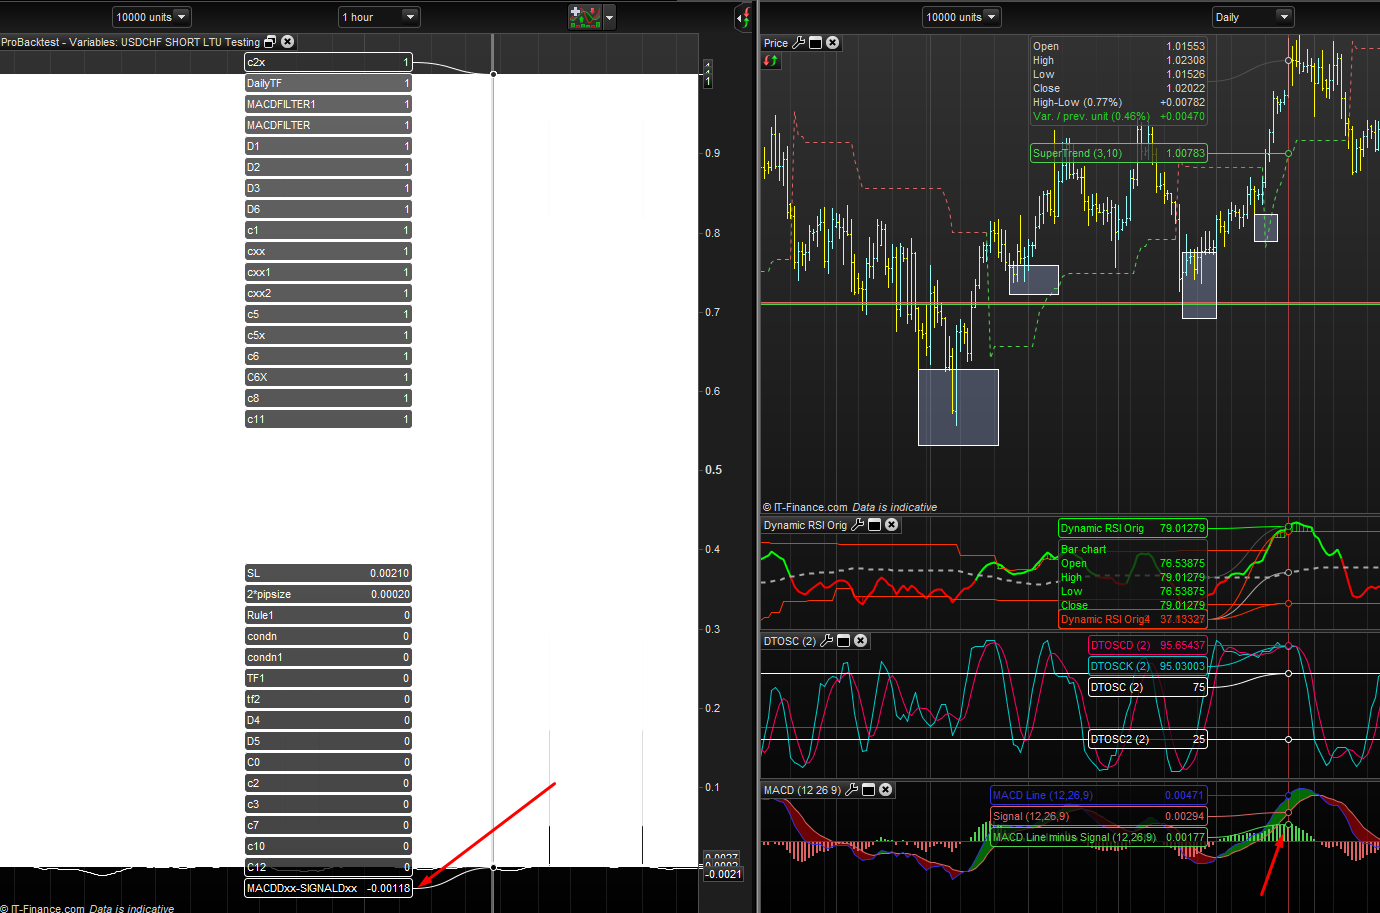
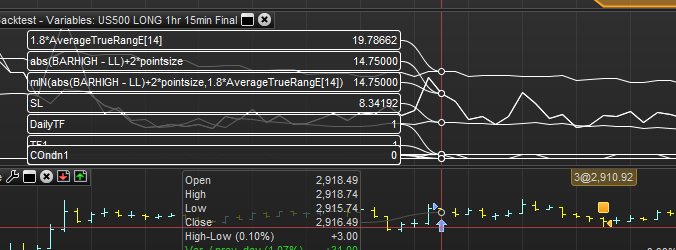
ok thanks i will check that out. In process of checking orders being executed at spots it should not. I have another question, these are the MACD codes used for Daily and 4Hour TF and I have graphed them,
I have attached an image that shows, MACDDxxx-SIGNALDxxx as negative (which tells why the order was accepted), but shouldn’t it have been positive, ie >0. MACD line is above signal line and it is a bullish setup for daily TF.
I am using updateonclose for both time frames. Is there something I am missing out?
I get correct value of 14.75, but when I graph SL, i get 8.34 which makes no sense, the 1.8 ATR value is 19.7. As per the formula above, the SL value should be 14.75. I have attached an image to clarify.
I checked to see if there is SL value elsewhere but there is no other source I can see. Where I am getting this wrong?
I finally figured it out, I had the graph codes at the bottom and those were under different time frame, so the values it gave and the spot where the SL calculation took place were different time frames and showed different values for variables such as ATR.
So looks fine now although it gave such a headache. Thank you