Not sure if this is the right place to post this, and may have been discussed before, but I have 2 thoughts:
Would it be poss to avoid curve-fitting by regularly re-optimizing, say the beginning of each month? Wouldn’t that more or less guarantee that your code was always in tune with current market behaviour? Might it even make more sense to always choose the best fit for the curve you’re in, rather than a compromise that fits any? If that were the case, then maybe it’s better to backtest for shorter periods rather than longer?
Secondly, if v11 offers backtesting to 1,000,000 bars – +20 years on a 15m chart – surely that would include every conceivable kind of bear, bull and range-bound sideways market. Does that effectively end all discussion of curve-fitting? If not, how far back would you have to go? 1929?
Personally I think that regular optimising just keeps you in tune with what just happened but there is no way to know that tomorrow the markets will behave exactly the same as they did last month. You could just find yourself always one month behind the ideal curve fit and always wrong! Others who do regularly re-optimise might disagree with these thoughts.
More data is always a good thing but then no two market crashes have ever been the same so what fits historical crashes probably wont work the same in tomorrows market crash. We also have to consider that due to the invention of the computer trading and market character is very different after the mid 90’s than before that time. Before the invention of the computer trading was done by only a few and they used a pencil and paper to draw their own candlesticks and a to calculate their own indicators. Most investors were long term buy and hold value investors but after the computer became a usable trading tool all sorts of trading styles and analysis could be used and high frequency trading became a possibility. The markets changed and are changing every day as technology continues. There has also been other interventions such as market controls to stop shorting in crashes which is another reason why future crashes will not be the same as past crashes. Then we have to throw in news and politics and world changing events that effect market behaviour – there was no Brexit in 1941 but there was another different market changing event! Do we optimise our strategy to cope with a world war or a stupid referendum?
If a strategy works from the mid 90’s onward and avoids massive draw down in any crashes then as long as it was not curve fitted to avoid those crashes it should cope in the future. For example having a fuse stop loss of say 10% means that the most you could ever lose in a crash is 10%. However a strategy that catches a falling knife and keeps buying into a crash and only sells if in profit could actually return a brilliant equity curve if it just got lucky and bought on the right candles. Buying just one candle later or just starting the strategy on a different day and the same idea could find you buying at the top of a crash and continuing to buy all the way to the bottom (or until your bank runs out!)
Might it even make more sense to always choose the best fit for the curve you’re in, rather than a compromise that fits any?
I have done this as a trial on several Systems and they do seem to whoosh away into good profits quicker than Systems optimised over 100k+ bars.
BUT above is conjencture because I cannot point to / provide a full set of results for the same System on Forward Test (FT) after optimising over 10K bars and another version (same System) over 100K bars.
I have done FT on 2 Versions (10K and 100K opti) and it has left me with the impression stated in my first paragraph.
We would need to ensure we re-optimise at the 10K bars point until 100K bars have passed and then compare results of the 2 Versions (10K and 100K opti).
If we did …
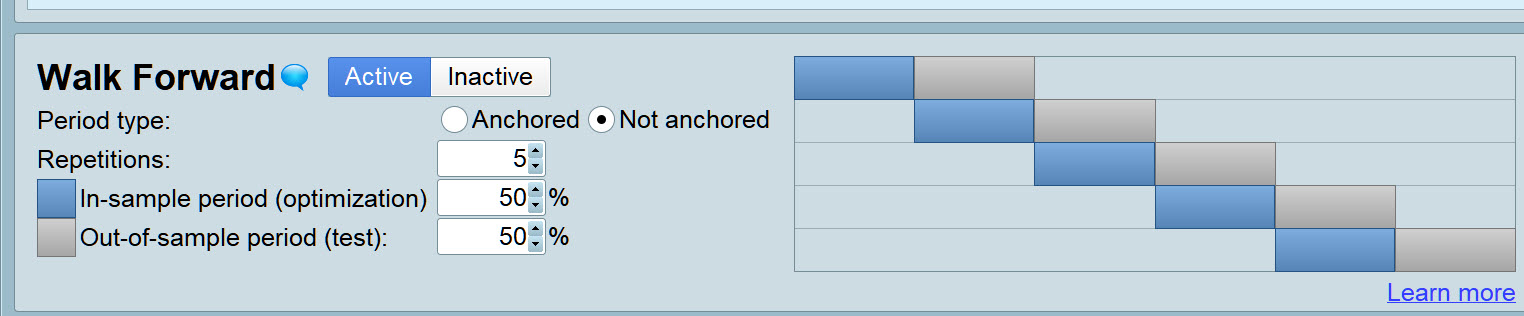
- System 1: Walk Forward over 10K bars Not-Anchored over 5 stage using all variables.
- System 2: BackTest over 50K bars of OOS data (50K bars not optimised over).
Above should give us a good idea as to how short term opti (10K bars) compares to long term opti (50k bars in this case).
If somebody who has access to 200k bars and 10 stages (?) did above (System 1: WF over 10K bars, System 2: Backtest over 100K bars OOS) then this may be a better study?
I may have a go later and report back.
thanked this post
Many thanks to you both for your input – I find the statistical theory behind all this as interesting as the code itself.
We would need to ensure we re-optimise at the 10K bars point until 100K bars have passed and then compare results of the 2 Versions (10K and 100K opti).
I was thinking something the same, Forward Testing but starting in the past: eg optimize Q1 of 2018 then run it over Q2; optimize Q2 and run it over Q3 etc.
Or is that more or less what you would get with your System 1: Walk Forward over 10K bars Not-Anchored ?
Or is that more or less what you would get with your System 1: Walk Forward over 10K bars Not-Anchored ?
Yes, but over 50 k bars not anchored over 5 stages so that would be 10 k bars each stage.
Above would simulate what we would do going forward if we had the System on Live trading … we would re-optimise every 10K bars and then set the System going for the next 10K bars OOS (Out of Sample).
System 2: BackTest over 50K bars of OOS data (50K bars not optimised over).
System 2 can be Walk Forward also so 100K bars over 1 stage so that gives 50K bars IS and 50K bars OOS.
The result of System 2 for the 50K bars OOS can then be compared with results for the same 50K bars for System 1 (which will be the 50K most recent bars).
Surprised nobody has done this before … seems so obvious??
Are we missing something?? You have a go Nonetheless and I will also.
Please Note:
System 1 and System 2 are the same System, i.e System 2 is a Duplicate of System 1.
Apologies for confusing terminology on my part.
I’m a bit confused by what you have discussed. WF breaks the data down into segments and then optimises part of that segment to find the best working variable values. It then uses those values on an out of sample part of the data so that we can see how it would have worked walking forward. Overall results are those OOS tests added together compared to the IS.
To simulate this you have to choose some recent history (a day, a month, a year, a decade? We are already curve fitting!) and optimise it to see what values worked best and then trade those values until you next feel like optimising. So to simulate this in a back test you would need to for example optimise based on December 1995’s data and then see how those values performed in January 1996 and record those results. Then re-optimise on just January 1996 data and use those values in February and record those results. Then re-optimise on February’s data and use that in March and so on and so on. An alternative is to optimise on all of history up till end of December 1995 and then use those values in January 1996 and then at the end of January re-optimise using all data up to the end of January 1996 and use those values in February.
I once coded a strategies that did both of these things and in back testing they worked great but in forward testing they failed terribly as it seems that the most important thing is the robustness of the strategy itself rather than having a strategy that you throw a broad range of variable values at time after time and keep your fingers crossed that they work as well this month as they did last month. I called my strategies ‘self optimising’ and Leo wrote something similar with his Neural Network concept. I gave up on the concept after spending a lot of time and effort on it. It was not a total waste of time as it confirmed to me that re-optimising is not the holy grail – it is just a way of proving whether last months curve fit still works this month!
I’m a bit confused by what you have discussed
Do you see WF as shown on attached (over 50K bars) any different than Live Forward Test and re-optimising every 10K bars and totalling profit / loss of all the 5 x 10K Live test periods?
If Yes, in what way do you see it as different?
Yes that would be exactly how re-optimising would work. However those are rather fixed segments of IS data so I would also consider moving the IS periods to different segments and seeing what the results are. You wouldn’t be able to do this using the WF tool so would need to do it manually by changing the dates in a backtest. Rather time consuming but would be a good way to check the robustness of the re-optimising theory.
moving the IS periods to different segments and seeing what the results are.
As a robustness test this would be a good test.
code was always in tune with current market behaviour? Might it even make more sense to always choose the best fit for the curve you’re in, rather than a compromise that fits any?
Above needs OS periods to immediately follow IS periods to simulate what we would do in Live running.
I think we will find that certain Strategies will fit / work better with the short term re-optimise approach and some won’t.
If, after our tests, we may know which type of strategies fit in with re-optimising then this will be useful.
I think we will find that certain Strategies will fit / work better with the short term re-optimise approach and some won’t.
Yes and the only way to test this is to do it manually. We need to basically pick multiple random segments of data (all of the same duration) and then optimise each data segment and see how it performed immediately afterwards with the same values. We then need to choose a different duration and do the same on every possible combination of data segments. Only then can we truly know whether large data segments and not re-optimising very often is better than small ones and often re-optimising. After all this work we may decide on a duration and so how often to re-optimise but this might just end up being a re-optimising curve fit on history!
It’s more manual work than I can stand and I’m not sure that we would learn much from it.
Yes and the only way to test this is to do it manually. We need to basically pick multiple random segments of data (all of the same duration)
I can’t get my head around why it has to be random / manual?
If we are trying to simulate what we would do in Live running then 10k contiguous chunks of data (as using the WF tool) is as near as we can get to Live running (other than Live running)? Live running / re-optimising during the last 50k bars would have used the exact same 50k bars that we can now use via the WF tool.
I’ve been running a Walk Forward with 3 variables over 50k bars for the past 3 hours and it has only just started on it’s 4th stage! WF slowness saps one’s enthusiasm for doing studies like we are attempting??
I can’t get my head around why it has to be random / manual?
My thinking is coming more from a robustness testing point of view. Without picking multiple different starting points you could just get lucky with the five you chose.
Well there’s a Sunday evening I’ll never get back. Did a whole lot of number crunching, see attached Excel page which I hope is self explanatory.
Tried 3 modes of re-optimizing; monthly for 30 days, monthly for 90 days and quarterly for 90 days. The second option gave a slightly better result. The only notable thing is that the last 4 months are much better than the 4 months OOS of the 75/25 at the top. Maybe that says something, maybe not.
This is the code, run on DJI 5m, €1. It’s a very simple example, chosen a) because there’s not much to optimize, and b) because it’s clearly not v robust; the point is surely to try to make a weak strategy better. Would still need masses of forward testing to see if that can be achieved.
// Definition of code parameters
DEFPARAM CumulateOrders = false // Cumulating positions deactivated

daysForbiddenEntry = OpenDayOfWeek = 6 OR OpenDayOfWeek = 0

TIMEFRAME(120 minutes)

indicator1 = SuperTrend[mult,nbr]

c1 = (close > indicator1)
c2 = (close < indicator1)

TIMEFRAME(5 minutes)


IF  C1 AND not daysForbiddenEntry THEN

BUY 1 CONTRACT AT MARKET
SET STOP %LOSS stl

ENDIF

// Conditions to exit long positions

IF  C2 THEN
SELL AT MARKET

ENDIF

// Conditions to enter short positions

IF  C2 AND not daysForbiddenEntry THEN

SELLSHORT 1 CONTRACT AT MARKET
SET STOP %LOSS stl

ENDIF

// Conditions to exit short positions

IF  C1 THEN
EXITSHORT AT MARKET
ENDIF


//trailing stop function
trailingstart = trstr //trailing will start @trailinstart points profit
trailingstep = trst //trailing step to move the "stoploss"

//reset the stoploss value
IF NOT ONMARKET THEN
newSL=0
ENDIF

//manage long positions
IF LONGONMARKET THEN
//first move (breakeven)
IF newSL=0 AND close-tradeprice(1)>=trailingstart*pipsize THEN
newSL = tradeprice(1)+trailingstep*pipsize
ENDIF
//next moves
IF newSL>0 AND close-newSL>=trailingstep*pipsize THEN
newSL = newSL+trailingstep*pipsize
ENDIF
ENDIF

//manage short positions
IF SHORTONMARKET THEN
//first move (breakeven)
IF newSL=0 AND tradeprice(1)-close>=trailingstart*pipsize THEN
newSL = tradeprice(1)-trailingstep*pipsize
ENDIF
//next moves
IF newSL>0 AND newSL-close>=trailingstep*pipsize THEN
newSL = newSL-trailingstep*pipsize
ENDIF
ENDIF

//stop order to exit the positions
IF newSL>0 THEN
SELL AT newSL STOP
EXITSHORT AT newSL STOP
ENDIF
//************************************************************************