Hello community,
I have searched the archives for a ProRealCode version of the On Balance Volume indicator which is the same as the one available on TradingView but I have not been able to find one.
If anyone can help convert the pinescript code to create on, that would be greatly appreciated.
Here is the code available on TradingView:
//@version=5
indicator(title=”On Balance Volume”, shorttitle=”OBV”, format=format.volume, timeframe=””, timeframe_gaps=true)
var cumVol = 0.
cumVol += nz(volume)
if barstate.islast and cumVol == 0
runtime.error(“No volume is provided by the data vendor.”)
src = close
obv = ta.cum(math.sign(ta.change(src)) * volume)
plot(obv, color=#2962FF, title=”OnBalanceVolume”)
ma(source, length, type) =>
switch type
“SMA” => ta.sma(source, length)
“EMA” => ta.ema(source, length)
“SMMA (RMA)” => ta.rma(source, length)
“WMA” => ta.wma(source, length)
“VWMA” => ta.vwma(source, length)
typeMA = input.string(title = “Method”, defval = “SMA”, options=[“SMA”, “EMA”, “SMMA (RMA)”, “WMA”, “VWMA”], group=”Smoothing”)
smoothingLength = input.int(title = “Length”, defval = 5, minval = 1, maxval = 100, group=”Smoothing”)
smoothingLine = ma(obv, smoothingLength, typeMA)
plot(smoothingLine, title=”Smoothing Line”, color=#f37f20, display=display.none)
Many thanks!
Thanks Roberto,
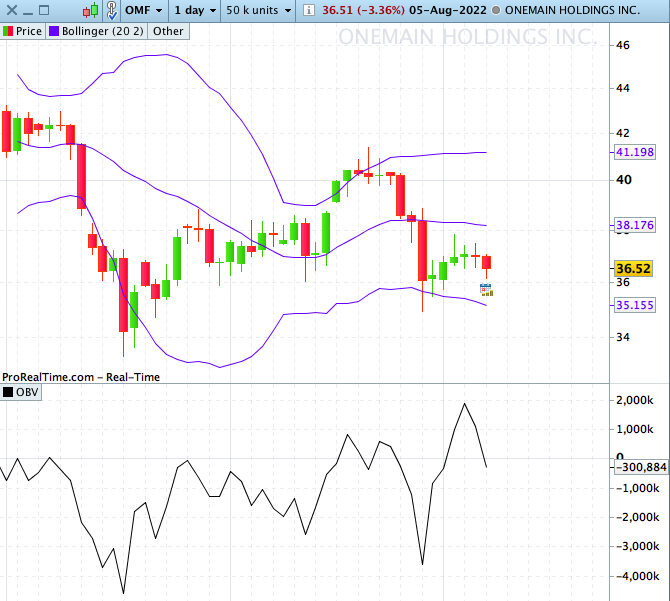
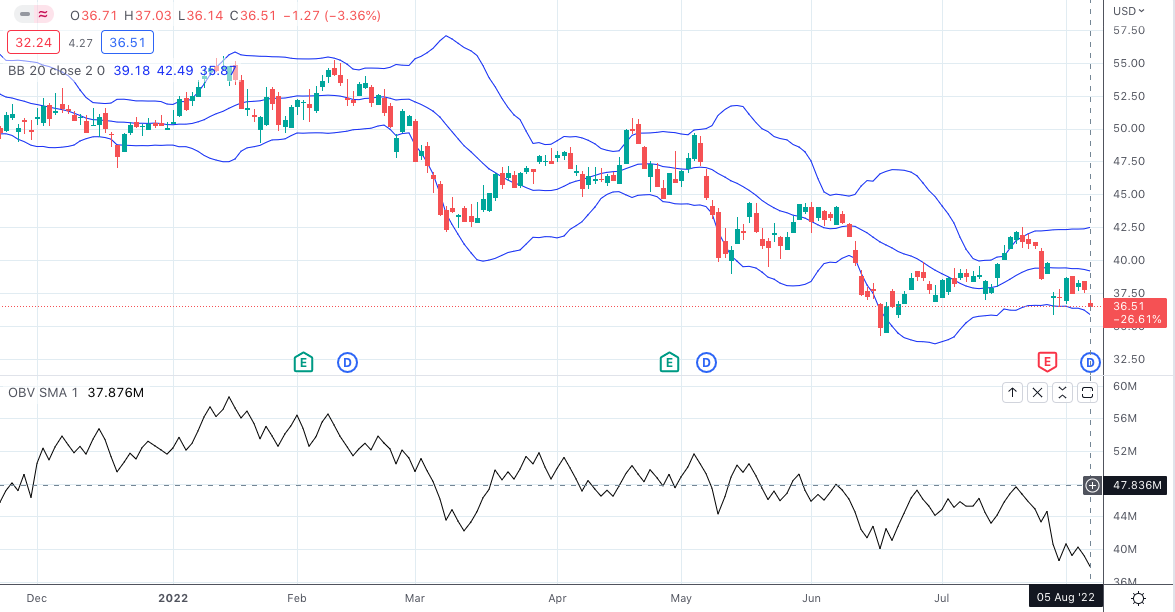
As above I have tried these links but the results are not consistent with the OBV indicator on trading view, I’ve attached some screenshots so you can see what I mean: both are screenshots of the same stock (OMF:NYSE), daily timeframe, same indicators but different results
I can’t find that one, can you post a link to it?
That screenshot is of the built in prorealtime OBV indicator, the other links in the archives give the same results.
I need a link to the source code.
JSParticipant
Master
emaPeriod = 20
useFill = 1
If Close = Close[1] then
xOBV = xOBV
EndIf
If Close > Close[1] then
xOBV = xOBV + Volume
ElsIf Close < Close[1] then
xOBV = xOBV - Volume
EndIf
EMAOBV = ExponentialAverage[emaPeriod](xOBV)
If xOBV > EMAOBV then
R = 0
G = 255
B = 0
Else
R = 255
G = 0
B = 0
EndIf
Return xOBV Coloured(R,G,B) as "On Balance Volume", EMAOBV Coloured(0,0,255) as "EMA-OBV"
Hi @quokkasoccer
The difference lies in the fact that the mentioned links all refer to the OBV Oscillator which fluctuates around the zero line.
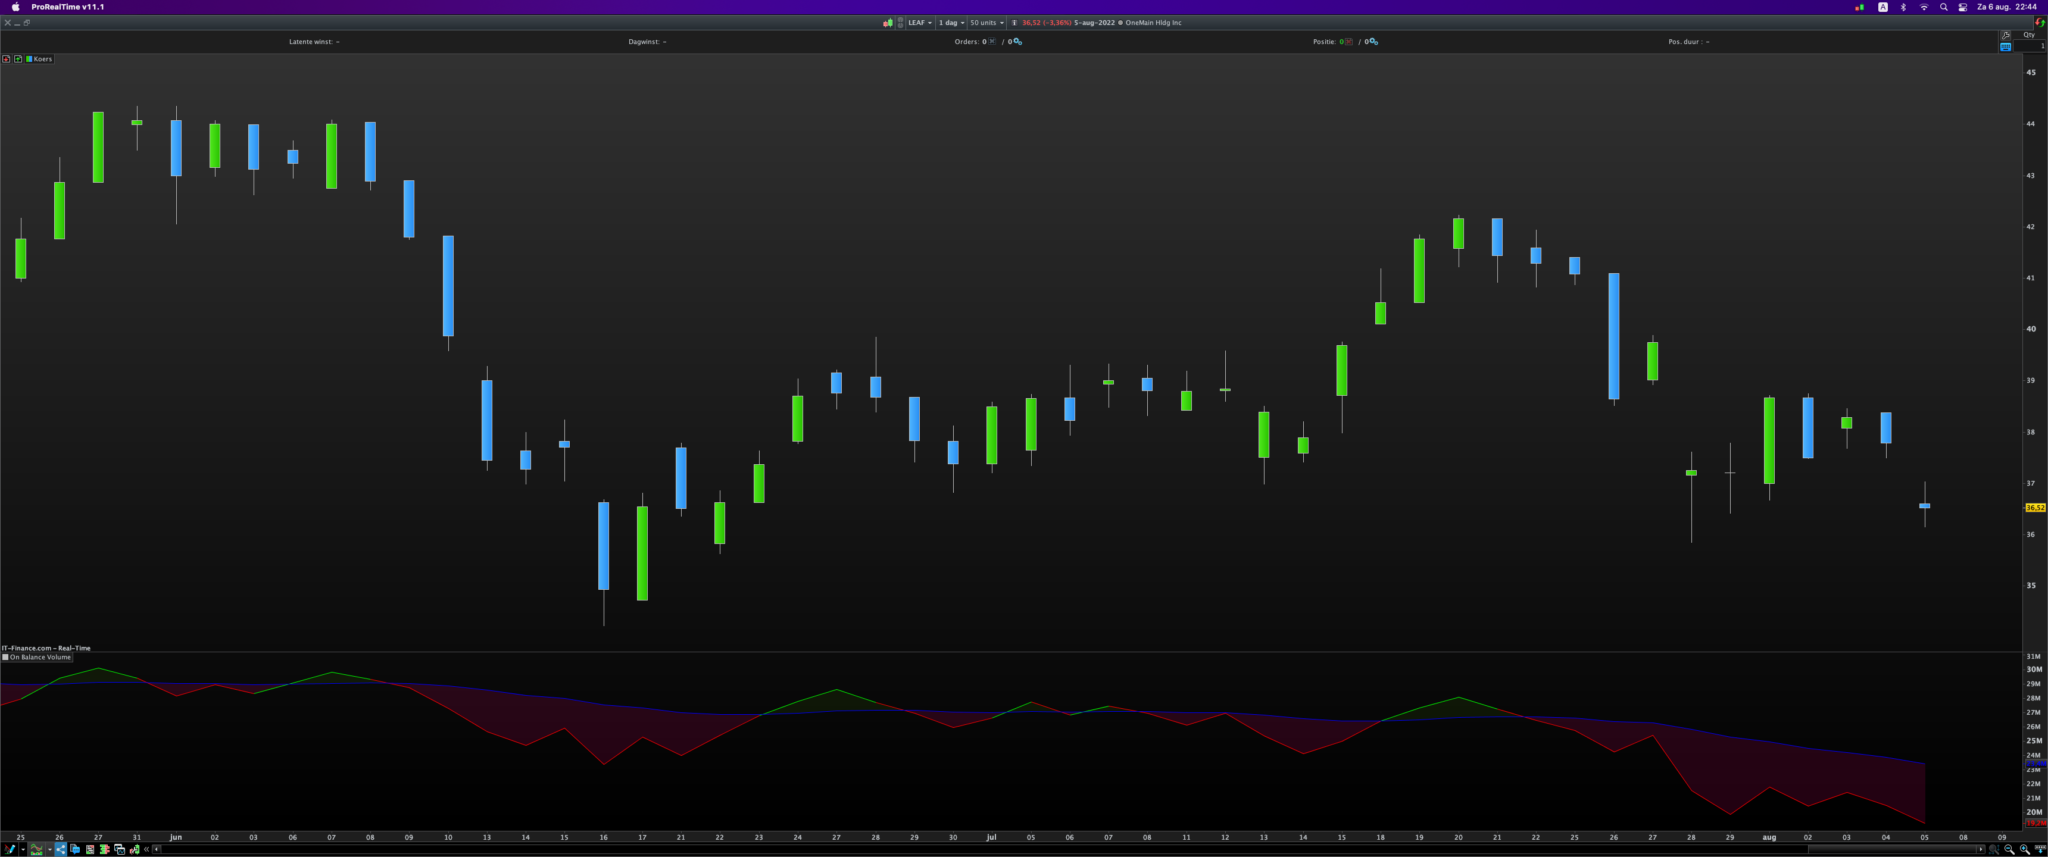
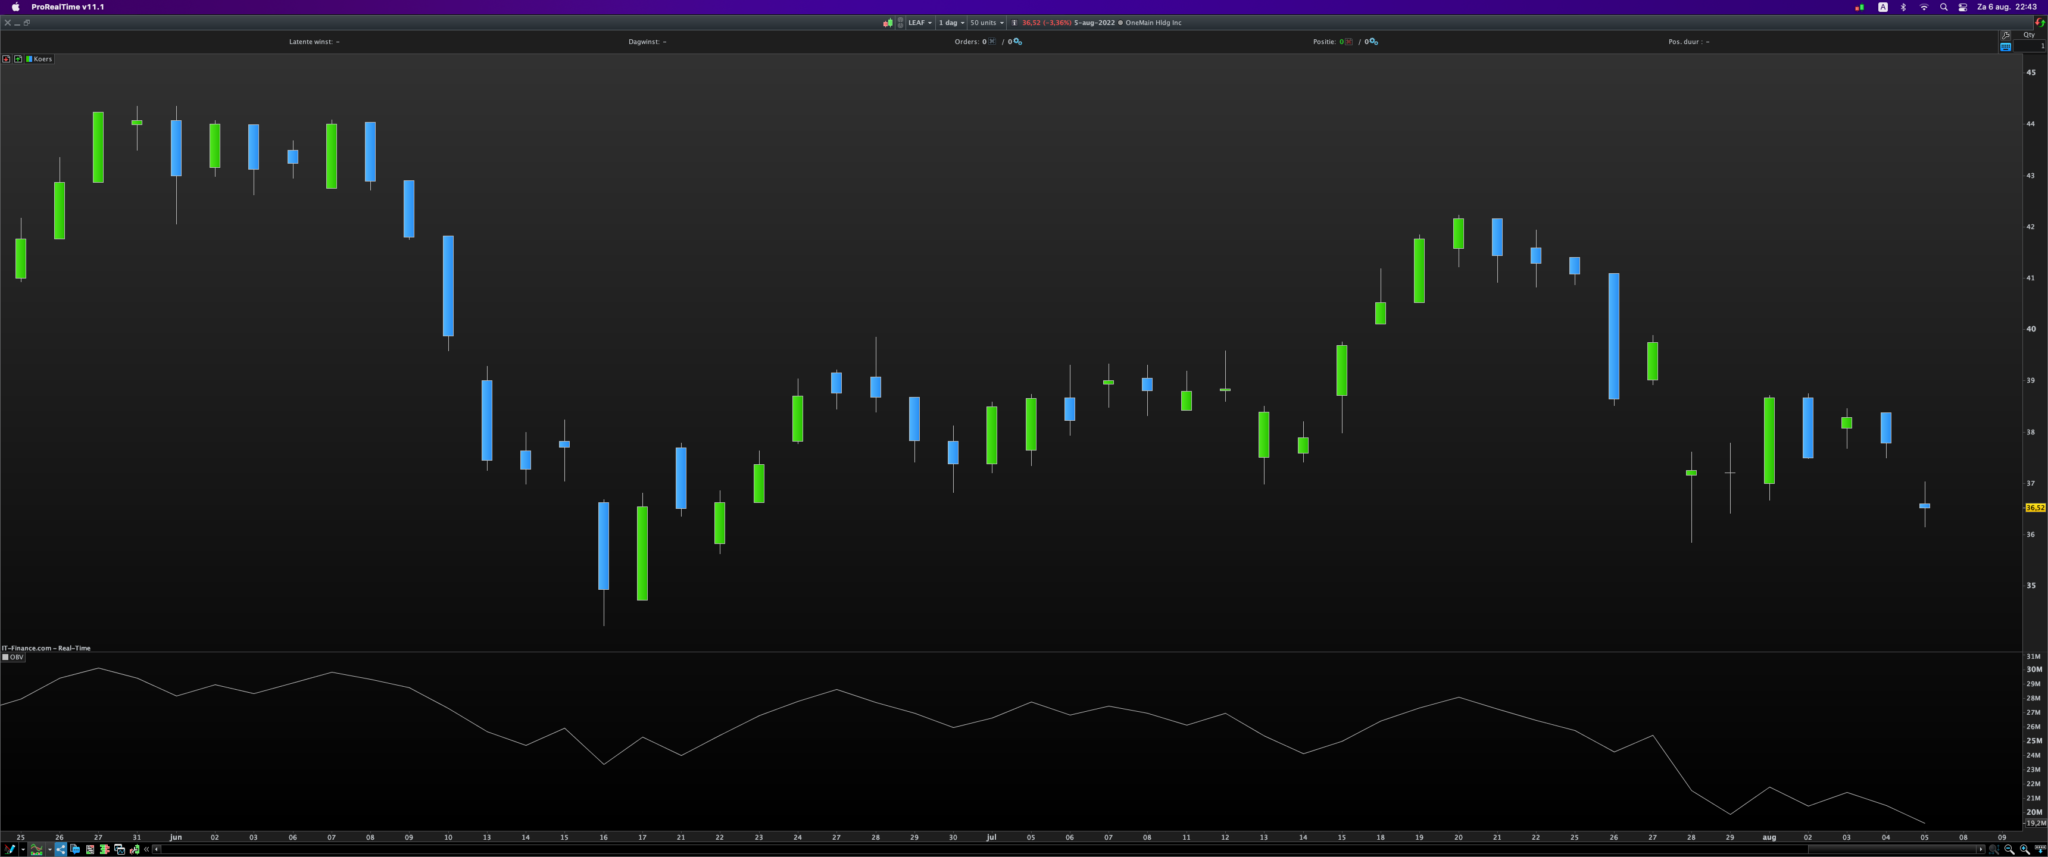
When you use the “normal built-in” function (OBV) you get the same result as in your example graph.
Your attached code is nothing more than the calculation of the “normal” OBV with the possibility to also draw a certain average (e.g. EMA) in the graph.