Hi,
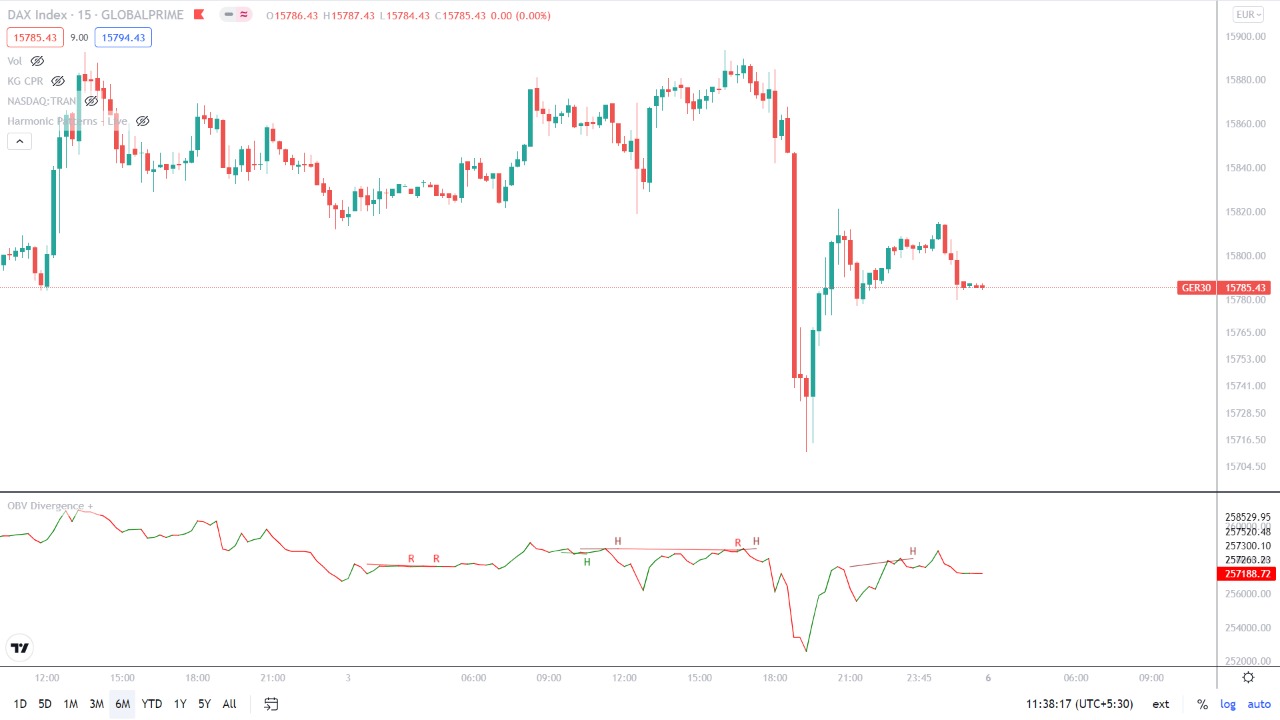
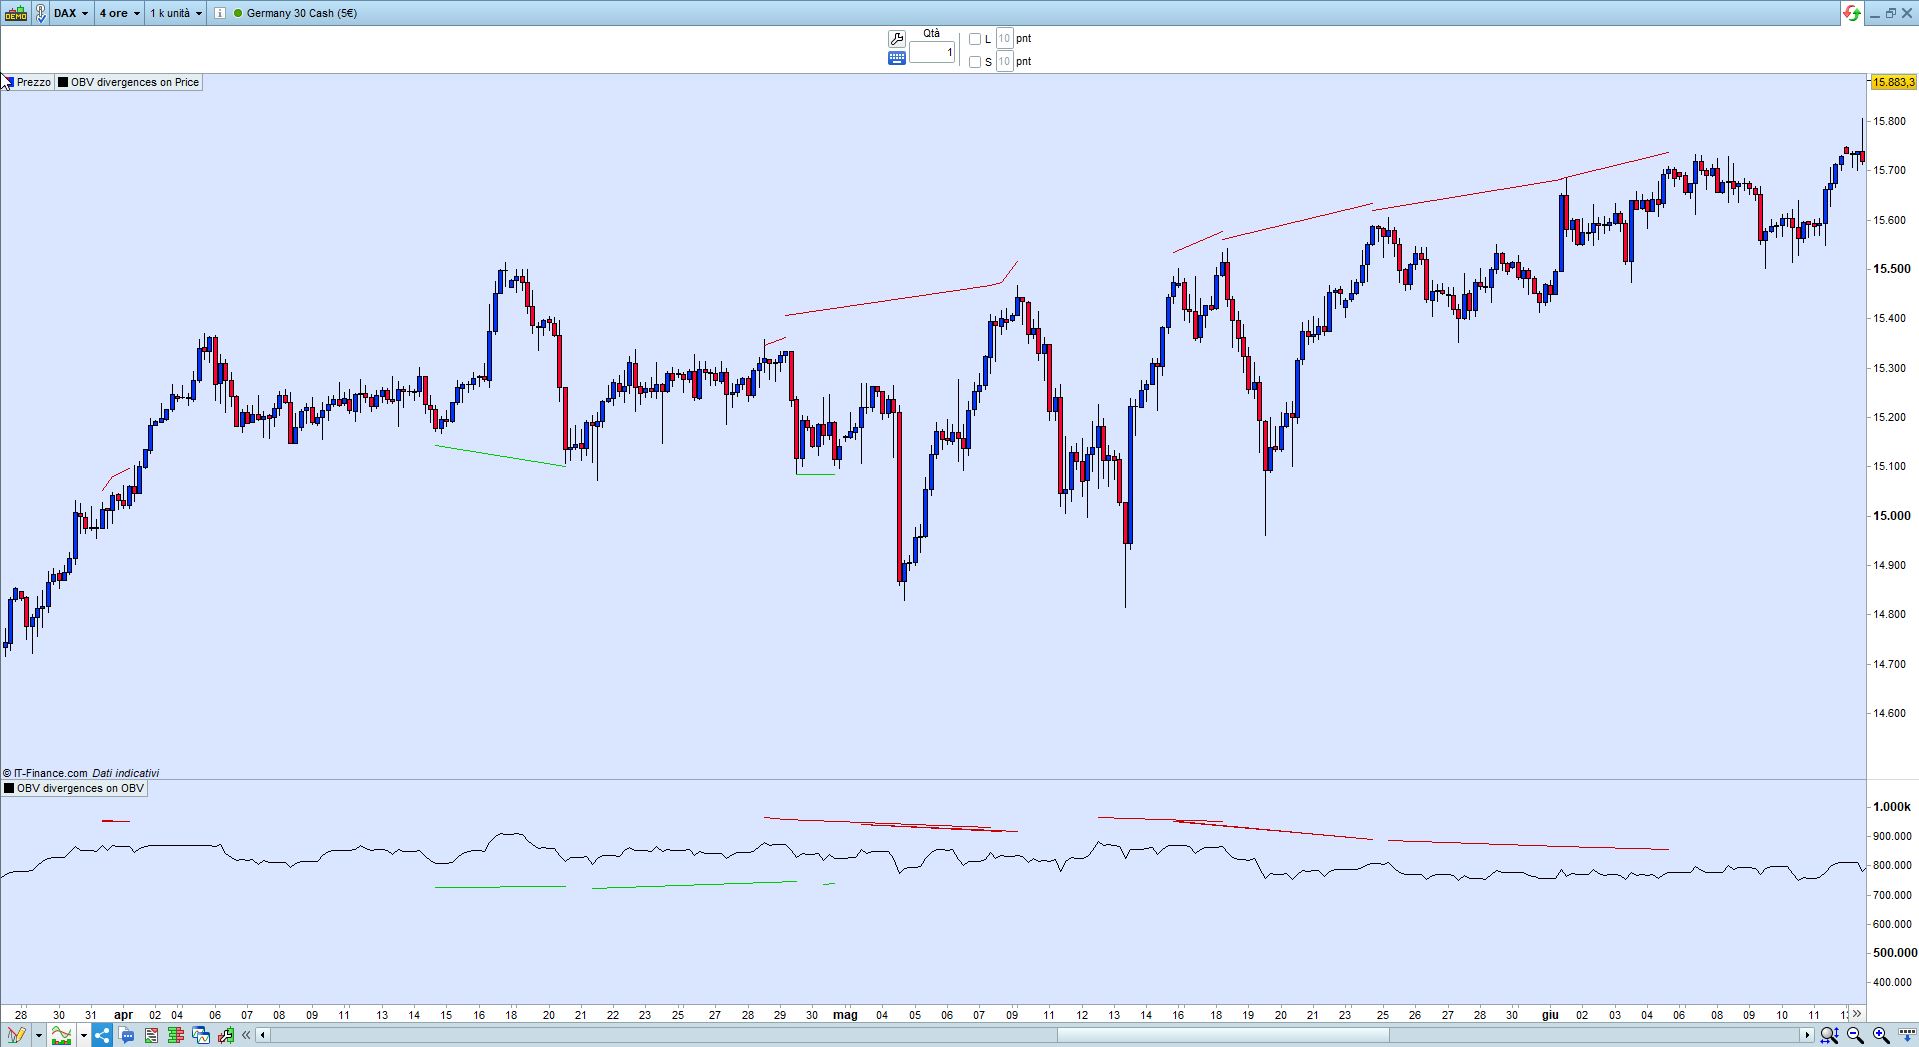
On Balance Volume Divergence indicator didn’t available in prorealtime. Below mention pine script code converter into probuilder. Please some one help on this thank you.
study(title=”OBV Divergence +”, overlay=false)
// This study Plots Divergences for OBV along with 2 MA’s
// Choose between standard type of OBV and OBV Accumulation / Distribution thanks to spacetrader which seems to be a truer reading
// Divergence Alerts are provided so that you dont have to stare at your screen all day
OBVType = input(defval=”OBV Accumulation / Distribution”, title=”OBV Type”, options=[“Standard”, “OBV Accumulation / Distribution”])
OBVSource = input(defval=”Open”, title=”OBV Source – Recommend Close for Standard Type and Open For Non Standard Type “, options=[“Open”, “Close”])
OBVColorMenu = input(title=”OBV – Directional Color Changing”, type = bool, defval = false)
FastMAType = input(defval=”SMA”, title=”Fast MA Type”, options=[“SMA”, “EMA”])
FastMALength = input(title=”Fast MA Length”, type = integer, defval = 10)
SlowMAType = input(defval=”SMA”, title=”Slow MA Type”, options=[“SMA”, “EMA”])
SlowMALength = input(title=”Slow MA Length”, type = integer, defval = 20)
DivOffsetInput = input(title=”—— Divergences Offset to Realistic Entry Point ——“, type = bool, defval = true)
DivOffset = DivOffsetInput? 0 : -2
showdivs1 = input(true, title=”1 – Regular Divergences – OBV”)
showhidden1 = input(true, title=”1 – Hidden Divergences – OBV”)
showlabels1 = input(true, title=”1 – Divergence Labels — OBV”)
showdivs2 = input(false, title=”2 – Regular Divergences – Fast MA”)
showhidden2 = input(false, title=”2 – Hidden Divergences – Fast MA”)
showlabels2 = input(false, title=”2 – Divergence Labels — Fast MA”)
showdivs3 = input(false, title=”3 – Regular Divergences – Slow MA”)
showhidden3 = input(false, title=”3 – Hidden Divergences – Slow MA”)
showlabels3 = input(false, title=”3 – Divergence Labels — Slow MA”)
OBVStandard = OBVSource==”Open” ? cum(sign(change(open)) * volume) : cum(sign(change(close)) * volume)
OBVAccDist = OBVSource==”Open” ? cum(volume * ((close – open)/(high-low))) : cum(volume * ((close – nz(close[1]))/(high – low)))
OBV = OBVType==”Standard” ? OBVStandard : OBVAccDist
// MA Calculations
FastMA= if FastMAType==”SMA”
sma(OBV,FastMALength)
else
ema(OBV,FastMALength)
SlowMA= if SlowMAType==”SMA”
sma(OBV,SlowMALength)
else
ema(OBV,SlowMALength)
OBVColorChanging = OBV > OBV[1] ? green : red
OBVColorOut = OBVColorMenu ? OBVColorChanging : #0000AA
src = close
plot(OBV, title = “OBV”, linewidth = 2, color=OBVColorOut, transp=0)
plot(FastMA, title = “Fast MA”, linewidth = 1, style = line, color = orange)
plot(SlowMA, title = “Slow MA”, linewidth = 1, style = line, color = blue)
//////////////////////
// Divergences
Dinput1=OBV
Dinput2=FastMA
Dinput3=SlowMA
//——————————
//@RicardoSantos’ Divergence Script
f_top_fractal(_src)=>_src[4] < _src[2] and _src[3] < _src[2] and _src[2] > _src[1] and _src[2] > _src[0]
f_bot_fractal(_src)=>_src[4] > _src[2] and _src[3] > _src[2] and _src[2] < _src[1] and _src[2] < _src[0]
f_fractalize(_src)=>f_top_fractal(_src) ? 1 : f_bot_fractal(_src) ? -1 : 0
//————————-
// 1st set of Divergences
fractal_top1 = f_fractalize(Dinput1) > 0 ? Dinput1[2] : na
fractal_bot1 = f_fractalize(Dinput1) < 0 ? Dinput1[2] : na
high_prev1 = valuewhen(fractal_top1, Dinput1[2], 0)[2]
high_price1 = valuewhen(fractal_top1, high[2], 0)[2]
low_prev1 = valuewhen(fractal_bot1, Dinput1[2], 0)[2]
low_price1 = valuewhen(fractal_bot1, low[2], 0)[2]
regular_bearish_div1 = fractal_top1 and high[2] > high_price1 and Dinput1[2] < high_prev1
hidden_bearish_div1 = fractal_top1 and high[2] < high_price1 and Dinput1[2] > high_prev1
regular_bullish_div1 = fractal_bot1 and low[2] < low_price1 and Dinput1[2] > low_prev1
hidden_bullish_div1 = fractal_bot1 and low[2] > low_price1 and Dinput1[2] < low_prev1
//————————-
col1 = showdivs1 and regular_bearish_div1 ? red : hidden_bearish_div1 and showhidden1 ? maroon : na
col2 = showdivs1 and regular_bullish_div1 ? #00FF00EB : hidden_bullish_div1 and showhidden1 ? green : na
//col3 = regular_bearish_div1 ? red : hidden_bearish_div1 and showhidden1 ? red : na
//col4 = regular_bullish_div1 ? green : hidden_bullish_div1 and showhidden1 ? green : na
plot(title=’OBV – Bearish Divergences’, series=(showdivs1 or showhidden1) and fractal_top1 ? Dinput1[2] : na, color=col1, linewidth=3, offset=DivOffset)
plot(title=’OBV – Bullish Divergences’, series=(showdivs1 or showhidden1) and fractal_bot1 ? Dinput1[2] : na, color=col2, linewidth=3, offset=DivOffset)
// plot(title=’1 Bearish Divergences’, series=(showdivs1 or showhidden1) and fractal_top1 ? Dinput1[2] : na, color=col1, linewidth=3, offset=DivOffset)
// plot(title=’1 Bullish Divergences’, series=(showdivs1 or showhidden1) and fractal_bot1 ? Dinput1[2] : na, color=col2, linewidth=3, offset=DivOffset)
//plot(title=’1 H D’, series=(showdivs1 or showhidden1) and fractal_top1 ? Dinput1[2] : na, style=circles, color=col3, linewidth=3, offset=DivOffset)
//plot(title=’1 L D’, series=(showdivs1 or showhidden1) and fractal_bot1 ? Dinput1[2] : na, style=circles, color=col4, linewidth=3, offset=DivOffset)
plotshape(title=’OBV – Regular Bearish Divergence’, series=showdivs1 and regular_bearish_div1 and showlabels1 ? Dinput1[2] : na, text=’R’, style=shape.labeldown, location=location.absolute, color=na, textcolor=#FF0000FA, offset=DivOffset)
plotshape(title=’OBV – Hidden Bearish Divergence’ , series=hidden_bearish_div1 and showhidden1 and showlabels1 ? Dinput1[2] : na, text=’H’, style=shape.labeldown, location=location.absolute, color=na, textcolor=#800000FA, offset=DivOffset)
plotshape(title=’OBV – Regular Bullish Divergence’, series=showdivs1 and regular_bullish_div1 and showlabels1 ? Dinput1[2] : na, text=’R’, style=shape.labelup, location=location.absolute, color=na, textcolor=#00FF00FA, offset=DivOffset)
plotshape(title=’OBV – Hidden Bullish Divergence’ , series=hidden_bullish_div1 and showhidden1 and showlabels1 ? Dinput1[2] : na, text=’H’, style=shape.labelup, location=location.absolute, color=na, textcolor=#008000FA, offset=DivOffset)
// 2nd set of Divergences
fractal_top2 = f_fractalize(Dinput2) > 0 ? Dinput2[2] : na
fractal_bot2 = f_fractalize(Dinput2) < 0 ? Dinput2[2] : na
high_prev2 = valuewhen(fractal_top2, Dinput2[2], 0)[2]
high_price2 = valuewhen(fractal_top2, high[2], 0)[2]
low_prev2 = valuewhen(fractal_bot2, Dinput2[2], 0)[2]
low_price2 = valuewhen(fractal_bot2, low[2], 0)[2]
regular_bearish_div2 = fractal_top2 and high[2] > high_price2 and Dinput2[2] < high_prev2
hidden_bearish_div2 = fractal_top2 and high[2] < high_price2 and Dinput2[2] > high_prev2
regular_bullish_div2 = fractal_bot2 and low[2] < low_price2 and Dinput2[2] > low_prev2
hidden_bullish_div2 = fractal_bot2 and low[2] > low_price2 and Dinput2[2] < low_prev2
//————————-
col5 = showdivs2 and regular_bearish_div2 ? red : hidden_bearish_div2 and showhidden2 ? maroon : na
col6 = showdivs2 and regular_bullish_div2 ? #00FF00EB : hidden_bullish_div2 and showhidden2 ? green : na
//col7 = regular_bearish_div2 ? red : hidden_bearish_div2 and showhidden2 ? red : na
//col8 = regular_bullish_div2 ? green : hidden_bullish_div2 and showhidden2 ? green : na
plot(title=’Fast MA – Bearish Divergences’, series=(showdivs2 or showhidden2) and fractal_top2 ? Dinput2[2] : na, color=col5, linewidth=3, offset=DivOffset)
plot(title=’Fast MA – Bullish Divergences’, series=(showdivs2 or showhidden2) and fractal_bot2 ? Dinput2[2] : na, color=col6, linewidth=3, offset=DivOffset)
// plot(title=’2 Bearish Divergences’, series=(showdivs2 or showhidden2) and fractal_top2 ? Dinput2[2] : na, color=col5, linewidth=3, offset=DivOffset)
// plot(title=’2 Bullish Divergences’, series=(showdivs2 or showhidden2) and fractal_bot2 ? Dinput2[2] : na, color=col6, linewidth=3, offset=DivOffset)
//plot(title=’2 H D’, series=(showdivs2 or showhidden2) and fractal_top2 ? Dinput2[2] : na, style=circles, color=col3, linewidth=3, offset=DivOffset)
//plot(title=’2 L D’, series=(showdivs2 or showhidden2) and fractal_bot2 ? Dinput2[2] : na, style=circles, color=col4, linewidth=3, offset=DivOffset)
plotshape(title=’Fast MA – Regular Bearish Divergence’, series=showdivs2 and regular_bearish_div2 and showlabels2 ? Dinput2[2] : na, text=’R’, style=shape.labeldown, location=location.absolute, color=na, textcolor=#FF0000FA, offset=DivOffset)
plotshape(title=’Fast MA – Hidden Bearish Divergence’ , series=hidden_bearish_div2 and showhidden2 and showlabels2 ? Dinput2[2] : na, text=’H’, style=shape.labeldown, location=location.absolute, color=na, textcolor=#800000FA, offset=DivOffset)
plotshape(title=’Fast MA – Regular Bullish Divergence’, series=showdivs2 and regular_bullish_div2 and showlabels2 ? Dinput2[2] : na, text=’R’, style=shape.labelup, location=location.absolute, color=na, textcolor=#00FF00FA, offset=DivOffset)
plotshape(title=’Fast MA – Hidden Bullish Divergence’ , series=hidden_bullish_div2 and showhidden2 and showlabels2 ? Dinput2[2] : na, text=’H’, style=shape.labelup, location=location.absolute, color=na, textcolor=#008000FA, offset=DivOffset)
// 3rd set of Divergences
fractal_top3 = f_fractalize(Dinput3) > 0 ? Dinput3[2] : na
fractal_bot3 = f_fractalize(Dinput3) < 0 ? Dinput3[2] : na
high_prev3 = valuewhen(fractal_top3, Dinput3[2], 0)[2]
high_price3 = valuewhen(fractal_top3, high[2], 0)[2]
low_prev3 = valuewhen(fractal_bot3, Dinput3[2], 0)[2]
low_price3 = valuewhen(fractal_bot3, low[2], 0)[2]
regular_bearish_div3 = fractal_top3 and high[2] > high_price3 and Dinput3[2] < high_prev3
hidden_bearish_div3 = fractal_top3 and high[2] < high_price3 and Dinput3[2] > high_prev3
regular_bullish_div3 = fractal_bot3 and low[2] < low_price3 and Dinput3[2] > low_prev3
hidden_bullish_div3 = fractal_bot3 and low[2] > low_price3 and Dinput3[2] < low_prev3
//————————-
col9 =showdivs3 and regular_bearish_div3 ? red : hidden_bearish_div3 and showhidden3 ? maroon : na
col10 =showdivs3 and regular_bullish_div3 ? #00FF00EB : hidden_bullish_div3 and showhidden3 ? green : na
//col11 = regular_bearish_div1 ? red : hidden_bearish_div1 and showhidden1 ? red : na
//col12 = regular_bullish_div1 ? green : hidden_bullish_div1 and showhidden1 ? green : na
plot(title=’Slow MA – Bearish Divergences’, series=(showdivs1 or showhidden1) and fractal_top3 ? Dinput3[2] : na, color=col9, linewidth=3, offset=DivOffset)
plot(title=’Slow MA – Bullish Divergences’, series=(showdivs1 or showhidden1) and fractal_bot3 ? Dinput3[2] : na, color=col10, linewidth=3, offset=DivOffset)
//plot(title=’1 H D’, series=(showdivs1 or showhidden1) and fractal_top1 ? Dinput1[2] : na, style=circles, color=col3, linewidth=3, offset=DivOffset)
//plot(title=’1 L D’, series=(showdivs1 or showhidden1) and fractal_bot1 ? Dinput1[2] : na, style=circles, color=col4, linewidth=3, offset=DivOffset)
plotshape(title=’Slow MA – Regular Bearish Divergence’, series=showdivs3 and regular_bearish_div3 and showlabels3 ? Dinput3[2] : na, text=’R’, style=shape.labeldown, location=location.absolute, color=na, textcolor=#FF0000FA, offset=DivOffset)
plotshape(title=’Slow MA – Hidden Bearish Divergence’ , series=hidden_bearish_div3 and showhidden3 and showlabels3 ? Dinput3[2] : na, text=’H’, style=shape.labeldown, location=location.absolute, color=na, textcolor=#800000FA, offset=DivOffset)
plotshape(title=’Slow MA – Regular Bullish Divergence’, series=showdivs3 and regular_bullish_div3 and showlabels3 ? Dinput3[2] : na, text=’R’, style=shape.labelup, location=location.absolute, color=na, textcolor=#00FF00FA, offset=DivOffset)
plotshape(title=’Slow MA – Hidden Bullish Divergence’ , series=hidden_bullish_div3 and showhidden3 and showlabels3 ? Dinput3[2] : na, text=’H’, style=shape.labelup, location=location.absolute, color=na, textcolor=#008000FA, offset=DivOffset)
///////////////////////////////////////////////////////////////////////////////
// Divergence Alerts
// OBV Divergence Alerts
alertcondition(regular_bearish_div1, title=’Alert – OBV – Regular Bearish Divergence’, message=’OBV – Regular Bearish Divergence’)
alertcondition(hidden_bearish_div1, title=’Alert – OBV – Hidden Bearish Divergence’, message=’OBV – Hidden Bearish Divergence’)
alertcondition(regular_bullish_div1, title=’Alert – OBV – Regular Bullish Divergence’, message=’OBV – Regular Bullish Divergence’)
alertcondition(hidden_bullish_div1, title=’Alert – OBV – Hidden Bullish Divergence’, message=’OBV – Hidden Bullish Divergence’)
// OBV Fast MA Divergence Alerts
alertcondition(regular_bearish_div2, title=’Alert-FastMA-Regular Bearish Divergence’, message=’OBV – Fast MA – Regular Bearish Divergence’)
alertcondition(hidden_bearish_div2, title=’Alert-FastMA-Hidden Bearish Divergence’, message=’OBV – Fast MA – Hidden Bearish Divergence’)
alertcondition(regular_bullish_div2, title=’Alert-FastMA-Regular Bullish Divergence’, message=’OBV – Fast MA – Regular Bullish Divergence’)
alertcondition(hidden_bullish_div2, title=’Alert-FastMA-Hidden Bullish Divergence’, message=’OBV – Fast MA – Hidden Bullish Divergence’)
// OBV Slow MA Divergence Alerts
alertcondition(regular_bearish_div3, title=’Alert-FastMA-Regular Bearish Divergence’, message=’OBV – Slow MA – Regular Bearish Divergence’)
alertcondition(hidden_bearish_div3, title=’Alert-FastMA-Hidden Bearish Divergence’, message=’OBV – Slow MA – Hidden Bearish Divergence’)
alertcondition(regular_bullish_div3, title=’Alert-FastMA-Regular Bullish Divergence’, message=’OBV – Slow MA – Regular Bullish Divergence’)
alertcondition(hidden_bullish_div3, title=’Alert-FastMA-Hidden Bullish Divergence’, message=’OBV – Slow MA – Hidden Bullish Divergence’)