new indicator: GaussTrendChannels

Viewing 6 posts - 1 through 6 (of 6 total)
  • Author
    Posts
  • #244343 quote
    micha2012micha2012
    Participant
    Average
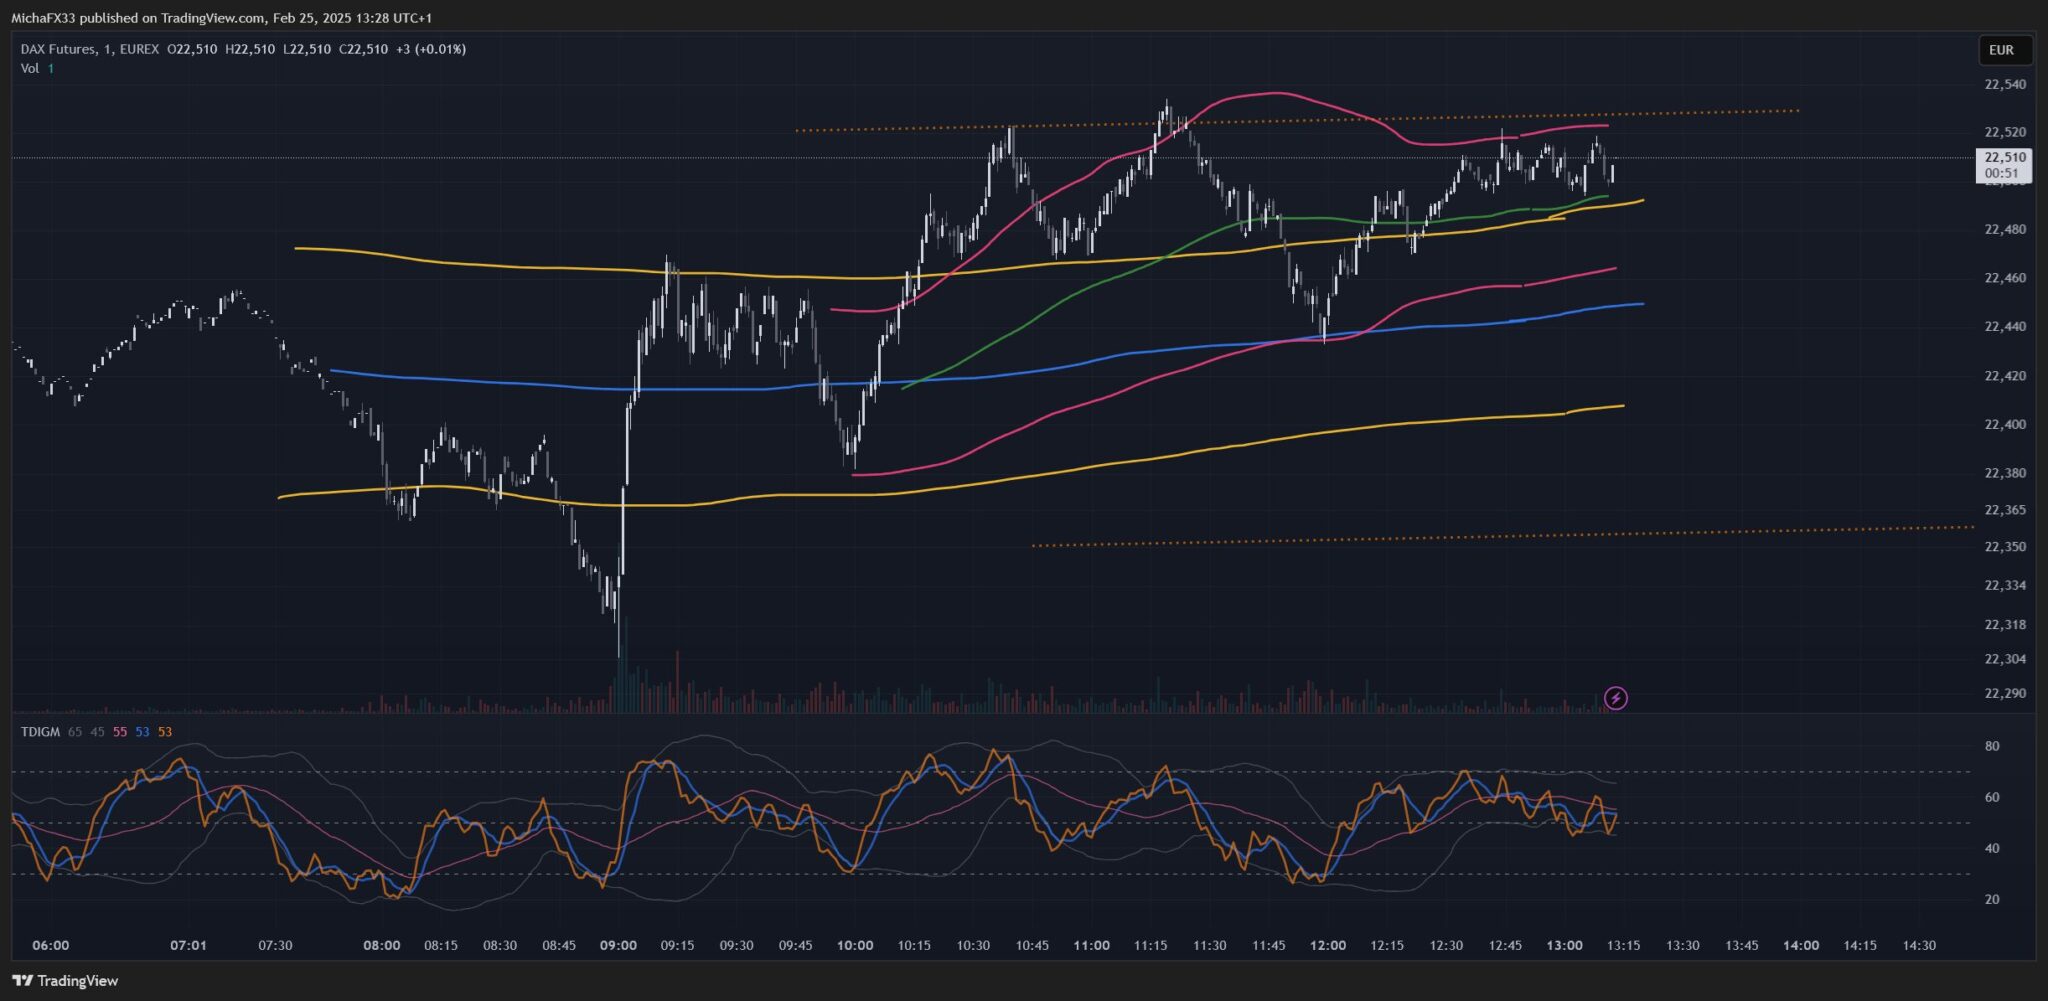
    Dear All, today i would like to presend an interesting indicator, which I use frequently for Furures (5min.,1min.) gaining good result. AS alqways, my coding skills are basic..I could not solve last 3x lines for PLOt / DRAWLINE.. {{ DEFPARAM CalculateonLastBars = 500 Length = 200 // Standardlänge // Gaussian Kernel Berechnung ohne Funktion currentWeight = 0 cumulativeWeight = 0 FOR i = 0 TO Length – 1 DO weight = EXP(- (i * i) / (2 * ((Length / 3) * (Length / 3)))) currentWeight = currentWeight + close[i] * weight cumulativeWeight = cumulativeWeight + weight NEXT Ghat = currentWeight / cumulativeWeight // Rolling Standard Deviation Berechnung ohne Funktion sumVal = 0 sumSq = 0 FOR i = 0 TO Length – 1 DO sumVal = sumVal + close[i] sumSq = sumSq + (close[i] * close[i]) NEXT mean = sumVal / Length variance = (sumSq / Length) – (mean * mean) Deviation = SQRT(MAX(variance, 0)) // Berechnungen Upper = Ghat + Deviation Lower = Ghat – Deviation // Plots (Linien) DRAWHLINE(Upper, RGB(0, 120, 255)) // Zeichnet die Linie für Upper DRAWHLINE(Lower, RGB(0, 120, 255)) // Zeichnet die Linie für Lower DRAWHLINE(Ghat, RGB(0, 255, 0)) // Zeichnet die Linie für Ghat RETURN}} Please, could you support me in solving graphical problems? Below, please find a screenshot on trading ideas with this indicator. (5min. channel= blue, yellow / 1min. channel=pink, green) / 1h channel= orange dotted line) Thank you very much. Regards to all!
    FDAX1_2025-02-25_13-28-10.jpg FDAX1_2025-02-25_13-28-10.jpg
    #244359 quote
    JSJS
    Participant
    Master

    Here is the adjusted indicator:

    DEFPARAM CalculateonLastBars = 500
    
    Length = 200 // Standardlänge
    
    // Gaussian Kernel Berechnung ohne Funktion
    CurrentWeight = 0
    CumulativeWeight = 0
    
    FOR i = 0 TO Length - 1 DO
    Weight = EXP(- (i * i) / (2 * ((Length / 3) * (Length / 3))))
    currentWeight = currentWeight + close[i] * weight
    cumulativeWeight = cumulativeWeight + weight
    NEXT
    Ghat = currentWeight / cumulativeWeight
    
    // Rolling Standard Deviation Berechnung ohne Funktion
    sumVal = 0
    sumSq = 0
    FOR i = 0 TO Length - 1 DO
    sumVal = sumVal + close[i]
    sumSq = sumSq + (close[i] * close[i])
    NEXT
    mean = sumVal / Length
    variance = (sumSq / Length) - (mean * mean)
    Deviation = SQRT(MAX(variance, 0))
    
    // Berechnungen
    Upper = Ghat + Deviation
    Lower = Ghat - Deviation
    
    RETURN Ghat as "Ghat" Coloured(0,255,0), Upper as "Upper" Coloured(0,120,255),Lower as "Lower" Coloured(0,120,255)

    Scherm­afbeelding-2025-02-25-om-21.33.53.jpg Scherm­afbeelding-2025-02-25-om-21.33.53.jpg
    #244417 quote
    micha2012micha2012
    Participant
    Average
    @JS Hello JS, thank you very much – merci beaucoup – bedankt. Great job and support from you…works perfect! One questions: is it possible to display (and code) 5min- channel displayed in 1min- period??? All the best. Thanx Micha
    JS thanked this post
    #244423 quote
    JSJS
    Participant
    Master

    When you use this indicator, based on a 5-minute timeframe, you can display it in a graph with a 1-minute timeframe…

    DEFPARAM CalculateonLastBars = 500
    
    TimeFrame(5 minutes,UpdateOnClose)
    Length = 200 // Standard Period
    
    // Gaussian Kernel Calculation
    CurrentWeight = 0
    CumulativeWeight = 0
    
    FOR i = 0 TO Length - 1 DO
    Weight = EXP(- (i * i) / (2 * ((Length / 3) * (Length / 3))))
    currentWeight = currentWeight + close[i] * weight
    cumulativeWeight = cumulativeWeight + weight
    NEXT
    Ghat = currentWeight / cumulativeWeight
    
    // Rolling Standard Deviation Calculation
    sumVal = 0
    sumSq = 0
    FOR i = 0 TO Length - 1 DO
    sumVal = sumVal + close[i]
    sumSq = sumSq + (close[i] * close[i])
    NEXT
    mean = sumVal / Length
    variance = (sumSq / Length) - (mean * mean)
    Deviation = SQRT(MAX(variance, 0))
    
    // Band Calculations
    Upper = Ghat + Deviation
    Lower = Ghat - Deviation
    
    TimeFrame(Default)
    
    //Plotting
    RETURN Ghat as "Ghat" Coloured(0,255,0), Upper as "Upper" Coloured(0,120,255),Lower as "Lower" Coloured(0,120,255)
    

    micha2012 thanked this post
    Scherm­afbeelding-2025-02-27-om-16.40.00.png Scherm­afbeelding-2025-02-27-om-16.40.00.png
    #244428 quote
    micha2012micha2012
    Participant
    Average
    Hello JS, wow..you are the best..great! You saved me a lot of coding (“try and error”).. 🙂 Thank you once again for your fast support and coding. Bedankt! Thanx, Micha
    JS thanked this post
    #244431 quote
    JSJS
    Participant
    Master
    Thanks, Micha! Hope it works out for you…
Viewing 6 posts - 1 through 6 (of 6 total)
  • You must be logged in to reply to this topic.

ProRealAI ProRealAI New

Stuck on this ProBuilder code?

Describe what this topic is trying to build, in plain English, and ProRealAI writes the ProRealTime™ indicator, screener or system for you.

Available in 7 languages
Try ProRealAI

new indicator: GaussTrendChannels


ProBuilder: Indicators & Custom Tools

New Reply
Author
author-avatar
micha2012 @micha2012 Participant
Summary

This topic contains 5 replies,
has 2 voices, and was last updated by JSJS

1 year, 6 months ago.

Topic Details
Forum: ProBuilder: Indicators & Custom Tools
Language: English
Started: 02/25/2025
Status: Active
Attachments: 3 files
ProRealCode ProRealCode
Loading...