ProRealCode - Trading & Coding with ProRealTime™
Hi guys 🙂
I’d like to share my first code with you, and perhaps get your point of view on my ideas. I also like to discuss the problems that I encountered. Both coding problems and back testing problems- and perhaps strategy problems- feel free to comment 🙂
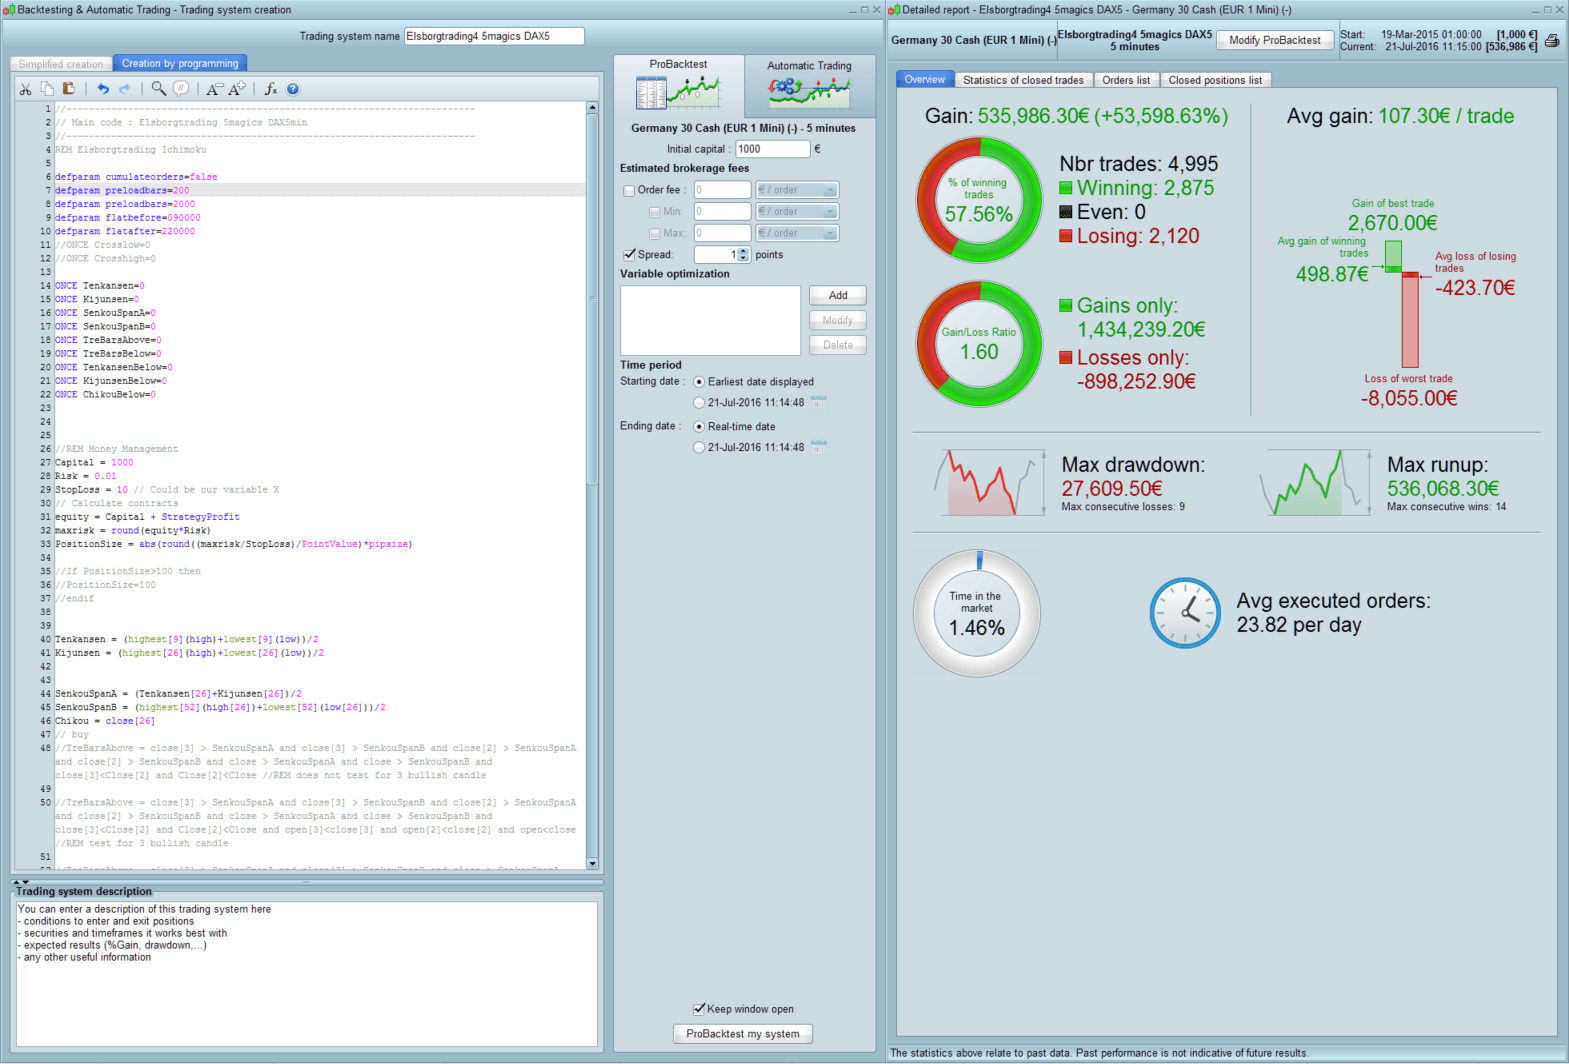
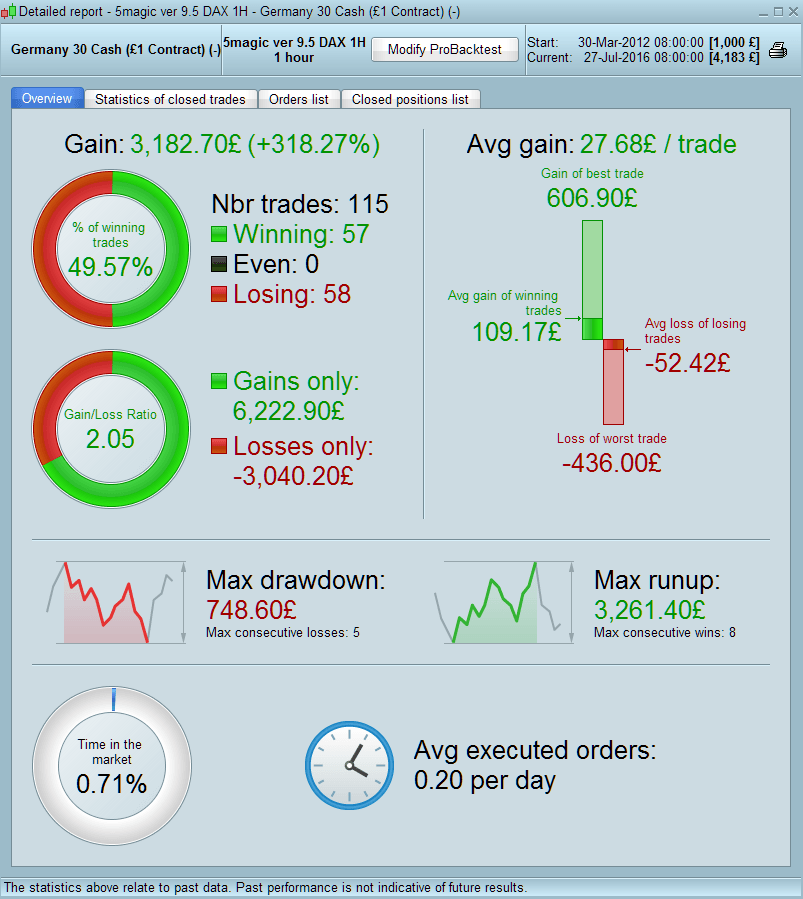
First the idea is based on Ichimoku without the tenkansen/kinjunsen cross- which in my testing it wasn’t successful. Initially I started back testing it on a DAX 4hour chart. The back testing was insane and too good to be true. And then it usually is (approx. 132.000.000 % gain over 4 years) so the idea is that the code needs to generate approximate 50/50 lose-win, and more than a 2.5 gain/loose ration. I think that is more realistic in many ways. however the lates ver. of the code does not apply to this, and is still to good to be true when back testing it. so something must be wrong.
The strategy I’d like to make is Ichimoku based, and these are the condition for a trade:
Long trades: Tenkensan, Kinjusan and Chikou need to be above the cloud, and I need 3 bullish candles in an up-trend and opening on a 3rd that is above the median price of prior candle, and also above the cloud before making a long trade. Trade should be placed on the opening of the 3rd candle if it meets the condition
Short trade: same as Long, but of cause inverted: Tenkensan, Kinjusan and Chikou needs to be below the cloud and I need 3 bearish candles in a downtrend and opening on a 3rd that is below the median price of prior candle, and also below the cloud before making a short trade. Trade should be placed on the opening of the 3rd candle if it meets the condition
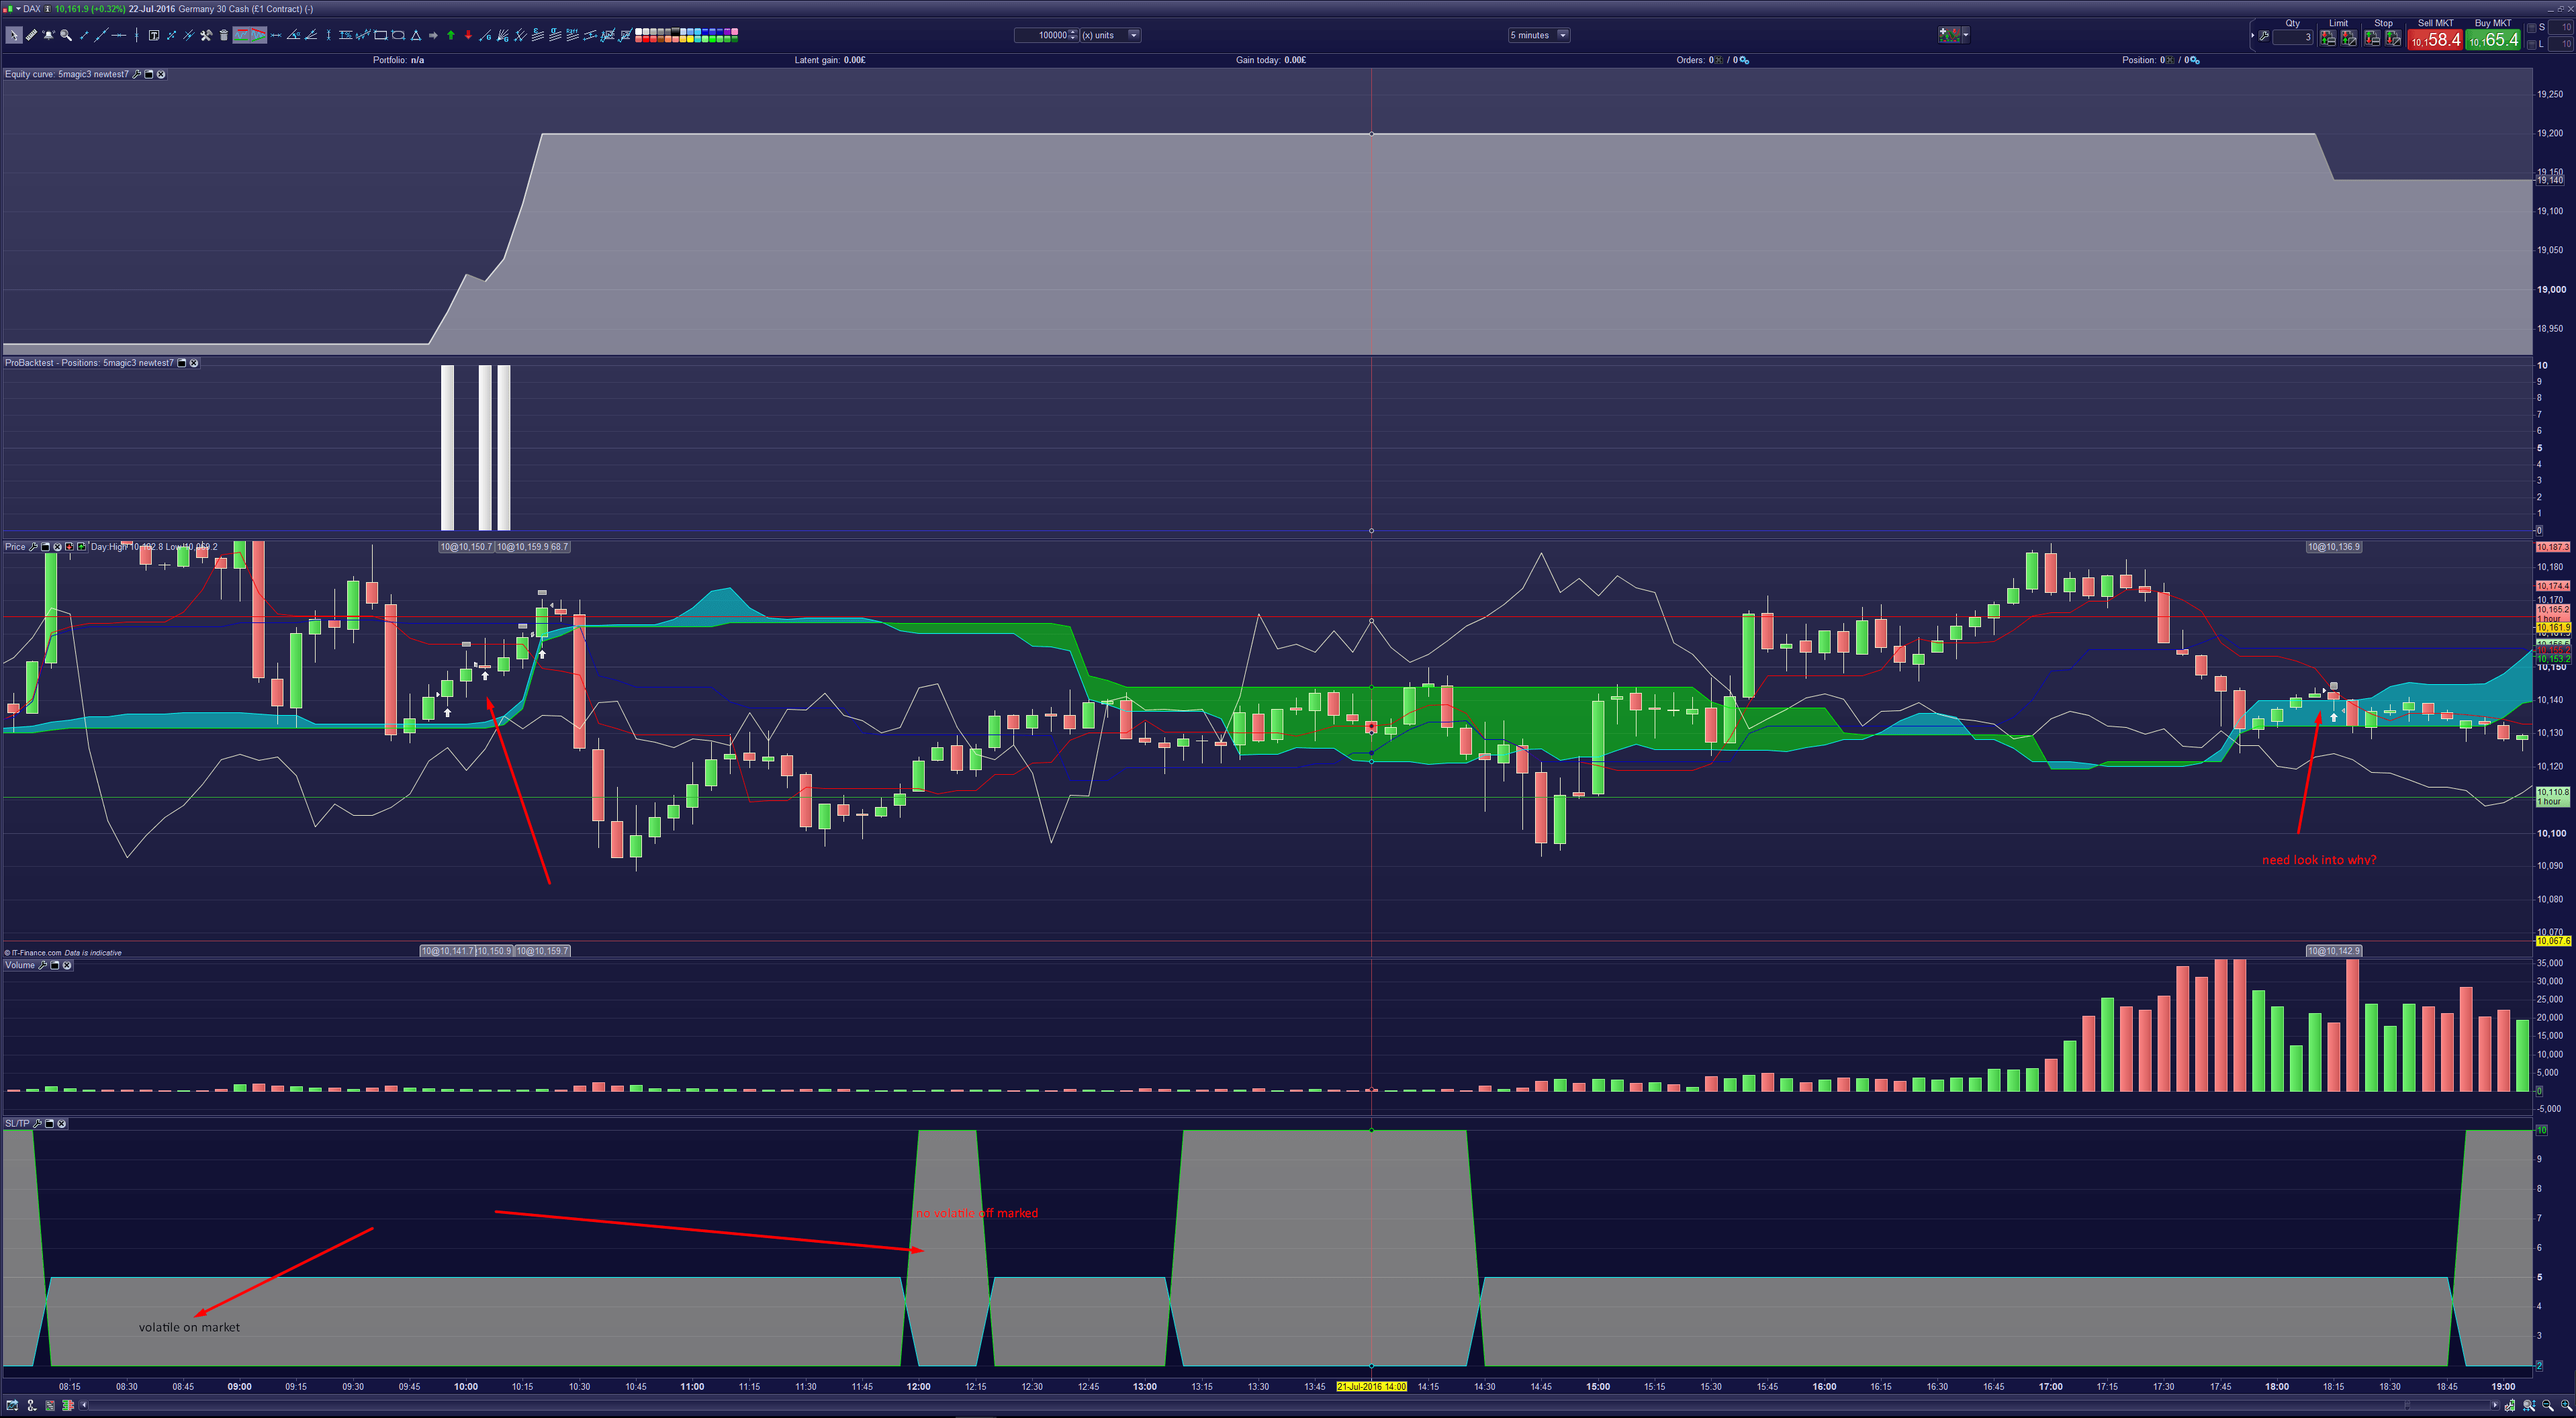
I also tried to implement a strategy for low, medium and high volatile periods- playing with different stop/loss scenarios – the idea is still in the making but derived from the problems that maybe are with back testing (?) And also I wanted to scalp the price action in low volatile sideways trend. I don’t think it would work with the same SL/TP strategy as when you are in a strong up/down trend.
So my questions are:
Back testing:
To get the basics strait I think the problem with back testing is PRT only test on the whole candle- not the pips size action with the candle timeframe so in theory low SL is never stopped out and produce very good result, but in real trade they are meet almost every time. I don’t know if I’m right but it seems like it, as the 4H DAX test never stopped out with as small as an 8 point SL. Perhaps someone knows more about this?
Coding problems:
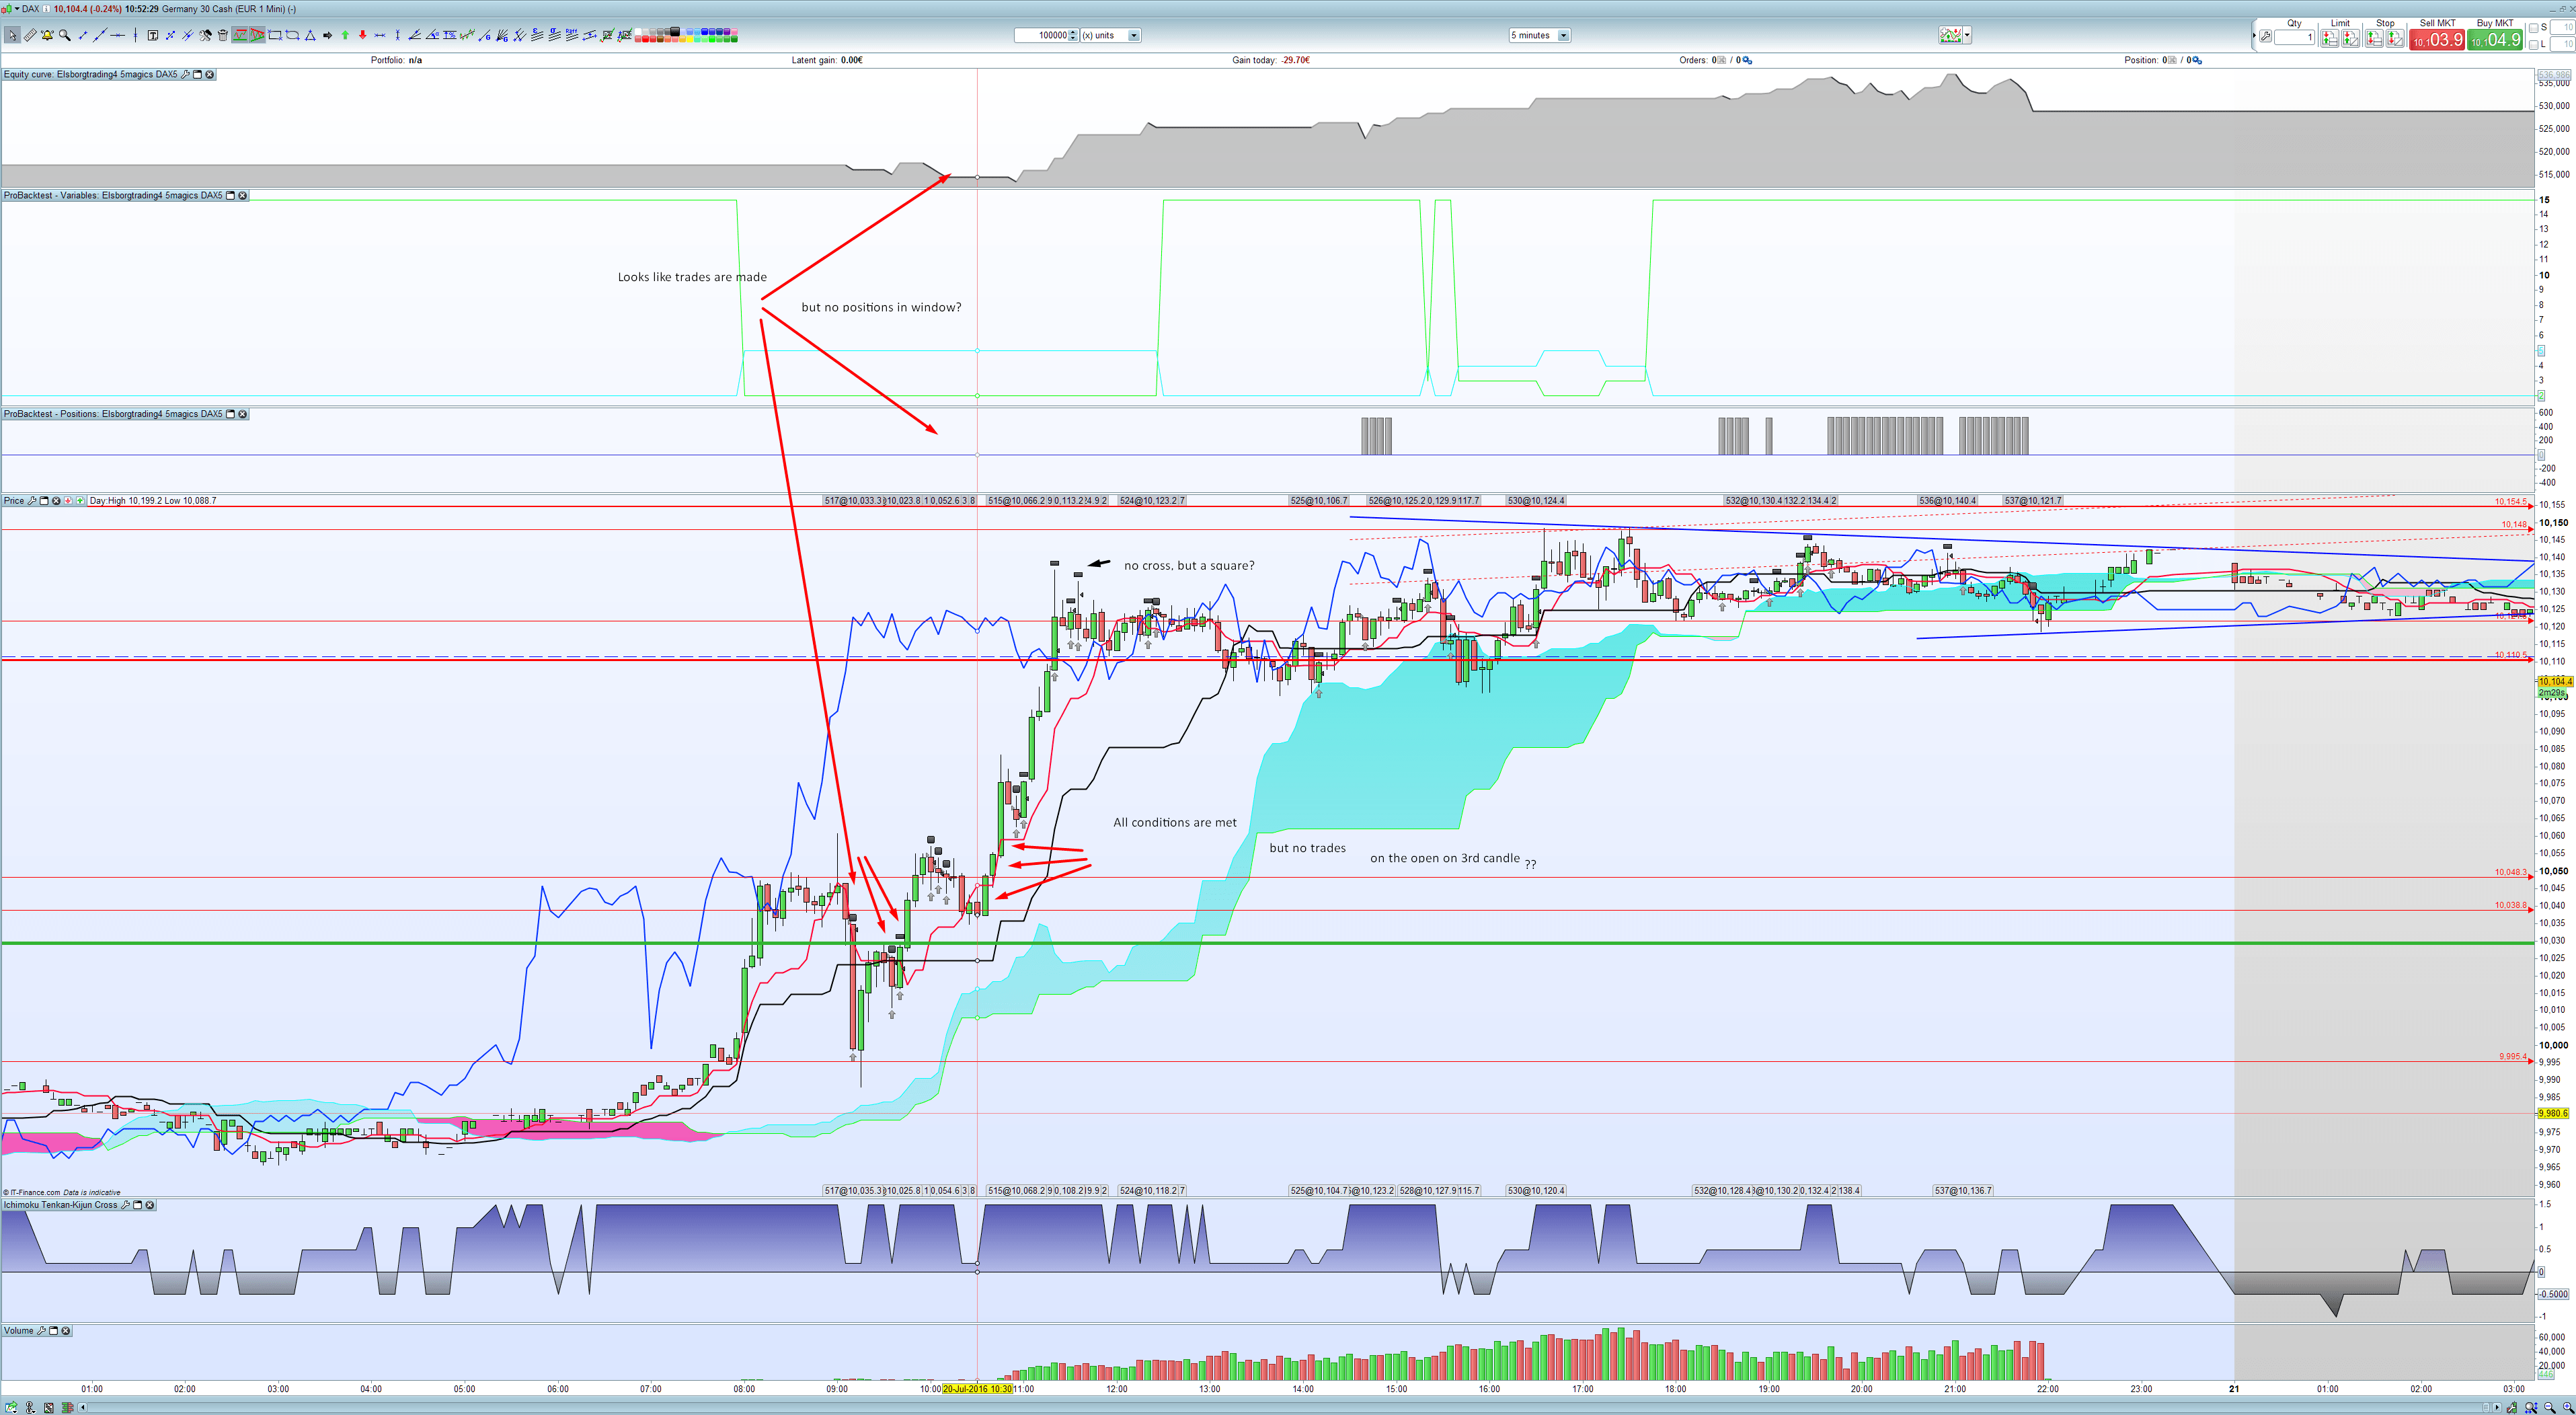
It’s my first code, so please bear that in mind as it’s properly not “beautiful” code, and I’m certain that someone could produce a more correct code (feel free :-)) anyway- the overall strategy works- trades are made above and below the cloud when the tenkansen/kijunsen and Chikou are above/below but the 2-3 candle test I don’t see is working as intended- and I can’t see why?
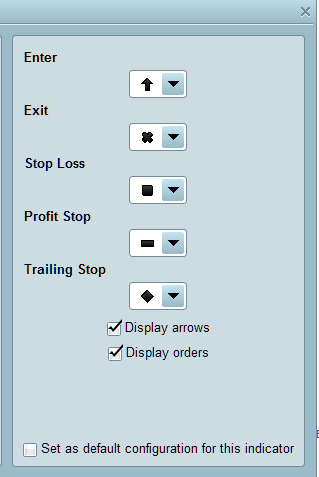
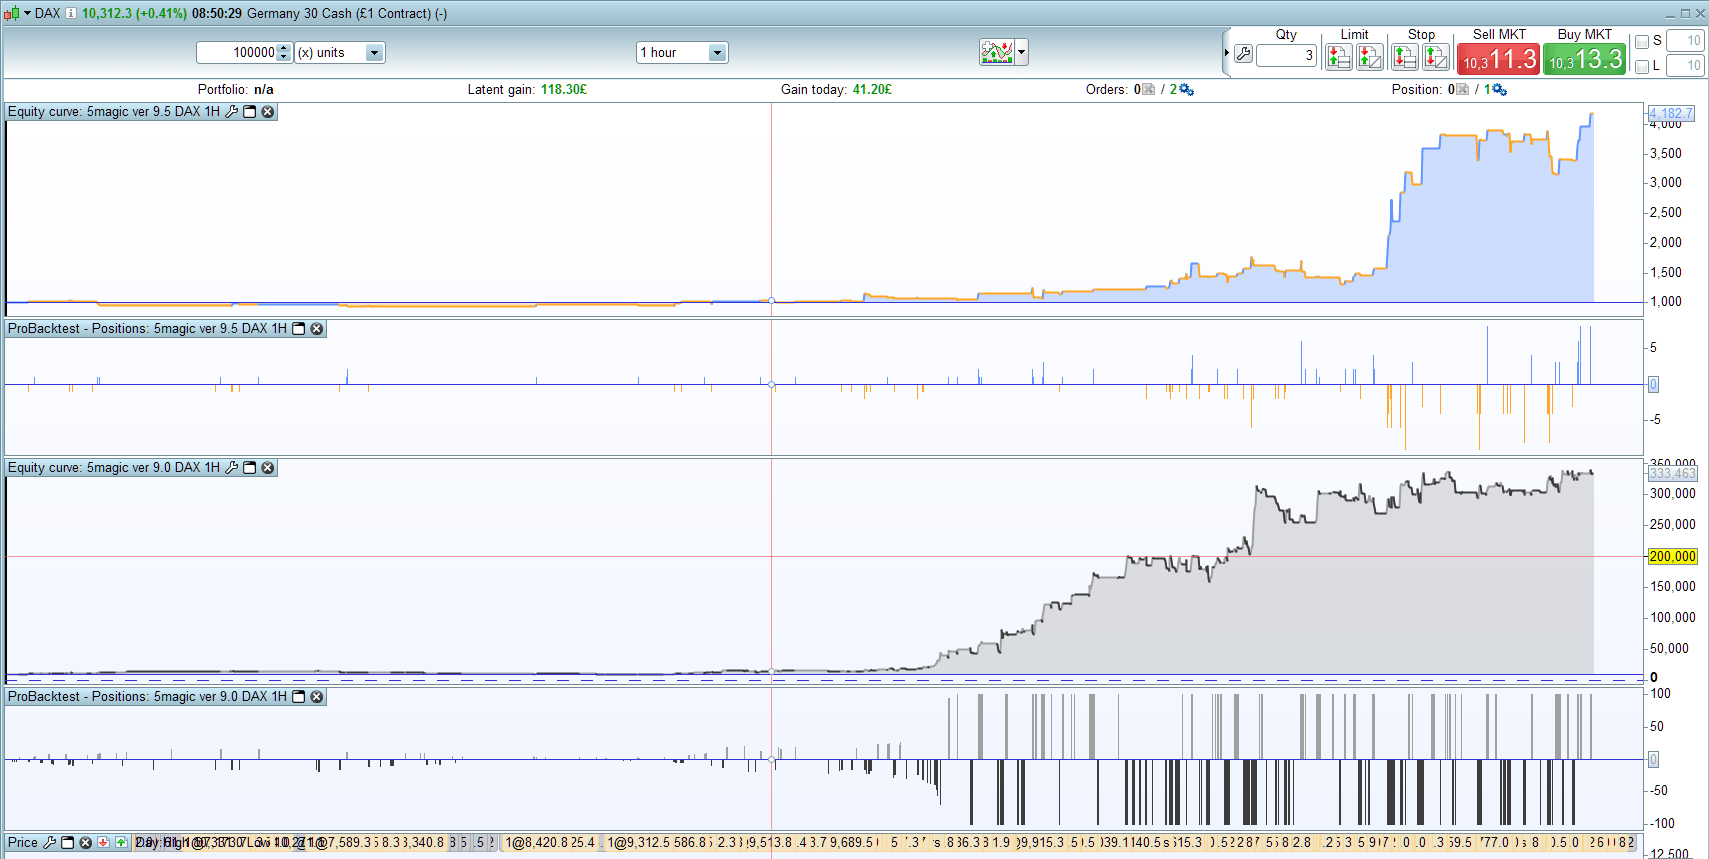
When back testing I can see an entry in the chart as an arrow, but not a cross when exiting, I see a square? When looking at some of all the strategy code here I see a cross when exiting?. Also sometimes the Positions window shows no bars, but it seems like the trade was made, both as an entry and an action on the equity curve. I will show a screen dump at this.
Anyway I know this was a long post and many questions, but I hope you can see the time to answer some of it 🙂
Cheers and happy summer days
Kasper Elsborg
//-------------------------------------------------------------------------
// Main code : Elsborgtrading 5magics DAX5min
//-------------------------------------------------------------------------
REM Elsborgtrading Ichimoku
defparam cumulateorders=false
defparam preloadbars=200
defparam preloadbars=2000
defparam flatbefore=090000
defparam flatafter=220000
//ONCE Crosslow=0
//ONCE Crosshigh=0
ONCE Tenkansen=0
ONCE Kijunsen=0
ONCE SenkouSpanA=0
ONCE SenkouSpanB=0
ONCE TreBarsAbove=0
ONCE TreBarsBelow=0
ONCE TenkansenBelow=0
ONCE KijunsenBelow=0
ONCE ChikouBelow=0
//REM Money Management
Capital = 1000
Risk = 0.01
StopLoss = 10 // Could be our variable X
// Calculate contracts
equity = Capital + StrategyProfit
maxrisk = round(equity*Risk)
PositionSize = abs(round((maxrisk/StopLoss)/PointValue)*pipsize)
//If PositionSize>100 then
//PositionSize=100
//endif
Tenkansen = (highest[9](high)+lowest[9](low))/2
Kijunsen = (highest[26](high)+lowest[26](low))/2
SenkouSpanA = (Tenkansen[26]+Kijunsen[26])/2
SenkouSpanB = (highest[52](high[26])+lowest[52](low[26]))/2
Chikou = close[26]
// buy
//TreBarsAbove = close[3] > SenkouSpanA and close[3] > SenkouSpanB and close[2] > SenkouSpanA and close[2] > SenkouSpanB and close > SenkouSpanA and close > SenkouSpanB and close[3]<Close[2] and Close[2]<Close //REM does not test for 3 bullish candle
//TreBarsAbove = close[3] > SenkouSpanA and close[3] > SenkouSpanB and close[2] > SenkouSpanA and close[2] > SenkouSpanB and close > SenkouSpanA and close > SenkouSpanB and close[3]<Close[2] and Close[2]<Close and open[3]<close[3] and open[2]<close[2] and open<close //REM test for 3 bullish candle
//TreBarsAbove = close[2] > SenkouSpanA and close[2] > SenkouSpanB and close > SenkouSpanA and close > SenkouSpanB and Close[2]<Close and open[2]<close[2] and open<close // REM test for only 2 bullish candles above
TreBarsAbove = close[3] > SenkouSpanA and close[3] > SenkouSpanB and close[2] > SenkouSpanA and close[2] > SenkouSpanB and open[1] > SenkouSpanA and open[1] > SenkouSpanB and close[3]<Close[2] and medianprice[2]<open[1] and open[3]<close[3] and open[2]<close[2] and open[1]>medianprice[2] // REM test med open candle3
//Crosshigh = Tenkansen crosses over Kijunsen: NOT USED
TenkansenAbove = Tenkansen > SenkouSpanA and Tenkansen > SenkouSpanB
KijusenAbove = Kijunsen > SenkouSpanA and Kijunsen > SenkouSpanB
ChikouAbove = Chikou > SenkouSpanA[26] and Chikou > SenkouSpanB[26]
IF TreBarsAbove and TenkansenAbove and KijusenAbove and ChikouAbove THEN
BUY PositionSize CONTRACTS AT MARKET
ENDIF
// Sell
//TreBarsBelow = close[3] < SenkouSpanA and close[3] < SenkouSpanB and close[2] < SenkouSpanA and close[2] < SenkouSpanB and close < SenkouSpanA and close < SenkouSpanB and close[3]>Close[2] and Close[2]>Close //REM does not test for 3 bearish candle
//TreBarsBelow = close[3] < SenkouSpanA and close[3] < SenkouSpanB and close[2] < SenkouSpanA and close[2] < SenkouSpanB and close[1] < SenkouSpanA and close[1] < SenkouSpanB and close[3]>Close[2] and Close[2]>Close[1] and open[3]>close[3] and open[2]>close[2] and open[1]>close[1] // REM test for 3 berish candle
//TreBarsBelow = close[2] < SenkouSpanA and close[2] < SenkouSpanB and close < SenkouSpanA and close < SenkouSpanB and Close[2]>Close and open[2]>close[2] and open>close // REM test for only 2 berish candles below
TreBarsBelow = close[3] < SenkouSpanA and close[3] < SenkouSpanB and close[2] < SenkouSpanA and close[2] < SenkouSpanB and open[1] < SenkouSpanA and open[1] < SenkouSpanB and close[3]>Close[2] and medianprice[2]>open[1] and open[3]>close[3] and open[2]>close[2] and open[1]<medianprice[2] // REM test med open candle3
//Crosslow = Tenkansen crosses under Kijunsen: NOT USED
TenkansenBelow = Tenkansen < SenkouSpanA and Tenkansen < SenkouSpanB
KijunsenBelow = Kijunsen < SenkouSpanA and Kijunsen < SenkouSpanB
ChikouBelow = Chikou < SenkouSpanA[26] and Chikou < SenkouSpanB[26]
IF TreBarsBelow and TenkansenBelow and KijunsenBelow and ChikouBelow THEN
SELLSHORT PositionSize CONTRACTS AT MARKET
ENDIF
// stop and profit
//Sl=ABS(highest[3](high)-lowest[3](Low))/2
candlesperiods=15
NoMumentum1 = 30
NoMumentum2 = 40
If ABS(highest[candlesperiods](high)-lowest[candlesperiods](low))< NoMumentum1 THEN
TP=2
SL=15
ELSIF ABS(highest[candlesperiods](high)-lowest[candlesperiods](low))< NoMumentum2 THEN
TP=4
SL=3
else
TP=5
SL=2
Endif
set stop ploss SL
set target pprofit TP
//Debugging
//GRAPH SenkouSpanB COLOURED(0,0,255) AS "Take Profit" //Blue
//GRAPH SenkouSpanA COLOURED(255,0,0) AS "Stop Loss" //Red
//GRAPH Chikou COLOURED(0,0,0) AS "chikou" //Black
GRAPH TP COLOURED(0,255,255) AS "TP" //Aqua
GRAPH SL COLOURED(0,255,0) AS "SL" //Lime
Hi Elsborg,
Read through your note, afraid I’m only a beginner, but in my limited experience the tester produces better profits with small stop losses. This is totally at odds with real trading and I agree with your interpretation. This looks a brilliant effort for a “newbie” I hope someone else can supply you with the expertise you require but sadly isn’t me.
Regards
Dymjohn
Hi Dymjohn, and thanks for taking your time to read my post and comment:-)
Yes I am a newbie, so something that seems like a problem could be straight ahead for some one else. I also thing it’s summer vacation time and people has someting better to do that sit here and read forums.
I did some more investigation, actually made some small indicators as well for debugging purpose, and it works quite well. I also fixed the 3 bars issue- so that was one down 🙂 here is the code and screendump of the backtesting.
//-------------------------------------------------------------------------
// Main code : 5magic3 newtest4
//-------------------------------------------------------------------------
defparam cumulateorders=false
defparam preloadbars=2000
defparam flatbefore=090000
defparam flatafter=220000
//ONCE Crosslow=0
//ONCE Crosshigh=0
ONCE Tenkansen=0
ONCE Kijunsen=0
ONCE SenkouSpanA=0
ONCE SenkouSpanB=0
//ONCE TreBarsAbove=0
//ONCE TreBarsBelow=0
ONCE TenkansenBelow=0
ONCE KijunsenBelow=0
ONCE ChikouBelow=0
ONCE Bullish0=0
ONCE Bullish1=0
//ONCE Bullish2=0
ONCE Bearish0= 0
ONCE Bearish1= 0
//ONCE Bearish2= 0
NoMomentum1=35
candlesperiods=15
//REM Money Management
Capital = 1000
Risk = 0.01
StopLoss = 10 // Could be our variable X
// Calculate contracts
equity = Capital + StrategyProfit
maxrisk = round(equity*Risk)
PositionSize = abs(round((maxrisk/StopLoss)/PointValue)*pipsize)
//If PositionSize>100 then
//PositionSize=100
//endif
//REM ICHIMOKU
Tenkansen = (highest[9](high)+lowest[9](low))/2
Kijunsen = (highest[26](high)+lowest[26](low))/2
SenkouSpanA = (Tenkansen[26]+Kijunsen[26])/2
SenkouSpanB = (highest[52](high[26])+lowest[52](low[26]))/2
Chikou = close[26]
// REM BUY
Bullish0 = close > SenkouSpanA and close > SenkouSpanB and open < close
Bullish1 = close [1]> SenkouSpanA and close[1] > SenkouSpanB and open[1] < close[1]
//Bullish2 = close[2] > SenkouSpanA and close[2] > SenkouSpanB and open[2] < close[2]
TenkansenAbove = Tenkansen > SenkouSpanA and Tenkansen > SenkouSpanB
KijusenAbove = Kijunsen > SenkouSpanA and Kijunsen > SenkouSpanB
ChikouAbove = Chikou > SenkouSpanA[26] and Chikou > SenkouSpanB[26]
If ABS(highest[candlesperiods](high)-lowest[candlesperiods](low))< NoMomentum1 THEN
condition=0
Else
condition=1
endif
IF condition and Bullish0 and Bullish1 and TenkansenAbove and KijusenAbove and ChikouAbove THEN
BUY PositionSize CONTRACTS AT MARKET
ENDIF
// REM SELL
Bearish0= close < SenkouSpanA and close < SenkouSpanB and close > open
Bearish1=close[1] < SenkouSpanA and close[1] < SenkouSpanB and close[1] > open[1]
//Bearish2= close[2] < SenkouSpanA and close[2] < SenkouSpanB and close[2] > open[2]
TenkansenBelow = Tenkansen < SenkouSpanA and Tenkansen < SenkouSpanB
KijunsenBelow = Kijunsen < SenkouSpanA and Kijunsen < SenkouSpanB
ChikouBelow = Chikou < SenkouSpanA[26] and Chikou < SenkouSpanB[26]
IF condition and TenkansenBelow and KijunsenBelow and ChikouBelow and Bearish0 and Bearish1 THEN
SELLSHORT PositionSize CONTRACTS AT MARKET
ENDIF
// REM stop and profit
//Sl=ABS(highest[3](high)-lowest[3](Low))/2
candlesperiods=15
TP=8
SL=6
set stop ploss SL
set target pprofit TP
//Debugging
//GRAPH SenkouSpanB COLOURED(0,0,255) AS "Take Profit" //Blue
//GRAPH SenkouSpanA COLOURED(255,0,0) AS "Stop Loss" //Red
//GRAPH Chikou COLOURED(0,0,0) AS "chikou" //Black
//GRAPH TP COLOURED(0,255,255) AS "TP" //Aqua
//GRAPH SL COLOURED(0,255,0) AS "SL" //Lime
//GRAPH TreBarsAbove COLOURED(0,255,255) AS "TreBarsAbove" //Aqua
//GRAPH TreBarsBelow COLOURED(255,0,0) AS "TreBarsBelow" //red
//GRAPH condition COLOURED(255,0,0) AS "condition" //red
I also changed the strategy a bit to not include low volatile periods. I think it is simply to risky as IG require minimum a 6 point SL
I sit here and also looking at the chart- I think there could defeatedly be some improvement for the strategy as well. My initially thoughts is to exit the marked when tenkansen line croses price from below on Long and from above on Short. Think I will work on that 🙂
strange, the attachment keeps reattach it self, when nothing is selected in the window?
Also there is still something with the bar test on short marked.
I thinkt it need to be change to
Bearish0= close < SenkouSpanA and close < SenkouSpanB and close < open
Bearish1=close[1] < SenkouSpanA and close[1] < SenkouSpanB and close[1] < open[1]
anyway enough for today, I will return when I have something more solid 🙂
Cheers
Kasper
Hi Again, in my quest for gold I found one answer myself:-D. It’s the one where I ask for the Icons in the trading window. well here it is- self explainable[attachment file=10842]
Hi Kasper
I just tested on one hour DAX and seems to provide good profits also thanks for finding the explanation for the symbols. Are you going to trade this in live mode yet?
Regards
John
Hi Kasper
Have tried in live mode and produces only losses because of unrealistic stops with much of the action on the entry bar. I tried using a more realistic stop on the DAX but in test this just takes any profit away. In the end I used your strategy with MFE (max favourable excursion) stop detailed in this web site as well as making entry 2 points above or below the signal bar. This produces only a very modest profit on test and with normal slippage is no better than break even. I must say, everything I’ve tested so far is unprofitable suggests ichimoku does not provide an edge like most other indicators and oscillators.
Regards
John
Hi John, I guess you are right. The backtest issue with SL has a significant drawback in live- I haven’t been able to produce something useful with this code other than experience. So it’s not entirely waisted, we just need a good strategy 🙂
So yet again thanks for your help John, much appreciated
Cheers
Kasper
***** new in 9.5
Accumolate orders =TRUE and also extra accomulation are made in trends
when Equity=600000 then quit
It looks like that most profit this year is within this timeframe.
But I still don’t like that within the last year it does not make any money overall- so I change the timeframe that for 2016 is profitable
defparam flatbefore=070000
defparam flatafter=120000
(But of cause the NoTradingAfter=17 will never be an issue)
*************
I also tried to play with traling stops, but with no luck or profit!!
//-------------------------------------------------------------------------
// Main code : 5magic3 newtest9.0
//-------------------------------------------------------------------------
defparam cumulateorders=false
defparam preloadbars=2000
defparam flatbefore=070000
defparam flatafter=230000
ONCE Tenkansen=0
ONCE Kijunsen=0
ONCE SenkouSpanA=0
ONCE SenkouSpanB=0
ONCE TenkansenBelow=0
ONCE KijunsenBelow=0
ONCE ChikouBelow=0
ONCE Bullish0=0
ONCE Bullish1=0
ONCE Bearish0= 0
ONCE Bearish1= 0
NoMomentum1=75
candlesperiods=2
//REM Money Management
Capital = 1000
Risk = 0.03
StopLoss = 10 // Could be our variable X
// Calculate contracts
equity = Capital + StrategyProfit
maxrisk = round(equity*Risk)
PositionSize = abs(round((maxrisk/StopLoss)/PointValue)*pipsize)
If PositionSize>100 then
PositionSize=100
endif
//REM ICHIMOKU DEFINITI
Tenkansen = (highest[9](high)+lowest[9](low))/2
Kijunsen = (highest[26](high)+lowest[26](low))/2
SenkouSpanA = (Tenkansen[26]+Kijunsen[26])/2
SenkouSpanB = (highest[52](high[26])+lowest[52](low[26]))/2
Chikou = close[26]
//**************************************
//************** REM LONG***************
//**************************************
// BULLISH/BEARISH CANDLE TEST AND CONDITION
Bullish0 = close > SenkouSpanA and close > SenkouSpanB and open < close
Bullish1 = close [1]> SenkouSpanA and close[1] > SenkouSpanB and open[1] < close[1]
Bearish0 = close < SenkouSpanA and close < SenkouSpanB and open > close
Bearish1 = close[1] < SenkouSpanA and close[1] < SenkouSpanB and open[1] > close[1]
//ICHIMOKU TEST AND LONG CONDITION
TenkansenAbove = Tenkansen > SenkouSpanA and Tenkansen > SenkouSpanB
KijunsenAbove = Kijunsen > SenkouSpanA and Kijunsen > SenkouSpanB
ChikouAbove = Chikou > SenkouSpanA[26] and Chikou > SenkouSpanB[26]
//VOLITALE TEST AND CONDITION
If ABS(highest[candlesperiods](high)-lowest[candlesperiods](low))< NoMomentum1 THEN
condition=0
Else
condition=1
endif
//ENTER/EXIT LONG MARKET TEST
IF condition and Bullish0 and Bullish1 and TenkansenAbove and KijunsenAbove and ChikouAbove THEN
BUY PositionSize CONTRACTS AT MARKET
if low crosses under kijunsen then
sell AT MARKET
endif
ENDIF
//**************************************
//************** REM SHORT**************
//**************************************
//ICHIMOKU TEST AND SHORT CONDITION
TenkansenBelow = Tenkansen < SenkouSpanA and Tenkansen < SenkouSpanB
KijunsenBelow = Kijunsen < SenkouSpanA and Kijunsen < SenkouSpanB
ChikouBelow = Chikou < SenkouSpanA[26] and Chikou < SenkouSpanB[26]
//ENTER/EXIT SHORT MARKET TEST
IF condition and Bearish0 and Bearish1 and TenkansenBelow and KijunsenBelow and ChikouBelow THEN
SELLSHORT PositionSize CONTRACTS AT MARKET
if high crosses over kijunsen then
EXITSHORT AT MARKET
endif
ENDIF
// REM stop and profit
SL=109
set stop ploss SL
//Debugging
//GRAPH SenkouSpanB COLOURED(0,0,255) AS "Take Profit" //Blue
//GRAPH SenkouSpanA COLOURED(255,0,0) AS "Stop Loss" //Red
//GRAPH Chikou COLOURED(0,0,0) AS "chikou" //Black
//GRAPH TP COLOURED(0,255,255) AS "TP" //Aqua
//GRAPH SL COLOURED(0,255,0) AS "SL" //Lime
//GRAPH xxx COLOURED(0,255,255) AS "TreBarsAbove" //Aqua
//GRAPH xxx COLOURED(255,0,0) AS "TreBarsBelow" //red
//GRAPH condition COLOURED(255,0,0) AS "condition" //red
****************
//————————————————————————- // Main code : 5magic3 newtest9.5 //————————————————————————- defparam cumulateorders=TRUE defparam preloadbars=2000 defparam flatbefore=070000 defparam flatafter=120000 ONCE Tenkansen=0 ONCE Kijunsen=0 ONCE SenkouSpanA=0 ONCE SenkouSpanB=0 ONCE TenkansenBelow=0 ONCE KijunsenBelow=0 ONCE ChikouBelow=0 ONCE Bullish0=0 ONCE Bullish1=0 ONCE Bearish0= 0 ONCE Bearish1= 0 //Trading Variables NoMomentum1=75 candlesperiods=2 NoTradingAfter=17 //REM Money Management Capital = 1000 Risk = 0.03 StopLoss = 10 // Could be our variable X // Calculate contracts equity = Capital + StrategyProfit maxrisk = round(equity*Risk) PositionSize = abs(round((maxrisk/StopLoss)/PointValue)*pipsize) If PositionSize>100 then PositionSize=100 endif //REM ICHIMOKU DEFINITION Tenkansen = (highest[9](high)+lowest[9](low))/2 Kijunsen = (highest[26](high)+lowest[26](low))/2 SenkouSpanA = (Tenkansen[26]+Kijunsen[26])/2 SenkouSpanB = (highest[52](high[26])+lowest[52](low[26]))/2 Chikou = close[26] //************************************** //************** REM LONG*************** //************************************** // BULLISH/BEARISH CANDLE TEST AND CONDITION Bullish0 = close > SenkouSpanA and close > SenkouSpanB and open < close Bullish1 = close [1]> SenkouSpanA and close[1] > SenkouSpanB and open[1] < close[1] Bearish0 = close < SenkouSpanA and close < SenkouSpanB and open > close Bearish1 = close[1] < SenkouSpanA and close[1] < SenkouSpanB and open[1] > close[1] //ICHIMOKU TEST AND LONG CONDITION TenkansenAbove = Tenkansen > SenkouSpanA and Tenkansen > SenkouSpanB KijunsenAbove = Kijunsen > SenkouSpanA and Kijunsen > SenkouSpanB ChikouAbove = Chikou > SenkouSpanA[26] and Chikou > SenkouSpanB[26] //VOLITALE TEST AND CONDITION If ABS(highest[candlesperiods](high)-lowest[candlesperiods](low))< NoMomentum1 THEN condition=0 Else condition=1 endif //ENTER/EXIT LONG MARKET TEST IF condition and Bullish0 and Bullish1 and TenkansenAbove and KijunsenAbove and ChikouAbove THEN //IF condition and Bullish0 and Bullish1 and TenkansenAbove and KijunsenAbove THEN BUY PositionSize CONTRACTS AT MARKET if low crosses under kijunsen then sell AT MARKET ENDIF ENDIF //Adding extra position if in good trend IF CurrentHour < NoTradingAfter and BARINDEX-TRADEINDEX(1)>1 AND Close-TRADEPRICE(1)>10 AND LongOnMarket then// AND condition and Bullish0 and Bullish1 and TenkansenAbove and KijunsenAbove then// and ChikouAbove THEN Buy PositionSize CONTRACTS AT MARKET if low crosses under kijunsen then sell AT MARKET ENDIF ENDIF //************************************** //************** REM SHORT************** //************************************** //ICHIMOKU TEST AND SHORT CONDITION TenkansenBelow = Tenkansen < SenkouSpanA and Tenkansen < SenkouSpanB KijunsenBelow = Kijunsen < SenkouSpanA and Kijunsen < SenkouSpanB ChikouBelow = Chikou < SenkouSpanA[26] and Chikou < SenkouSpanB[26] //ENTER/EXIT SHORT MARKET TEST IF condition and Bearish0 and Bearish1 and TenkansenBelow and KijunsenBelow and ChikouBelow THEN SELLSHORT PositionSize CONTRACTS AT MARKET if high crosses over kijunsen then EXITSHORT AT MARKET endif ENDIF //Adding extra position if in good trend IF CurrentHour < NoTradingAfter and BARINDEX-TRADEINDEX(1)>1 AND TRADEPRICE(1)-Close>20 AND ShortOnMarket then // AND condition and Bearish0 and Bearish1 and TenkansenBelow and KijunsenBelow and ChikouBelow THEN SELLSHORT PositionSize CONTRACTS AT MARKET if low crosses under kijunsen then sell AT MARKET ENDIF ENDIF // REM stop and profit StopLoss=109 set stop ploss StopLoss IF equity>50000 THEN QUIT ENDIF //Debugging //GRAPH SenkouSpanB COLOURED(0,0,255) AS “Take Profit” //Blue //GRAPH SenkouSpanA COLOURED(255,0,0) AS “Stop Loss” //Red //GRAPH Chikou COLOURED(0,0,0) AS “chikou” //Black //GRAPH TP COLOURED(0,255,255) AS “TP” //Aqua //GRAPH SL COLOURED(0,255,0) AS “SL” //Lime //GRAPH xxx COLOURED(0,255,255) AS “TreBarsAbove” //Aqua //GRAPH xxx COLOURED(255,0,0) AS “TreBarsBelow” //red //GRAPH condition COLOURED(255,0,0) AS “condition” //red //GRAPH Indicator COLOURED(255,0,0) AS “Longentry” //red //GRAPH LongEntry COLOURED(255,0,0) AS “Longentry” //red //Graph ind COLOURED(255,0,0) AS “condition” //redAnd something with the
//Volitale test
If ABS(highest[candlesperiods](high)-lowest[candlesperiods](low))< NoMomentum1 THEN
condition=0
Else
condition=1
endif
If it not in the code will not generate Any Money??? That’s is very strange and just a coincident derived from an idea
My first code and strategy
This topic contains 18 replies,
has 2 voices, and was last updated by Elsborgtrading
9 years, 6 months ago.
| Forum: | ProOrder: Automated Strategies & Backtesting |
| Language: | English |
| Started: | 07/21/2016 |
| Status: | Active |
| Attachments: | No files |
The information collected on this form is stored in a computer file by ProRealCode to create and access your ProRealCode profile. This data is kept in a secure database for the duration of the member's membership. They will be kept as long as you use our services and will be automatically deleted after 3 years of inactivity. Your personal data is used to create your private profile on ProRealCode. This data is maintained by SAS ProRealCode, 407 rue Freycinet, 59151 Arleux, France. If you subscribe to our newsletters, your email address is provided to our service provider "MailChimp" located in the United States, with whom we have signed a confidentiality agreement. This company is also compliant with the EU/Swiss Privacy Shield, and the GDPR. For any request for correction or deletion concerning your data, you can directly contact the ProRealCode team by email at privacy@prorealcode.com If you would like to lodge a complaint regarding the use of your personal data, you can contact your data protection supervisory authority.