Hi there. I’d like some help with getting the code/s for setting up stochastic crossover across 3 timeframes so I can get a signal/alert whenever my chosen timeframes are in the same direction.
Thanks.
KR.
MrMagic
Welcome to the ProRealCode forums. I have moved your post to the ProBuilder support forum as your question is more related to that than the PRT Platform Support forum where you first posted it.
Please try to post any future topics in the correct forum 🙂
ProBuilder does not support multi time frame, but ProScreener does. Unfortunately you can’t set alerts on it, you’ll have to check the charts it yourself once in a while.
If you are interested in a screener, then post details (timeframes and settings).
Thanks robertogozzi for the swift reply. I am interested in a screener and I mainly scan through the weekly, daily and 4hourly/6 hourly time frames and daily, 4hourly and hourly time frames using the default stoachstic settings, 14, 3, 5. Any help will be appreciated.
This is the code, it simply detects when Stochastic is going north or south in all TFs, returning 1 or -1.
You could also add detection of OB/OS areas, other indicators and other TFs.
TIMEFRAME(weekly)
StocK1  = Stochastic[14,3](close)                  //14, 3
StocD1  = Average[5](StocK1)                       //5
WeekDN  = StocK1 < StocD1 AND StocK1 < StocK1[1]   //K < D (southbound)
WeekUP  = StocK1 > StocD1 AND StocK1 > StocK1[1]   //K > D (northbound)

TIMEFRAME(daily)
StocK2  = Stochastic[14,3](close)          //14, 3
StocD2  = Average[5](StocK2)               //5
DailyDN = StocK2 < StocD2 AND StocK2 < StocK2[1]   //K < D (southbound)
DailyUP = StocK2 > StocD2 AND StocK2 > StocK2[1]   //K > D (northbound)

TIMEFRAME(4 hours)
StocK3  = Stochastic[14,3](close)          //14, 3
StocD3  = Average[5](StocK3)               //5
HourDN  = StocK3 < StocD3 AND StocK3 < StocK3[1]   //K < D (southbound)
HourUP  = StocK3 > StocD3 AND StocK3 > StocK3[1]   //K > D (northbound)

Dn = WeekDN AND DailyDN AND HourDN
Up = WeekUP AND DailyUP AND HourUP

ReturnValue = 0
IF Dn THEN
   ReturnValue = -1
ELSIF Up THEN
   ReturnValue = 1
ENDIF

SCREENER[ReturnValue] (ReturnValue AS "1=Up / -1=Dn")
Thanks a lot. I’ll try this.
Silly question; I’m a novice in coding but the last part of your code titled TIMEFRAME(4 hours) had
HourDN  = StocK3 < StocD3 AND StocK3 < StocK3[1]   //K < D (southbound)
HourUP  = StocK3 > StocD3 AND StocK3 > StocK3[1]   //K > D (northbound)
Will that be for the 4 hour chart or just the Hour chart? I asked because my TFs of interest are either Weekly/Daily/4hours or Daily/4hours/1hour.
KR,
MM
Robertogozzi appears to be offline at the moment so I will answer for him. I’m not big on screeners but I think the answer to your question is that the HOURDN and HOURUP are just variable names (they could be DN1 and UP1 or anything you wish) The important bit is the:
TIMEFRAME (4 Hours)
Just change these TIMEFRAME lines to the time frame of your choice:
TIMEFRAME (1 Hour)
Please try to use the ‘Insert PRT Code’ button when putting code in your posts. I have tidied up your last post for you. 🙂
Also now that it has turned out that your question was a screener question I will move the whole topic to the ProScreener Support forum where others interested in screeners might find it of use.
Thanks for the reply. I’ve tested the code and it’s returned some good results, however for some of the instruments, stochastic hadn’t crossed over but it highlighted them as crossedover.
I did know exactly what you wanted the stochastic to be when returning data, so I simply highlighted when K was just ABOVE or BELOW D.
If you need to be returned a crossing tell me exactly what you need to scan,
just any crossing on which TF of the three? Or maybe a crossing while still inside OB/OS areas?
I just ran a couple of checks and it does list instruments that do not meet the criteria. I changed it to CROSSED UNDER and CROSSED OVER and it reduced the list to just two but the one I checked also did not meet the criteria.
So I checked that:
StocK1  = Stochastic[14,3](close)
StocD1  = Average[5](StocK1)
gave an identical indicator to the standard stochastic and it does.
Strange….. but as I say I am not big on Screeners.
It appears to be working correctly on ALL instruments available with IG.
When MrMagic posts his requirements I’ll change the coding accordingly.
Thanks for all help gents. Maybe I wasn’t clear in my request. I shall try and be detailed, apologies.
You know what I’m about to explain but let me in my amateur state explain.
For example, let’s say I want to analyse EURUSD.
I scan through the weekly chart to evaluating the candlestick pattern and the direction of stochastic after its crossover.
I then go down to the daily chart and wait for stoch crossover in the direction of the weekly chart, if it’s not in that direction already. Once both are in the same direction, completely crossover over, I look at the 4 hour chart’s stochastic and once it’s in the direction of the other 2 higher timeframes (amongst other criteria), I may take my trade at the end of the candlestick
So all three have to have crossover completely before I consider a trade.
I hope it’s clear.
Cheers for helping guys.
Bless.
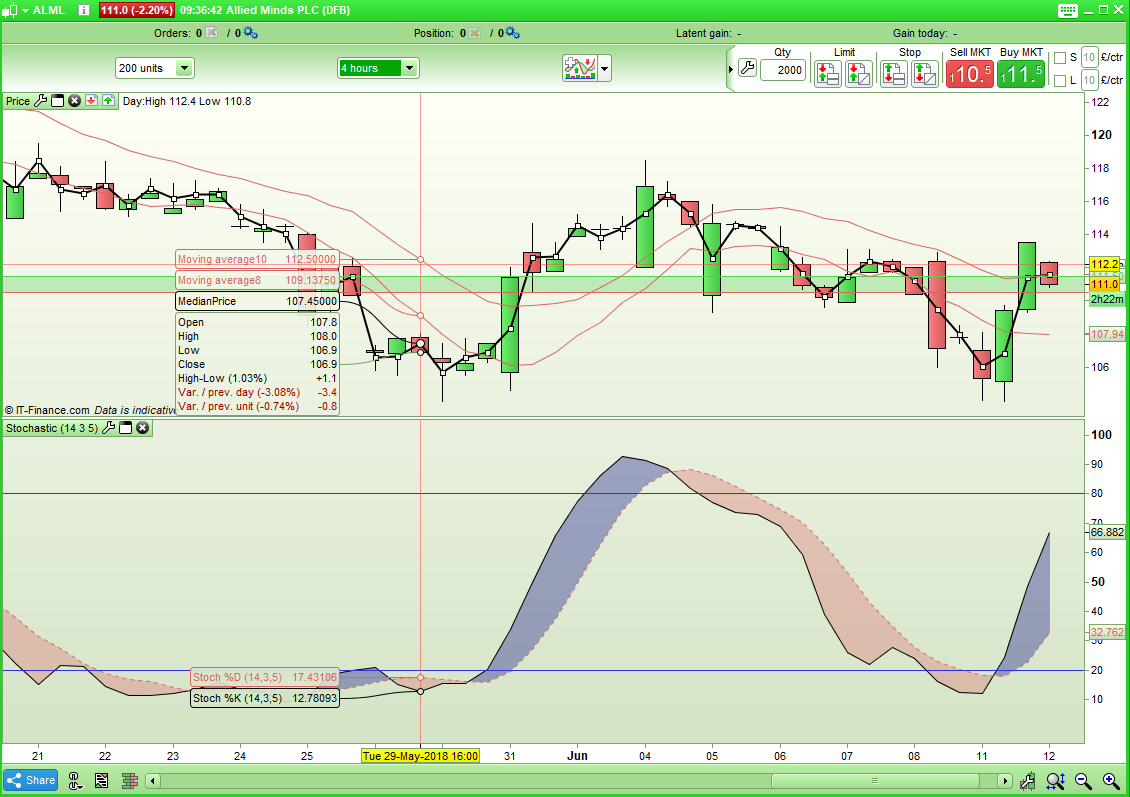
I think maybe an example would be helpful.
Here is one that comes up in the screener:
[attachment file=72966]
I don’t see how this can meet the criteria in the screener.
What I coded is perfect, since there’s no need to scan a CROSSOVER to be currently forming.
All other instances manifest themselves AFTER a crossover has occurred, no matter when, so you just need to look if all K’s are > or < all D’s.
Unless you want to timeout some signals, say there’s a bullish crossover on the weekly chart and you may want the stochastic on the daily chart to go the same direction within “n” bars or wait for the next crossing to occur on the weekly chart.