MULTIPLE DIVERGENCES INDICATOR ON TW

Viewing 3 posts - 1 through 3 (of 3 total)
  • Author
    Posts
  • #261740 quote
    brian gilbert
    Participant
    Average
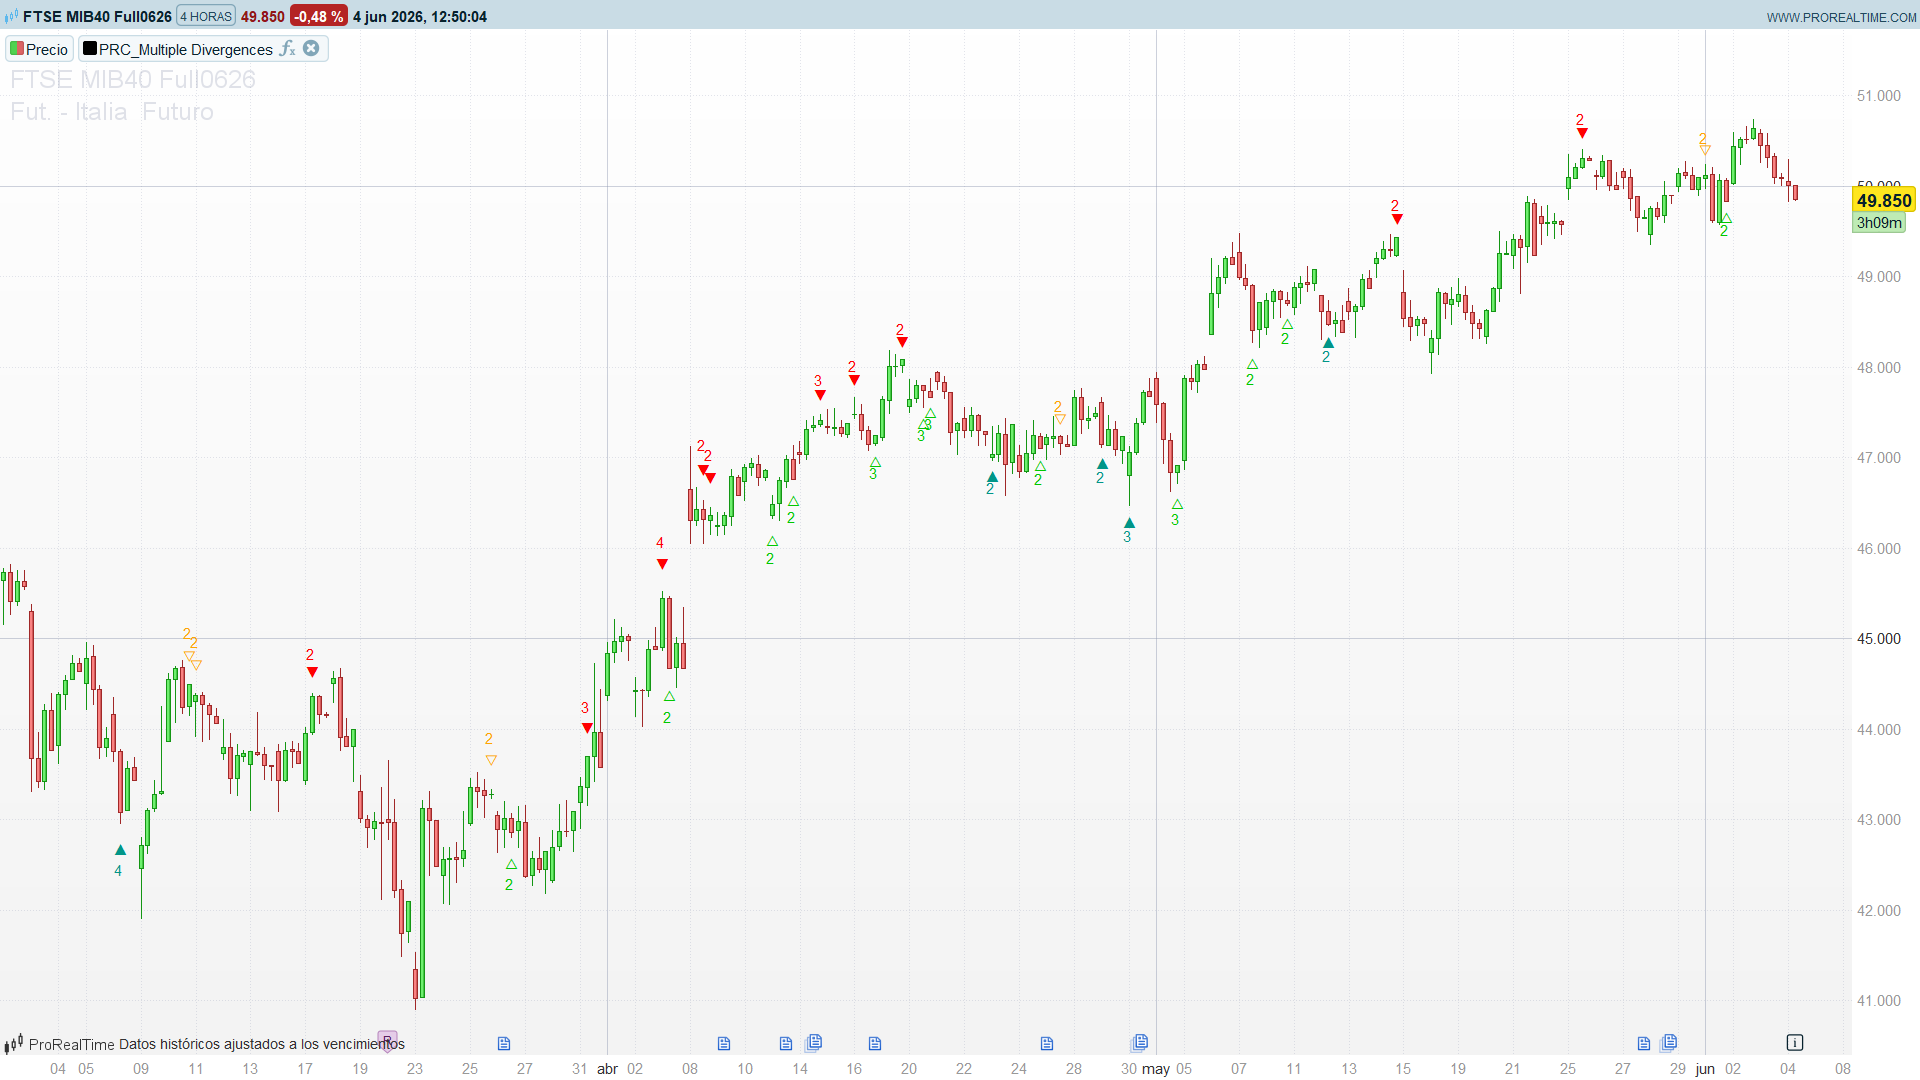
    Hello everyone, as usual, I'm here because I found another interesting indicator on TW, and I'd like to use it on Prorealtime, if possible. Below is both the link to the page and the source code for translation. Thanks everyone!
    

    https://www.tradingview.com/script/LXz2NC1b-Multiple-divergences-NON-REPAINT-by-PeterO/

    SOURCE CODE:

    ————————————————————————————————————————————————————————————

    // This source code is subject to the terms of the Mozilla Public License 2.0 at https://mozilla.org/MPL/2.0/

    // © Peter_O

    // + huge parts of code by Lonesometheblue and Everget’s built-in divergence indicator


    //@version=4

    study(“Multiple divergences rework NON-REPAINT by PeterO”, overlay=true)


    offset=input(false, “Repaint or not?”)

    mindivcount=input(2, minval=1, maxval=10, title=”Minimum Div Count to Display”)


    lbR = input(title=”Pivot Lookback Right”, defval=1)

    lbL = input(title=”Pivot Lookback Left”, defval=3)

    off = offset ? lbR : 0

    rangeUpper = input(title=”Max of Lookback Range”, defval=60)

    rangeLower = input(title=”Min of Lookback Range”, defval=1)

    plotBull = input(title=”Plot Bullish”, defval=true)

    plotHiddenBull = input(title=”Plot Hidden Bullish”, defval=true)

    plotBear = input(title=”Plot Bearish”, defval=true)

    plotHiddenBear = input(title=”Plot Hidden Bearish”, defval=true)


    // Indicators

    calcmacd = input(true, title=”MACD”)

    calcmacda = input(true, title=”MACD Histogram”)

    calcrsi = input(true, title=”RSI”)

    calcstoc = input(true, title=”Stochastic”)

    calccci = input(true, title=”CCI”)

    calcmom = input(true, title=”Momentum”)

    calcobv = input(true, title=”OBV”)

    calcdi = input(true, title=”Diosc”)

    calcvwmacd = input(true, title=”VWmacd”)

    calccmf = input(true, title=”Chaikin Money Flow”)


    // RSI

    rsi = rsi(close, 14)

    // MACD

    [macd, signal, deltamacd] = macd(close, 12, 26, 9)

    // Momentum

    moment = mom(close, 10)

    // CCI

    cci = cci(close, 10)

    // OBV

    obv = cum(change(close) > 0 ? volume : change(close) < 0 ? -volume : 0 * volume)

    // Stoch

    stk = sma(stoch(close, high, low, 14), 3)

    // DIOSC

    DI = change(high) – (-change(low))

    trur = rma(tr, 14)

    diosc = fixnan(100 * rma(DI, 14) / trur)

    // volume weighted macd

    maFast = vwma(close, 12)

    maSlow = vwma(close, 26)

    vwmacd = maFast – maSlow

    // Chaikin money flow

    Cmfm = ((close-low) – (high-close)) / (high – low)

    Cmfv = Cmfm * volume

    cmf = sma(Cmfv, 21) / sma(volume,21)


    plFound(_osc) => not na(pivotlow(_osc, lbL, lbR))

    phFound(_osc) => not na(pivothigh(_osc, lbL, lbR))


    _inRange(cond) =>

      bars = barssince(cond == true)

      rangeLower <= bars and bars <= rangeUpper


    // Regular Bullish

    oscHL(_osc) => _osc[lbR] > valuewhen(plFound(_osc), _osc[lbR], 1) and _inRange(plFound(_osc)[1]) // Higher Low on indicator

    priceLL(_osc) => low[lbR] < valuewhen(plFound(_osc), low[lbR], 1) // Lower Low on Price

    bullCond(_osc) => plotBull and priceLL(_osc) and oscHL(_osc) and plFound(_osc)


    // Regular Bearish

    oscLH(_osc) => _osc[lbR] < valuewhen(phFound(_osc), _osc[lbR], 1) and _inRange(phFound(_osc)[1]) // Lower High on indicator

    priceHH(_osc) => high[lbR] > valuewhen(phFound(_osc), high[lbR], 1) // Higher High on Price

    bearCond(_osc) => plotBear and priceHH(_osc) and oscLH(_osc) and phFound(_osc)


    // Hidden Bullish

    oscLL(_osc) => _osc[lbR] < valuewhen(plFound(_osc), _osc[lbR], 1) and _inRange(plFound(_osc)[1]) // Lower Low on indicator

    priceHL(_osc) => low[lbR] > valuewhen(plFound(_osc), low[lbR], 1) // Higher Low on Price

    hiddenBullCond(_osc) => plotHiddenBull and priceHL(_osc) and oscLL(_osc) and plFound(_osc)


    // Hidden Bearish

    oscHH(_osc) => _osc[lbR] > valuewhen(phFound(_osc), _osc[lbR], 1) and _inRange(phFound(_osc)[1]) // Higher High on indicator

    priceLH(_osc) => high[lbR] < valuewhen(phFound(_osc), high[lbR], 1) // Lower High on Price

    hiddenBearCond(_osc) => plotHiddenBear and priceLH(_osc) and oscHH(_osc) and phFound(_osc)


    negdivergence = 0

    if calcrsi and bearCond(rsi)

      negdivergence := 1

    if calcmacd and bearCond(macd)

      negdivergence := negdivergence + 1

    if calcmacda and bearCond(deltamacd)

      negdivergence := negdivergence + 1

    if calcmom and bearCond(moment)

      negdivergence := negdivergence + 1

    if calccci and bearCond(cci)

      negdivergence := negdivergence + 1

    if calcobv and bearCond(obv)

      negdivergence := negdivergence + 1

    if calcstoc and bearCond(stk)

      negdivergence := negdivergence + 1

    if calcdi and bearCond(diosc)

      negdivergence := negdivergence + 1

    if calcvwmacd and bearCond(vwmacd)

      negdivergence := negdivergence + 1

    if calccmf and bearCond(cmf)

      negdivergence := negdivergence + 1


    posdivergence = 0

    if calcrsi and bullCond(rsi)

      posdivergence := 1

    if calcmacd and bullCond(macd)

      posdivergence := posdivergence + 1

    if calcmacda and bullCond(deltamacd)

      posdivergence := posdivergence + 1

    if calcmom and bullCond(moment)

      posdivergence := posdivergence + 1

    if calccci and bullCond(cci)

      posdivergence := posdivergence + 1

    if calcobv and bullCond(obv)

      posdivergence := posdivergence + 1

    if calcstoc and bullCond(stk)

      posdivergence := posdivergence + 1

    if calcdi and bullCond(diosc)

      posdivergence := posdivergence + 1

    if calcvwmacd and bullCond(vwmacd)

      posdivergence := posdivergence + 1

    if calccmf and bullCond(cmf)

      posdivergence := posdivergence + 1


    negdivergencehidden = 0

    if calcrsi and hiddenBearCond(rsi)

      negdivergencehidden := 1

    if calcmacd and hiddenBearCond(macd)

      negdivergencehidden := negdivergencehidden + 1

    if calcmacda and hiddenBearCond(deltamacd)

      negdivergencehidden := negdivergencehidden + 1

    if calcmom and hiddenBearCond(moment)

      negdivergencehidden := negdivergencehidden + 1

    if calccci and hiddenBearCond(cci)

      negdivergencehidden := negdivergencehidden + 1

    if calcobv and hiddenBearCond(obv)

      negdivergencehidden := negdivergencehidden + 1

    if calcstoc and hiddenBearCond(stk)

      negdivergencehidden := negdivergencehidden + 1

    if calcdi and hiddenBearCond(diosc)

      negdivergencehidden := negdivergencehidden + 1

    if calcvwmacd and hiddenBearCond(vwmacd)

      negdivergencehidden := negdivergencehidden + 1

    if calccmf and hiddenBearCond(cmf)

      negdivergencehidden := negdivergencehidden + 1


    posdivergencehidden = 0

    if calcrsi and hiddenBullCond(rsi)

      posdivergencehidden := 1

    if calcmacd and hiddenBullCond(macd)

      posdivergencehidden := posdivergencehidden + 1

    if calcmacda and hiddenBullCond(deltamacd)

      posdivergencehidden := posdivergencehidden + 1

    if calcmom and hiddenBullCond(moment)

      posdivergencehidden := posdivergencehidden + 1

    if calccci and hiddenBullCond(cci)

      posdivergencehidden := posdivergencehidden + 1

    if calcobv and hiddenBullCond(obv)

      posdivergencehidden := posdivergencehidden + 1

    if calcstoc and hiddenBullCond(stk)

      posdivergencehidden := posdivergencehidden + 1

    if calcdi and hiddenBullCond(diosc)

      posdivergencehidden := posdivergencehidden + 1

    if calcvwmacd and hiddenBullCond(vwmacd)

      posdivergencehidden := posdivergencehidden + 1

    if calccmf and hiddenBullCond(cmf)

      posdivergencehidden := posdivergencehidden + 1


    voffset=5*syminfo.mintick


    plotshape(posdivergence==1 and mindivcount<2 ? low[lbR] – voffset : na, offset=-off, title=”1 Regular Bullish Div found”, text=”1″, style=shape.labelup, location=location.absolute, color=color.teal, textcolor=color.white, transp=0)

    plotshape(posdivergence==2 and mindivcount<3 ? low[lbR] – voffset : na, offset=-off, title=”2 Regular Bullish Divs found”, text=”2″, style=shape.labelup, location=location.absolute, color=color.teal, textcolor=color.white, transp=0)

    plotshape(posdivergence==3 and mindivcount<4 ? low[lbR] – voffset : na, offset=-off, title=”3 Regular Bullish Divs found”, text=”3″, style=shape.labelup, location=location.absolute, color=color.teal, textcolor=color.white, transp=0)

    plotshape(posdivergence==4 and mindivcount<5 ? low[lbR] – voffset : na, offset=-off, title=”4 Regular Bullish Divs found”, text=”4″, style=shape.labelup, location=location.absolute, color=color.teal, textcolor=color.white, transp=0)

    plotshape(posdivergence==5 and mindivcount<6 ? low[lbR] – voffset : na, offset=-off, title=”5 Regular Bullish Divs found”, text=”5″, style=shape.labelup, location=location.absolute, color=color.teal, textcolor=color.white, transp=0)

    plotshape(posdivergence==6 and mindivcount<7 ? low[lbR] – voffset : na, offset=-off, title=”6 Regular Bullish Divs found”, text=”6″, style=shape.labelup, location=location.absolute, color=color.teal, textcolor=color.white, transp=0)

    plotshape(posdivergence==7 and mindivcount<8 ? low[lbR] – voffset : na, offset=-off, title=”7 Regular Bullish Divs found”, text=”7″, style=shape.labelup, location=location.absolute, color=color.teal, textcolor=color.white, transp=0)

    plotshape(posdivergence==8 and mindivcount<9 ? low[lbR] – voffset : na, offset=-off, title=”8 Regular Bullish Divs found”, text=”8″, style=shape.labelup, location=location.absolute, color=color.teal, textcolor=color.white, transp=0)

    plotshape(posdivergence>8 and mindivcount<11 ? low[lbR] – voffset : na, offset=-off, title=”8+ Regular Bullish Divs found”, text=”8+”, style=shape.labelup, location=location.absolute, color=color.teal, textcolor=color.white, transp=0)


    plotshape(negdivergence==1 and mindivcount<2 ? high[lbR] + voffset : na, offset=-off, title=”1 Regular Bearish Div found”, text=”1″, style=shape.labeldown, location=location.absolute, color=color.red, textcolor=color.white, transp=0)

    plotshape(negdivergence==2 and mindivcount<3 ? high[lbR] + voffset : na, offset=-off, title=”2 Regular Bearish Divs found”, text=”2″, style=shape.labeldown, location=location.absolute, color=color.red, textcolor=color.white, transp=0)

    plotshape(negdivergence==3 and mindivcount<4 ? high[lbR] + voffset : na, offset=-off, title=”3 Regular Bearish Divs found”, text=”3″, style=shape.labeldown, location=location.absolute, color=color.red, textcolor=color.white, transp=0)

    plotshape(negdivergence==4 and mindivcount<5 ? high[lbR] + voffset : na, offset=-off, title=”4 Regular Bearish Divs found”, text=”4″, style=shape.labeldown, location=location.absolute, color=color.red, textcolor=color.white, transp=0)

    plotshape(negdivergence==5 and mindivcount<6 ? high[lbR] + voffset : na, offset=-off, title=”5 Regular Bearish Divs found”, text=”5″, style=shape.labeldown, location=location.absolute, color=color.red, textcolor=color.white, transp=0)

    plotshape(negdivergence==6 and mindivcount<7 ? high[lbR] + voffset : na, offset=-off, title=”6 Regular Bearish Divs found”, text=”6″, style=shape.labeldown, location=location.absolute, color=color.red, textcolor=color.white, transp=0)

    plotshape(negdivergence==7 and mindivcount<8 ? high[lbR] + voffset : na, offset=-off, title=”7 Regular Bearish Divs found”, text=”7″, style=shape.labeldown, location=location.absolute, color=color.red, textcolor=color.white, transp=0)

    plotshape(negdivergence==8 and mindivcount<9 ? high[lbR] + voffset : na, offset=-off, title=”8 Regular Bearish Divs found”, text=”8″, style=shape.labeldown, location=location.absolute, color=color.red, textcolor=color.white, transp=0)

    plotshape(negdivergence>8 and mindivcount<11 ? high[lbR] + voffset : na, offset=-off, title=”8+ Regular Bearish Divs found”, text=”8+”, style=shape.labeldown, location=location.absolute, color=color.red, textcolor=color.white, transp=0)


    plotshape(posdivergencehidden==1 and mindivcount<2 ? low[lbR] – voffset : na, offset=-off, title=”1 Hidden Bullish Div found”, text=”1″, style=shape.labelup, location=location.absolute, color=color.green, textcolor=color.white, transp=0)

    plotshape(posdivergencehidden==2 and mindivcount<3 ? low[lbR] – voffset : na, offset=-off, title=”2 Hidden Bullish Divs found”, text=”2″, style=shape.labelup, location=location.absolute, color=color.green, textcolor=color.white, transp=0)

    plotshape(posdivergencehidden==3 and mindivcount<4 ? low[lbR] – voffset : na, offset=-off, title=”3 Hidden Bullish Divs found”, text=”3″, style=shape.labelup, location=location.absolute, color=color.green, textcolor=color.white, transp=0)

    plotshape(posdivergencehidden==4 and mindivcount<5 ? low[lbR] – voffset : na, offset=-off, title=”4 Hidden Bullish Divs found”, text=”4″, style=shape.labelup, location=location.absolute, color=color.green, textcolor=color.white, transp=0)

    plotshape(posdivergencehidden==5 and mindivcount<6 ? low[lbR] – voffset : na, offset=-off, title=”5 Hidden Bullish Divs found”, text=”5″, style=shape.labelup, location=location.absolute, color=color.green, textcolor=color.white, transp=0)

    plotshape(posdivergencehidden==6 and mindivcount<7 ? low[lbR] – voffset : na, offset=-off, title=”6 Hidden Bullish Divs found”, text=”6″, style=shape.labelup, location=location.absolute, color=color.green, textcolor=color.white, transp=0)

    plotshape(posdivergencehidden==7 and mindivcount<8 ? low[lbR] – voffset : na, offset=-off, title=”7 Hidden Bullish Divs found”, text=”7″, style=shape.labelup, location=location.absolute, color=color.green, textcolor=color.white, transp=0)

    plotshape(posdivergencehidden==8 and mindivcount<9 ? low[lbR] – voffset : na, offset=-off, title=”8 Hidden Bullish Divs found”, text=”8″, style=shape.labelup, location=location.absolute, color=color.green, textcolor=color.white, transp=0)

    plotshape(posdivergencehidden>8 and mindivcount<11 ? low[lbR] – voffset : na, offset=-off, title=”8+ Hidden Bullish Divs found”, text=”8+”, style=shape.labelup, location=location.absolute, color=color.green, textcolor=color.white, transp=0)


    plotshape(negdivergencehidden==1 and mindivcount<2 ? high[lbR] + voffset : na, offset=-off, title=”1 Hidden Bearish Div found”, text=”1″, style=shape.labeldown, location=location.absolute, color=color.orange, textcolor=color.white, transp=0)

    plotshape(negdivergencehidden==2 and mindivcount<3 ? high[lbR] + voffset : na, offset=-off, title=”2 Hidden Bearish Divs found”, text=”2″, style=shape.labeldown, location=location.absolute, color=color.orange, textcolor=color.white, transp=0)

    plotshape(negdivergencehidden==3 and mindivcount<4 ? high[lbR] + voffset : na, offset=-off, title=”3 Hidden Bearish Divs found”, text=”3″, style=shape.labeldown, location=location.absolute, color=color.orange, textcolor=color.white, transp=0)

    plotshape(negdivergencehidden==4 and mindivcount<5 ? high[lbR] + voffset : na, offset=-off, title=”4 Hidden Bearish Divs found”, text=”4″, style=shape.labeldown, location=location.absolute, color=color.orange, textcolor=color.white, transp=0)

    plotshape(negdivergencehidden==5 and mindivcount<6 ? high[lbR] + voffset : na, offset=-off, title=”5 Hidden Bearish Divs found”, text=”5″, style=shape.labeldown, location=location.absolute, color=color.orange, textcolor=color.white, transp=0)

    plotshape(negdivergencehidden==6 and mindivcount<7 ? high[lbR] + voffset : na, offset=-off, title=”6 Hidden Bearish Divs found”, text=”6″, style=shape.labeldown, location=location.absolute, color=color.orange, textcolor=color.white, transp=0)

    plotshape(negdivergencehidden==7 and mindivcount<8 ? high[lbR] + voffset : na, offset=-off, title=”7 Hidden Bearish Divs found”, text=”7″, style=shape.labeldown, location=location.absolute, color=color.orange, textcolor=color.white, transp=0)

    plotshape(negdivergencehidden==8 and mindivcount<9 ? high[lbR] + voffset : na, offset=-off, title=”8 Hidden Bearish Divs found”, text=”8″, style=shape.labeldown, location=location.absolute, color=color.orange, textcolor=color.white, transp=0)

    plotshape(negdivergencehidden>8 and mindivcount<11 ? high[lbR] + voffset : na, offset=-off, title=”8+ Hidden Bearish Divs found”, text=”8+”, style=shape.labeldown, location=location.absolute, color=color.orange, textcolor=color.white, transp=0)


    Ugo Blanco thanked this post
    #261750 quote
    Iván González
    Moderator
    Legend

    Here you have:

    //-------------------------------------------------------------------------------//
    //PRC_Multiple Divergences
    //version = 0
    //04.06.26
    //Ivan Gonzalez @ www.prorealcode.com
    //Sharing ProRealTime knowledge
    //Original: "Multiple divergences rework NON-REPAINT" by Peter_O (TradingView)
    //-------------------------------------------------------------------------------//
    //Indicador OVERLAY (aplicar sobre el precio).
    //Cuenta cuantos de los 10 osciladores divergen a la vez en cada pivote y
    //dibuja el numero. 4 tipos: Regular/Hidden x Bull/Bear.
    //-------------------------------------------------------------------------------//
    //-----Inputs--------------------------------------------------------------------//
    mindivcount = 2    //minimo de divergencias confluentes para mostrar la etiqueta
    lbR = 1            //pivot lookback right (barras de confirmacion)
    lbL = 3            //pivot lookback left (barras de busqueda)
    minbars = 1        //rangeLower: distancia minima en barras entre pivotes
    maxbars = 60       //rangeUpper: distancia maxima en barras entre pivotes
    plotBull = 1       //mostrar divergencias regular alcistas
    plotHiddenBull = 1 //mostrar divergencias hidden alcistas
    plotBear = 1       //mostrar divergencias regular bajistas
    plotHiddenBear = 1 //mostrar divergencias hidden bajistas
    //-----Osciladores ON/OFF (1=activo, 0=inactivo)
    calcrsi = 1
    calcmacd = 1
    calcmacdh = 1
    calcmom = 1
    calccci = 1
    calcobv = 1
    calcstoc = 1
    calcdi = 1
    calcvwmacd = 1
    calccmf = 1
    //-------------------------------------------------------------------------------//
    //-----Calculo de los 10 osciladores como series---------------------------------//
    //Se calculan manualmente los osciladores cuyo nativo PRT es ambiguo (nombre o
    //fuente) para garantizar compilacion y fidelidad exacta al original de TradingView.
    o1 = rsi[14](close)                                       //RSI (nativo)
    //-----MACD line + histograma (EMA12 - EMA26)
    //OJO: "macdline" es palabra reservada en PRT -> se usa "mymacdline"
    mymacdline = exponentialaverage[12](close) - exponentialaverage[26](close)
    o2 = mymacdline                                             //MACD line
    o3 = mymacdline - exponentialaverage[9](mymacdline)           //MACD histograma
    o4 = close - close[10]                                    //Momentum
    //-----CCI sobre close (fiel a cci(close,10))
    ccisma = average[10](close)
    ccimd = average[10](abs(close - ccisma))
    if ccimd > 0 then
       o5 = (close - ccisma) / (0.015*ccimd)
    else
       o5 = 0
    endif
    //-----OBV (acumulado manual)
    if close > close[1] then
       obval = obval[1] + volume
    elsif close < close[1] then
       obval = obval[1] - volume
    else
       obval = obval[1]
    endif
    o6 = obval                                                //OBV
    //-----Stochastic %K suavizado 3 (manual)
    lowest14 = lowest[14](low)
    highest14 = highest[14](high)
    if highest14 > lowest14 then
       stochk = 100 * (close - lowest14) / (highest14 - lowest14)
    else
       stochk = 0
    endif
    o7 = average[3](stochk)                                   //Stochastic
    //-----DI oscillator (custom Peter_O)
    diVal = (high - high[1]) + (low - low[1])
    truerange = max(high, close[1]) - min(low, close[1])
    trur = average[14,3](truerange)
    if trur > 0 then
       o8 = 100 * average[14,3](diVal) / trur
    else
       o8 = 0
    endif
    //-----VWMACD (VWMA 12 - VWMA 26, ver learning 011)
    volSum12 = summation[12](volume)
    volSum26 = summation[26](volume)
    if volSum12 > 0 then
       vw12 = summation[12](close*volume) / volSum12
    else
       vw12 = close
    endif
    if volSum26 > 0 then
       vw26 = summation[26](close*volume) / volSum26
    else
       vw26 = close
    endif
    o9 = vw12 - vw26                                          //VWMACD
    //-----Chaikin Money Flow
    if high > low then
       cmfm = ((close-low) - (high-close)) / (high-low)
    else
       cmfm = 0
    endif
    cmfv = cmfm * volume
    volSum21 = summation[21](volume)
    if volSum21 > 0 then
       o10 = summation[21](cmfv) / volSum21
    else
       o10 = 0
    endif
    //-------------------------------------------------------------------------------//
    //-----Bloque de divergencias por oscilador--------------------------------------//
    //Para cada oscilador se mantiene el ultimo pivote (c=current) y el anterior
    //(p=prev) tanto del oscilador (oL/oH) como del precio (pL/pH) y su barindex
    //(bL/bH). Emula el valuewhen(...,1) del original sin arrays.
    
    //----- o1 RSI
    plf1 = o1 > o1[lbR] and lowest[lbR](o1) > o1[lbR] and o1[lbR] < lowest[lbL](o1)[lbR+1]
    if plf1 then
       oLp1 = oLc1
       pLp1 = pLc1
       bLp1 = bLc1
       oLc1 = o1[lbR]
       pLc1 = low[lbR]
       bLc1 = barindex[lbR]
    endif
    phf1 = o1 < o1[lbR] and highest[lbR](o1) < o1[lbR] and o1[lbR] > highest[lbL](o1)[lbR+1]
    if phf1 then
       oHp1 = oHc1
       pHp1 = pHc1
       bHp1 = bHc1
       oHc1 = o1[lbR]
       pHc1 = high[lbR]
       bHc1 = barindex[lbR]
    endif
    inRL1 = bLp1 > 0 and (bLc1-bLp1) >= minbars and (bLc1-bLp1) <= maxbars
    inRH1 = bHp1 > 0 and (bHc1-bHp1) >= minbars and (bHc1-bHp1) <= maxbars
    bull1  = calcrsi and plotBull and plf1 and pLc1 < pLp1 and oLc1 > oLp1 and inRL1
    hbull1 = calcrsi and plotHiddenBull and plf1 and pLc1 > pLp1 and oLc1 < oLp1 and inRL1
    bear1  = calcrsi and plotBear and phf1 and pHc1 > pHp1 and oHc1 < oHp1 and inRH1
    hbear1 = calcrsi and plotHiddenBear and phf1 and pHc1 < pHp1 and oHc1 > oHp1 and inRH1
    
    //----- o2 MACD line
    plf2 = o2 > o2[lbR] and lowest[lbR](o2) > o2[lbR] and o2[lbR] < lowest[lbL](o2)[lbR+1]
    if plf2 then
       oLp2 = oLc2
       pLp2 = pLc2
       bLp2 = bLc2
       oLc2 = o2[lbR]
       pLc2 = low[lbR]
       bLc2 = barindex[lbR]
    endif
    phf2 = o2 < o2[lbR] and highest[lbR](o2) < o2[lbR] and o2[lbR] > highest[lbL](o2)[lbR+1]
    if phf2 then
       oHp2 = oHc2
       pHp2 = pHc2
       bHp2 = bHc2
       oHc2 = o2[lbR]
       pHc2 = high[lbR]
       bHc2 = barindex[lbR]
    endif
    inRL2 = bLp2 > 0 and (bLc2-bLp2) >= minbars and (bLc2-bLp2) <= maxbars
    inRH2 = bHp2 > 0 and (bHc2-bHp2) >= minbars and (bHc2-bHp2) <= maxbars
    bull2  = calcmacd and plotBull and plf2 and pLc2 < pLp2 and oLc2 > oLp2 and inRL2
    hbull2 = calcmacd and plotHiddenBull and plf2 and pLc2 > pLp2 and oLc2 < oLp2 and inRL2
    bear2  = calcmacd and plotBear and phf2 and pHc2 > pHp2 and oHc2 < oHp2 and inRH2
    hbear2 = calcmacd and plotHiddenBear and phf2 and pHc2 < pHp2 and oHc2 > oHp2 and inRH2
    
    //----- o3 MACD histograma
    plf3 = o3 > o3[lbR] and lowest[lbR](o3) > o3[lbR] and o3[lbR] < lowest[lbL](o3)[lbR+1]
    if plf3 then
       oLp3 = oLc3
       pLp3 = pLc3
       bLp3 = bLc3
       oLc3 = o3[lbR]
       pLc3 = low[lbR]
       bLc3 = barindex[lbR]
    endif
    phf3 = o3 < o3[lbR] and highest[lbR](o3) < o3[lbR] and o3[lbR] > highest[lbL](o3)[lbR+1]
    if phf3 then
       oHp3 = oHc3
       pHp3 = pHc3
       bHp3 = bHc3
       oHc3 = o3[lbR]
       pHc3 = high[lbR]
       bHc3 = barindex[lbR]
    endif
    inRL3 = bLp3 > 0 and (bLc3-bLp3) >= minbars and (bLc3-bLp3) <= maxbars
    inRH3 = bHp3 > 0 and (bHc3-bHp3) >= minbars and (bHc3-bHp3) <= maxbars
    bull3  = calcmacdh and plotBull and plf3 and pLc3 < pLp3 and oLc3 > oLp3 and inRL3
    hbull3 = calcmacdh and plotHiddenBull and plf3 and pLc3 > pLp3 and oLc3 < oLp3 and inRL3
    bear3  = calcmacdh and plotBear and phf3 and pHc3 > pHp3 and oHc3 < oHp3 and inRH3
    hbear3 = calcmacdh and plotHiddenBear and phf3 and pHc3 < pHp3 and oHc3 > oHp3 and inRH3
    
    //----- o4 Momentum
    plf4 = o4 > o4[lbR] and lowest[lbR](o4) > o4[lbR] and o4[lbR] < lowest[lbL](o4)[lbR+1]
    if plf4 then
       oLp4 = oLc4
       pLp4 = pLc4
       bLp4 = bLc4
       oLc4 = o4[lbR]
       pLc4 = low[lbR]
       bLc4 = barindex[lbR]
    endif
    phf4 = o4 < o4[lbR] and highest[lbR](o4) < o4[lbR] and o4[lbR] > highest[lbL](o4)[lbR+1]
    if phf4 then
       oHp4 = oHc4
       pHp4 = pHc4
       bHp4 = bHc4
       oHc4 = o4[lbR]
       pHc4 = high[lbR]
       bHc4 = barindex[lbR]
    endif
    inRL4 = bLp4 > 0 and (bLc4-bLp4) >= minbars and (bLc4-bLp4) <= maxbars
    inRH4 = bHp4 > 0 and (bHc4-bHp4) >= minbars and (bHc4-bHp4) <= maxbars
    bull4  = calcmom and plotBull and plf4 and pLc4 < pLp4 and oLc4 > oLp4 and inRL4
    hbull4 = calcmom and plotHiddenBull and plf4 and pLc4 > pLp4 and oLc4 < oLp4 and inRL4
    bear4  = calcmom and plotBear and phf4 and pHc4 > pHp4 and oHc4 < oHp4 and inRH4
    hbear4 = calcmom and plotHiddenBear and phf4 and pHc4 < pHp4 and oHc4 > oHp4 and inRH4
    
    //----- o5 CCI
    plf5 = o5 > o5[lbR] and lowest[lbR](o5) > o5[lbR] and o5[lbR] < lowest[lbL](o5)[lbR+1]
    if plf5 then
       oLp5 = oLc5
       pLp5 = pLc5
       bLp5 = bLc5
       oLc5 = o5[lbR]
       pLc5 = low[lbR]
       bLc5 = barindex[lbR]
    endif
    phf5 = o5 < o5[lbR] and highest[lbR](o5) < o5[lbR] and o5[lbR] > highest[lbL](o5)[lbR+1]
    if phf5 then
       oHp5 = oHc5
       pHp5 = pHc5
       bHp5 = bHc5
       oHc5 = o5[lbR]
       pHc5 = high[lbR]
       bHc5 = barindex[lbR]
    endif
    inRL5 = bLp5 > 0 and (bLc5-bLp5) >= minbars and (bLc5-bLp5) <= maxbars
    inRH5 = bHp5 > 0 and (bHc5-bHp5) >= minbars and (bHc5-bHp5) <= maxbars
    bull5  = calccci and plotBull and plf5 and pLc5 < pLp5 and oLc5 > oLp5 and inRL5
    hbull5 = calccci and plotHiddenBull and plf5 and pLc5 > pLp5 and oLc5 < oLp5 and inRL5
    bear5  = calccci and plotBear and phf5 and pHc5 > pHp5 and oHc5 < oHp5 and inRH5
    hbear5 = calccci and plotHiddenBear and phf5 and pHc5 < pHp5 and oHc5 > oHp5 and inRH5
    
    //----- o6 OBV
    plf6 = o6 > o6[lbR] and lowest[lbR](o6) > o6[lbR] and o6[lbR] < lowest[lbL](o6)[lbR+1]
    if plf6 then
       oLp6 = oLc6
       pLp6 = pLc6
       bLp6 = bLc6
       oLc6 = o6[lbR]
       pLc6 = low[lbR]
       bLc6 = barindex[lbR]
    endif
    phf6 = o6 < o6[lbR] and highest[lbR](o6) < o6[lbR] and o6[lbR] > highest[lbL](o6)[lbR+1]
    if phf6 then
       oHp6 = oHc6
       pHp6 = pHc6
       bHp6 = bHc6
       oHc6 = o6[lbR]
       pHc6 = high[lbR]
       bHc6 = barindex[lbR]
    endif
    inRL6 = bLp6 > 0 and (bLc6-bLp6) >= minbars and (bLc6-bLp6) <= maxbars
    inRH6 = bHp6 > 0 and (bHc6-bHp6) >= minbars and (bHc6-bHp6) <= maxbars
    bull6  = calcobv and plotBull and plf6 and pLc6 < pLp6 and oLc6 > oLp6 and inRL6
    hbull6 = calcobv and plotHiddenBull and plf6 and pLc6 > pLp6 and oLc6 < oLp6 and inRL6
    bear6  = calcobv and plotBear and phf6 and pHc6 > pHp6 and oHc6 < oHp6 and inRH6
    hbear6 = calcobv and plotHiddenBear and phf6 and pHc6 < pHp6 and oHc6 > oHp6 and inRH6
    
    //----- o7 Stochastic
    plf7 = o7 > o7[lbR] and lowest[lbR](o7) > o7[lbR] and o7[lbR] < lowest[lbL](o7)[lbR+1]
    if plf7 then
       oLp7 = oLc7
       pLp7 = pLc7
       bLp7 = bLc7
       oLc7 = o7[lbR]
       pLc7 = low[lbR]
       bLc7 = barindex[lbR]
    endif
    phf7 = o7 < o7[lbR] and highest[lbR](o7) < o7[lbR] and o7[lbR] > highest[lbL](o7)[lbR+1]
    if phf7 then
       oHp7 = oHc7
       pHp7 = pHc7
       bHp7 = bHc7
       oHc7 = o7[lbR]
       pHc7 = high[lbR]
       bHc7 = barindex[lbR]
    endif
    inRL7 = bLp7 > 0 and (bLc7-bLp7) >= minbars and (bLc7-bLp7) <= maxbars
    inRH7 = bHp7 > 0 and (bHc7-bHp7) >= minbars and (bHc7-bHp7) <= maxbars
    bull7  = calcstoc and plotBull and plf7 and pLc7 < pLp7 and oLc7 > oLp7 and inRL7
    hbull7 = calcstoc and plotHiddenBull and plf7 and pLc7 > pLp7 and oLc7 < oLp7 and inRL7
    bear7  = calcstoc and plotBear and phf7 and pHc7 > pHp7 and oHc7 < oHp7 and inRH7
    hbear7 = calcstoc and plotHiddenBear and phf7 and pHc7 < pHp7 and oHc7 > oHp7 and inRH7
    
    //----- o8 DI oscillator
    plf8 = o8 > o8[lbR] and lowest[lbR](o8) > o8[lbR] and o8[lbR] < lowest[lbL](o8)[lbR+1]
    if plf8 then
       oLp8 = oLc8
       pLp8 = pLc8
       bLp8 = bLc8
       oLc8 = o8[lbR]
       pLc8 = low[lbR]
       bLc8 = barindex[lbR]
    endif
    phf8 = o8 < o8[lbR] and highest[lbR](o8) < o8[lbR] and o8[lbR] > highest[lbL](o8)[lbR+1]
    if phf8 then
       oHp8 = oHc8
       pHp8 = pHc8
       bHp8 = bHc8
       oHc8 = o8[lbR]
       pHc8 = high[lbR]
       bHc8 = barindex[lbR]
    endif
    inRL8 = bLp8 > 0 and (bLc8-bLp8) >= minbars and (bLc8-bLp8) <= maxbars
    inRH8 = bHp8 > 0 and (bHc8-bHp8) >= minbars and (bHc8-bHp8) <= maxbars
    bull8  = calcdi and plotBull and plf8 and pLc8 < pLp8 and oLc8 > oLp8 and inRL8
    hbull8 = calcdi and plotHiddenBull and plf8 and pLc8 > pLp8 and oLc8 < oLp8 and inRL8
    bear8  = calcdi and plotBear and phf8 and pHc8 > pHp8 and oHc8 < oHp8 and inRH8
    hbear8 = calcdi and plotHiddenBear and phf8 and pHc8 < pHp8 and oHc8 > oHp8 and inRH8
    
    //----- o9 VWMACD
    plf9 = o9 > o9[lbR] and lowest[lbR](o9) > o9[lbR] and o9[lbR] < lowest[lbL](o9)[lbR+1]
    if plf9 then
       oLp9 = oLc9
       pLp9 = pLc9
       bLp9 = bLc9
       oLc9 = o9[lbR]
       pLc9 = low[lbR]
       bLc9 = barindex[lbR]
    endif
    phf9 = o9 < o9[lbR] and highest[lbR](o9) < o9[lbR] and o9[lbR] > highest[lbL](o9)[lbR+1]
    if phf9 then
       oHp9 = oHc9
       pHp9 = pHc9
       bHp9 = bHc9
       oHc9 = o9[lbR]
       pHc9 = high[lbR]
       bHc9 = barindex[lbR]
    endif
    inRL9 = bLp9 > 0 and (bLc9-bLp9) >= minbars and (bLc9-bLp9) <= maxbars
    inRH9 = bHp9 > 0 and (bHc9-bHp9) >= minbars and (bHc9-bHp9) <= maxbars
    bull9  = calcvwmacd and plotBull and plf9 and pLc9 < pLp9 and oLc9 > oLp9 and inRL9
    hbull9 = calcvwmacd and plotHiddenBull and plf9 and pLc9 > pLp9 and oLc9 < oLp9 and inRL9
    bear9  = calcvwmacd and plotBear and phf9 and pHc9 > pHp9 and oHc9 < oHp9 and inRH9
    hbear9 = calcvwmacd and plotHiddenBear and phf9 and pHc9 < pHp9 and oHc9 > oHp9 and inRH9
    
    //----- o10 Chaikin Money Flow
    plf10 = o10 > o10[lbR] and lowest[lbR](o10) > o10[lbR] and o10[lbR] < lowest[lbL](o10)[lbR+1]
    if plf10 then
       oLp10 = oLc10
       pLp10 = pLc10
       bLp10 = bLc10
       oLc10 = o10[lbR]
       pLc10 = low[lbR]
       bLc10 = barindex[lbR]
    endif
    phf10 = o10 < o10[lbR] and highest[lbR](o10) < o10[lbR] and o10[lbR] > highest[lbL](o10)[lbR+1]
    if phf10 then
       oHp10 = oHc10
       pHp10 = pHc10
       bHp10 = bHc10
       oHc10 = o10[lbR]
       pHc10 = high[lbR]
       bHc10 = barindex[lbR]
    endif
    inRL10 = bLp10 > 0 and (bLc10-bLp10) >= minbars and (bLc10-bLp10) <= maxbars
    inRH10 = bHp10 > 0 and (bHc10-bHp10) >= minbars and (bHc10-bHp10) <= maxbars
    bull10  = calccmf and plotBull and plf10 and pLc10 < pLp10 and oLc10 > oLp10 and inRL10
    hbull10 = calccmf and plotHiddenBull and plf10 and pLc10 > pLp10 and oLc10 < oLp10 and inRL10
    bear10  = calccmf and plotBear and phf10 and pHc10 > pHp10 and oHc10 < oHp10 and inRH10
    hbear10 = calccmf and plotHiddenBear and phf10 and pHc10 < pHp10 and oHc10 > oHp10 and inRH10
    
    //-------------------------------------------------------------------------------//
    //-----Conteo de divergencias confluentes (suma de booleanos, learning 058)------//
    posdivergence       = (bull1)+(bull2)+(bull3)+(bull4)+(bull5)+(bull6)+(bull7)+(bull8)+(bull9)+(bull10)
    negdivergence       = (bear1)+(bear2)+(bear3)+(bear4)+(bear5)+(bear6)+(bear7)+(bear8)+(bear9)+(bear10)
    posdivergencehidden = (hbull1)+(hbull2)+(hbull3)+(hbull4)+(hbull5)+(hbull6)+(hbull7)+(hbull8)+(hbull9)+(hbull10)
    negdivergencehidden = (hbear1)+(hbear2)+(hbear3)+(hbear4)+(hbear5)+(hbear6)+(hbear7)+(hbear8)+(hbear9)+(hbear10)
    
    //-------------------------------------------------------------------------------//
    //-----Dibujo--------------------------------------------------------------------//
    //drawtext NO concatena con "+". El numero se inserta con interpolacion #var#.
    //Para que el simbolo quede centrado sobre la vela del pivote, simbolo y numero
    //van en DOS drawtext: el simbolo en barindex[lbR] y el numero en la vela
    //siguiente (barindex[lbR]+1), ambos a la MISMA altura (yref) para que cuadren.
    voffset = 0.5 * averagetruerange[14]
    yrefBull = low[lbR] - voffset
    yrefBear = high[lbR] + voffset
    
    if posdivergence >= mindivcount then
       drawtext("▲", barindex[lbR], yrefBull) coloured(0,150,136)
       drawtext("#posdivergence#", barindex[lbR], yrefBull-0.8*voffset) coloured(0,150,136)
    endif
    if negdivergence >= mindivcount then
       drawtext("▼", barindex[lbR], yrefBear) coloured(255,0,0)
       drawtext("#negdivergence#", barindex[lbR], yrefBear+0.8*voffset) coloured(255,0,0)
    endif
    if posdivergencehidden >= mindivcount then
       drawtext("△", barindex[lbR], yrefBull) coloured(0,200,0)
       drawtext("#posdivergencehidden#", barindex[lbR], yrefBull-0.8*voffset) coloured(0,200,0)
    endif
    if negdivergencehidden >= mindivcount then
       drawtext("▽", barindex[lbR], yrefBear) coloured(255,165,0)
       drawtext("#negdivergencehidden#", barindex[lbR], yrefBear+0.8*voffset) coloured(255,165,0)
    endif
    
    return


    brian gilbert thanked this post
    FTMIBXXXX-4-horas.png FTMIBXXXX-4-horas.png
    #261756 quote
    brian gilbert
    Participant
    Average

    THANK YOU VERY MUCH, IVAN!

Viewing 3 posts - 1 through 3 (of 3 total)
  • You must be logged in to reply to this topic.

TradingView to ProRealTime Translation Center

New Reply
Author
Summary

This topic contains 2 replies,
has 2 voices, and was last updated by brian gilbert
2 weeks, 6 days ago.

Topic Details
Forum: TradingView to ProRealTime Translation Center Forum
Started: 06/03/2026
Status: Active
Attachments: 1 files
Logo Logo
Loading...