Hello everybody. I am trying to use the MTF in a momentum strategy that is in its early stages.
I am using the close of multiple moving averages, that are < or > the previous close. In the hour TF.
Wanting to open a trade at the start of the hour candle, and close at the end of the candle. So that I can open another trade at the start of the next candle.
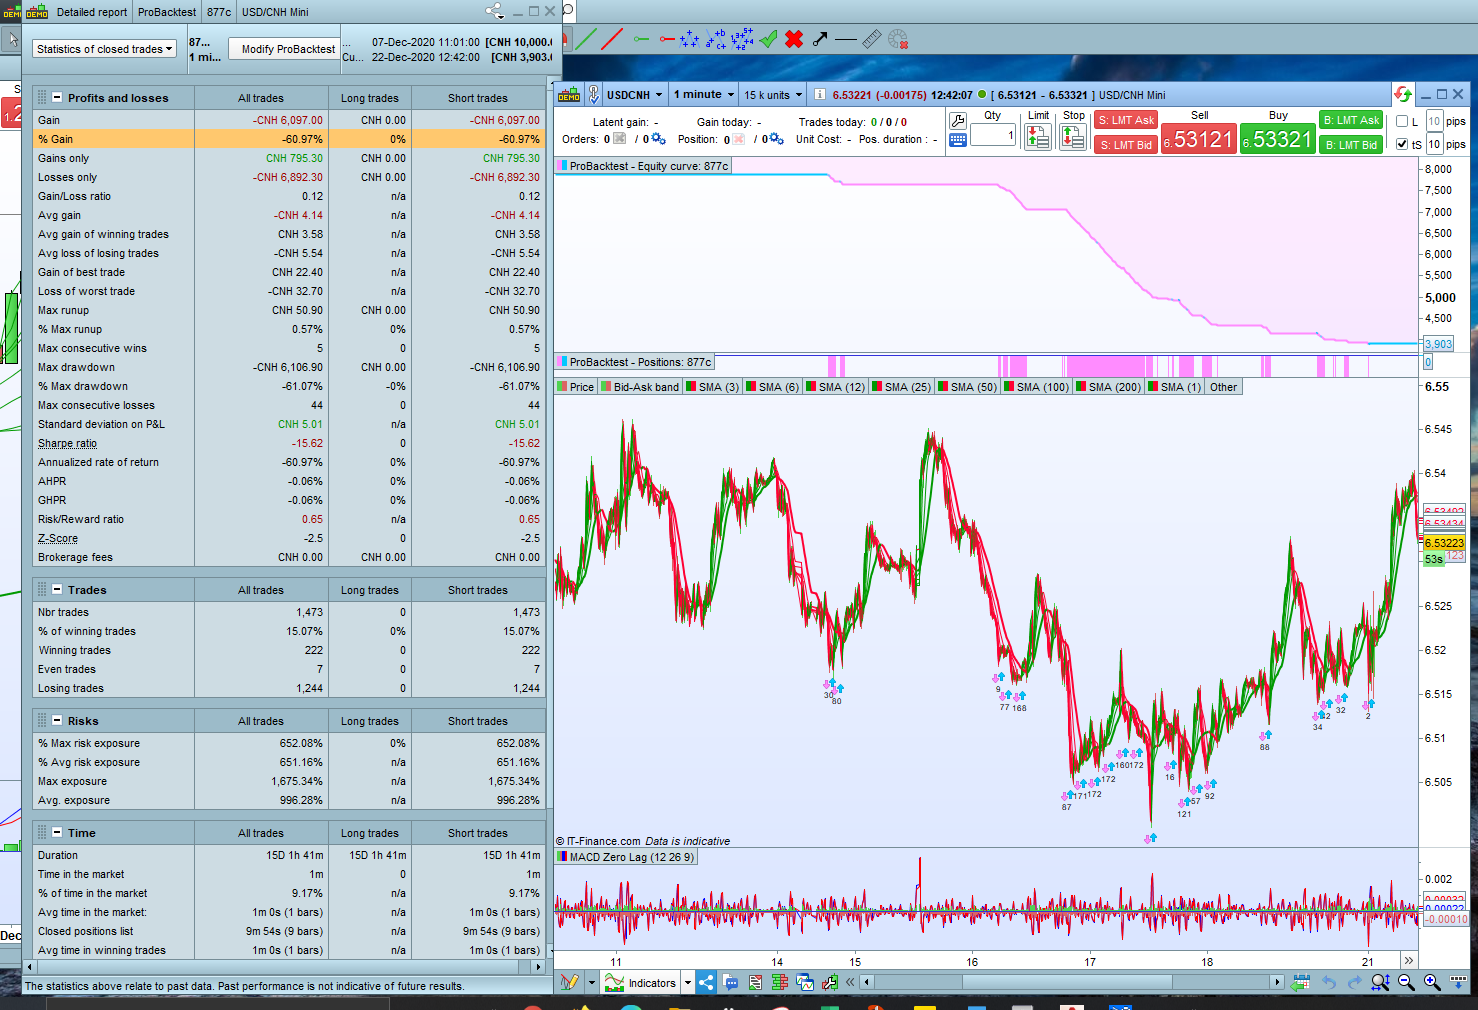
The only work around I have found is using the 1 minute time frame, and closing the trade at 235900. I minute before the end of the day.
But my strategy will not trade both longs and shorts. Some currency pairs trade longs only, and others trade shorts only.
Being a code learner at the early stages, I have no idea of how to fix this!
This is the code. I thought I had attached it.
This is the proper file. Sorry all.
Hi all,
Nicolas sorry I think I have posted a message in English on the French Forum. You can delete it if needed.
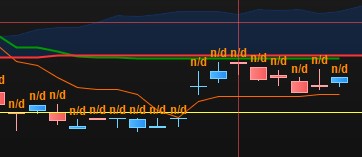
The here below code draw n/d
timeframe(15 minutes)
SSpanA = SenkouSpanA[9,26,52]//(tenkan[KijPeriod]+kijun[KijPeriod])/2

timeframe(1 minutes)
DRAWTEXT(SSpanA, barindex, high+1, Dialog, Bold, 12) COLOURED(255,140,0,255)

return
if I replace the timeframe 15 by
- timeframe 5: Everything is OK
- 1 hour, 4 hours fail as well…
Thank you
Is the v11 multi timeframe indicator working. I am getting “calculation error” when trying to load the indicator. Could someone confirm if this is common issue?
I find this can happen if you have too much historical data loaded.
Try reducing the number of bars displayed on the chart maybe?
@robdav, the solution appears in this direction, the contrary in fact ! If I do not load enough historical data, the n/d appears
Thank you.
I am now looking for a coding solution where I could load more data than the ones displayed.
Thank you PRT… I can’t wait to start playing with these new functions.
Hi All,
Is it possible to mix different multitime frame in ticks and time based, for instance apply in a timeframe 1h an indicator based on 200 ticks.
Thanks
No, they cannot be mixed.
Good afternoon,
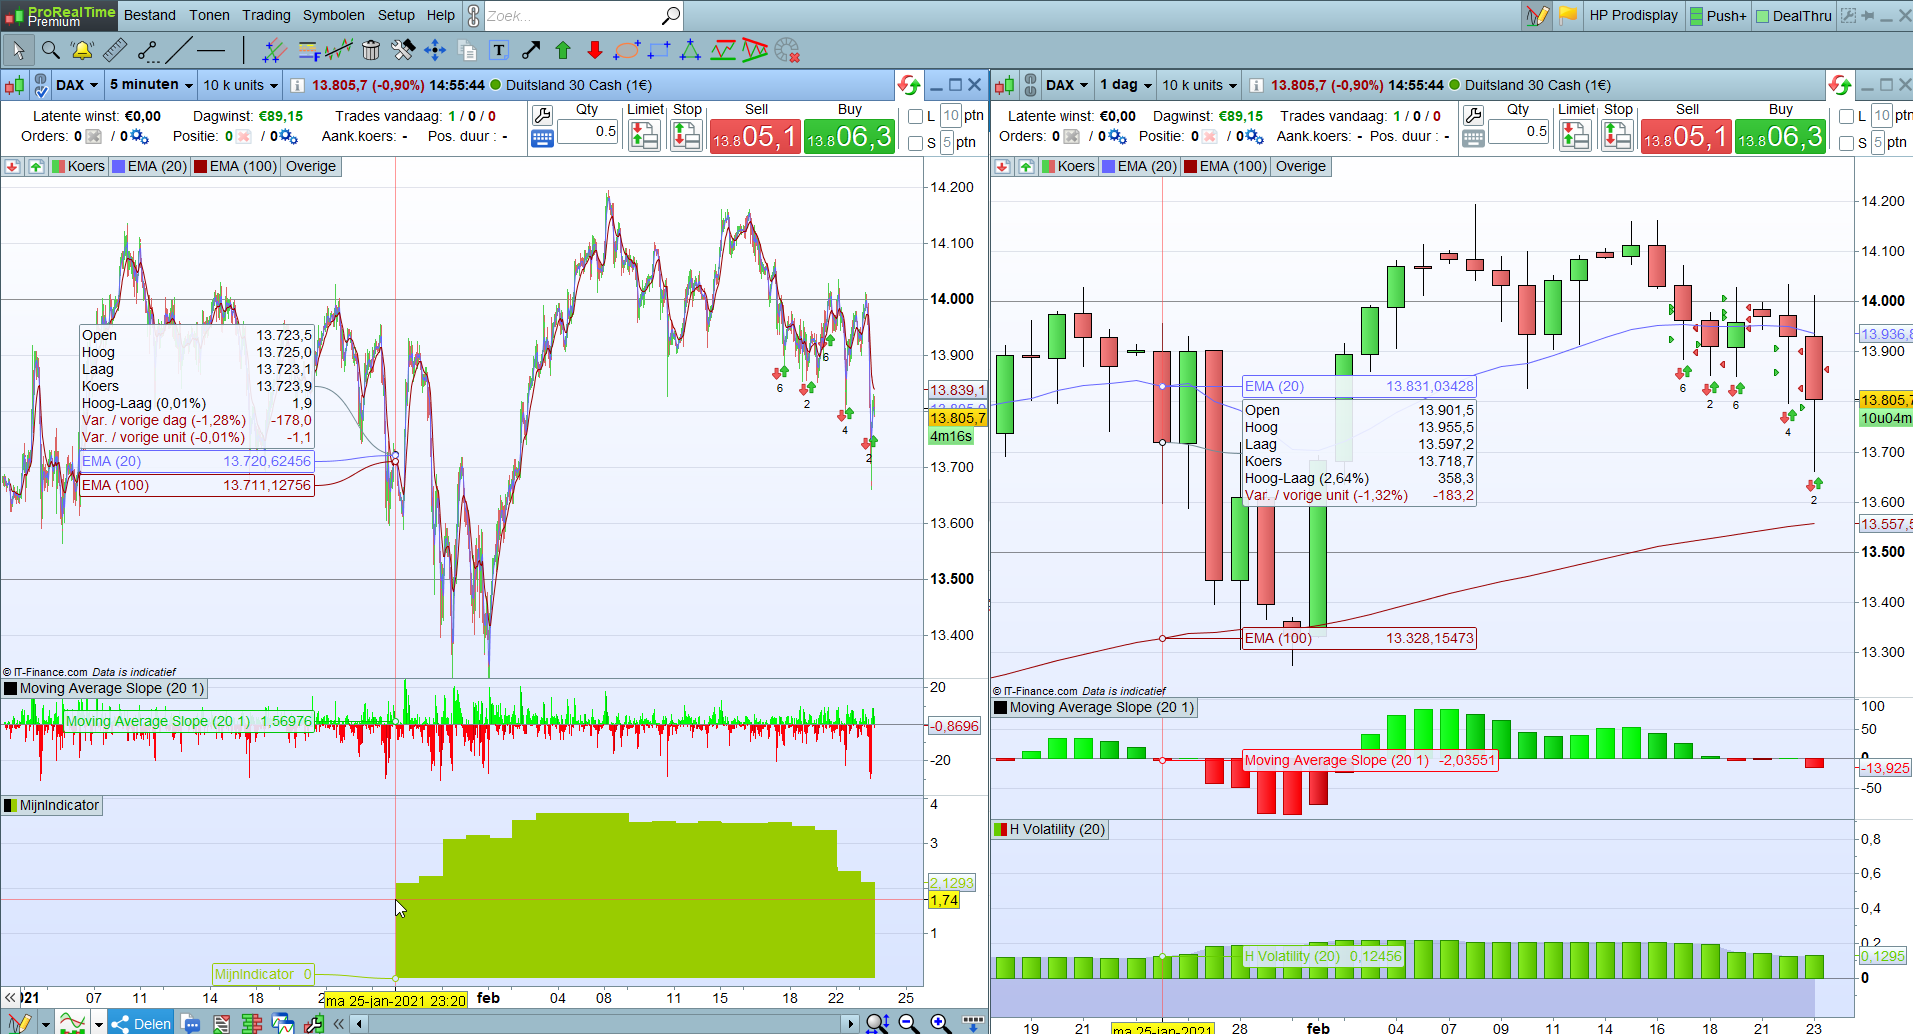
I am also trying to use MTF on indicators in a strategie. The idea is to use the historiv volatility on de daily timeframe in a 5 minute timeframe strategie.
First I created the indicator (see below)
timeframe(daily, updateonclose)
myvolatility = HistoricVolatility[20](close)

return myvolatility
But when I look at the indicator on the five minute chart it gives a completely different value the the historicvolatility on the daily chart.
How is this possible and what am i doing wrong? Also the indicator does not go further back then 25th of januari. Why is that?
Hope somebody can help me.
Kind Regards,
Jaldidee
Expand the units displayed of the 5-minutes TF chart, in order to get the necessary data to calculate the historical volatility of the daily timeframe.
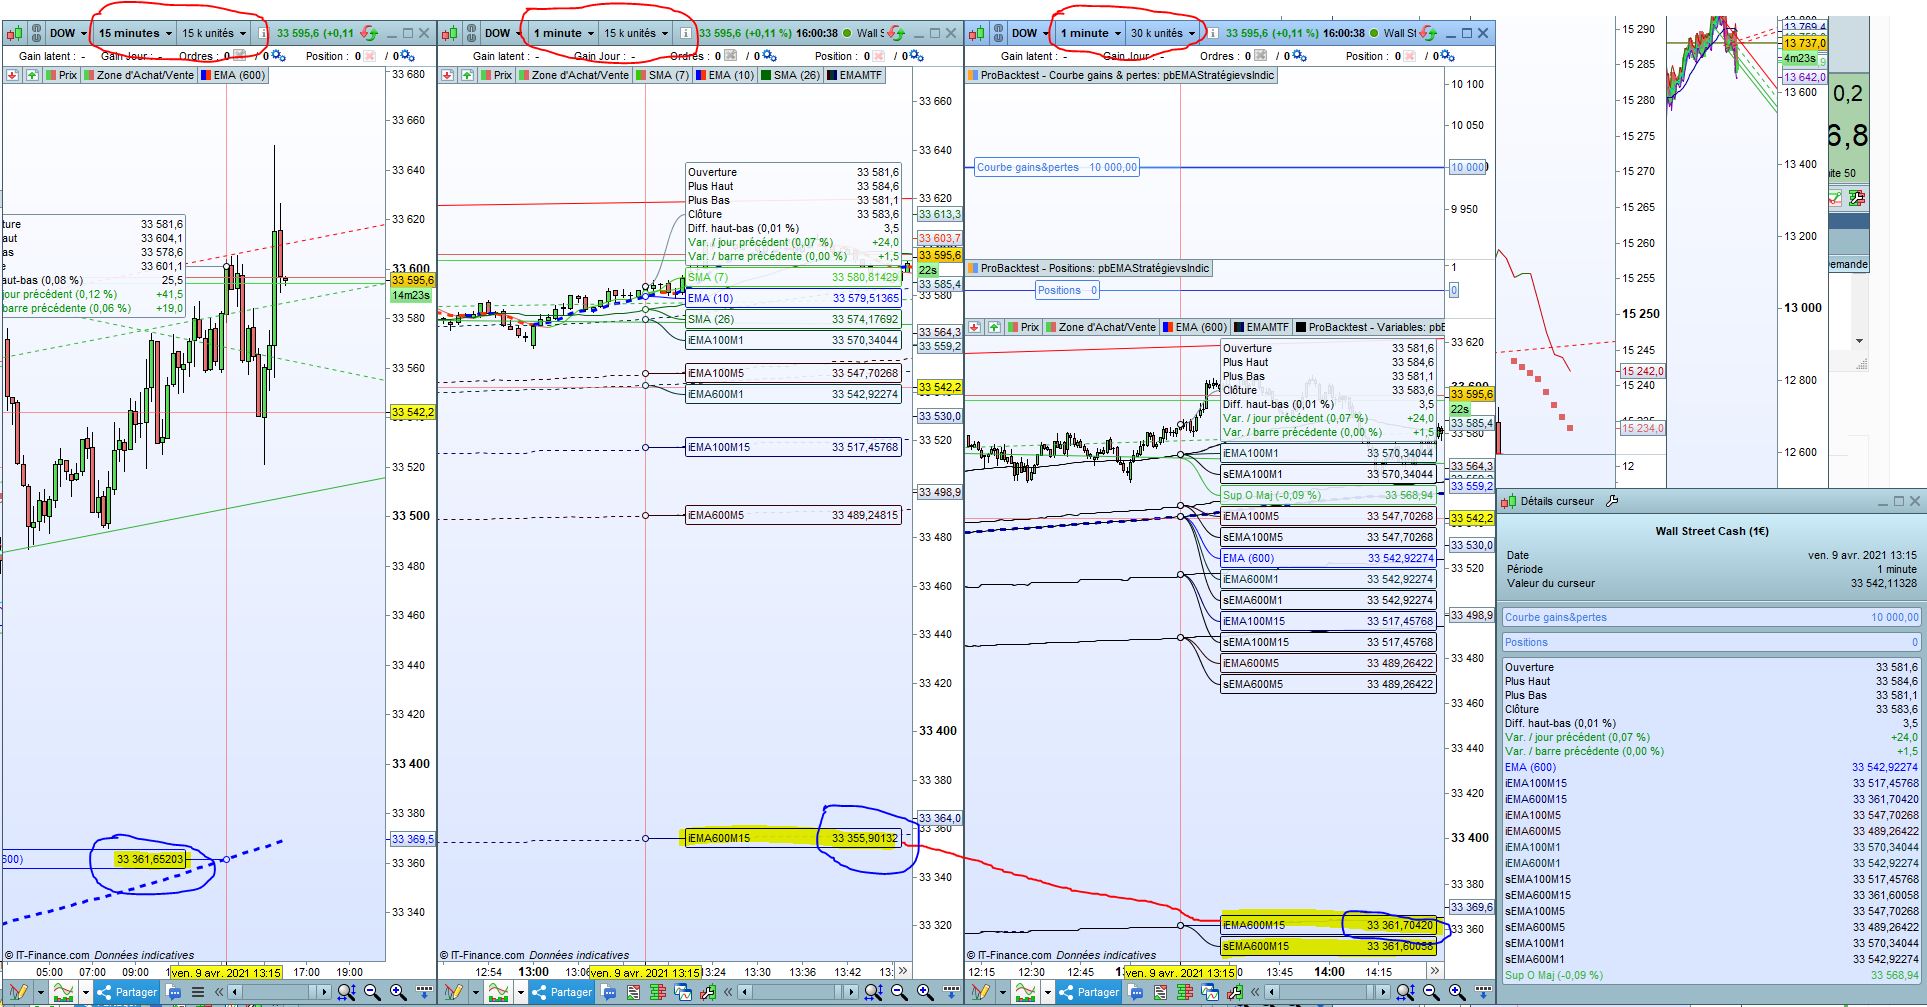
I saw an issue with multiple TimeFrames for long EMAs (600 periods) when computing them through the strategy tester and indicators.
Results are différent. Numlber of displayed units is the same.
Codes are the same except that one is inside a strategy tester, the other inside an indicator.
It seems related to the number of units displayed in the 1 minute graph.
It seems also the issue appears on the multiple timeframe indicator with 15 k units of 1 minute (that should be OK to compute a EMA(600) in 15 minutes because 15 * 600 = 9000 < 15 000),
Same issue with 20 k units.
When I display 30 k units, then it works better (not fully accurate though). I show this différence_StratégieEtIndicateurMTF3.JPG in which the middle graph is showing the issue. Left graph is the accurate number (15 minute timeframe), Middle (15 k units in 1 minute) is wrong and right is better (30k units of 1 minute), but not fully accurate though…
Is this a known problem ?
Thanks for your help
EMA uses the previous EMA value with a weighting factor to continuously calculate the new value, so a decay might happen if you start the calculation earlier or later, and that’s what you are observing here. If I use 30k units, I get the same results on the current bar.