Nuno
NunoParticipant
Average
Hi
i created an indicator in order to simulate a 20 month moving average ((h+l+c)/3)) in a daily chart. When i use it, the indicator is ok
But when i translate it in ProScreener, the result is different
For example, for the french stock SCR (SCOR Euronext Paris), the variable ‘compteur’ used to calculate the number of month is egual to 12 instead of 20 for 20 month moving Average, so the value moving average is false
why ??? is it a proscreener limit?
here the code for the indicator
thank you for help
Nuno
once monthlyHigh = undefined
once monthlyLow = undefined
once monthlyClose = undefined
dailyHigh = DHigh(1)
dailyLow = DLow(1)

if month <> month[1] then
monthlyHigh = Highest[max(1,BarIndex - lastMonthBarIndex)](dailyHigh)
monthlyLow = Lowest[max(1,BarIndex - lastMonthBarIndex)](dailyLow)
monthlyClose = DClose(1)
lastMonthBarIndex = BarIndex

h20 = h19
h19 = h18
h18 = h17
h17 = h16
h16 = h15
h15 = h14
h14 = h13
h13 = h12
h12 = h11
h11 = h10
h10 = h9
h9 = h8
h8 = h7
h7 = h6
h6 = h5
h5 = h4
h4 = h3
h3 = h2
h2 = h1
h1 = monthlyHigh

l20 = l19
l19 = l18
l18 = l17
l17 = l16
l16 = l15
l15 = l14
l14 = l13
l13  =l12
l12 = l11
l11 = l10
l10 = l9
l9  =l8
l8 = l7
l7 = l6
l6 = l5
l5 = l4
l4 = l3
l3 = l2
l2 = l1
l1 = monthlyLow

a20 = a19
a19 = a18
a18 = a17
a17 = a16
a16 = a15
a15 = a14
a14 = a13
a13 = a12
a12 = a11
a11 = a10
a10 = a9
a9 = a8
a8 = a7
a7 = a6
a6 = a5
a5 = a4
a4 = a3
a3 = a2
a2 = a1
a1 = monthlyClose

compteur = compteur+1

endif

tp1=(h1+l1+a1)/3
tp2=(h2+l2+a2)/3
tp3=(h3+l3+a3)/3
tp4=(h4+l4+a4)/3
tp5=(h5+l5+a5)/3
tp6=(h6+l6+a6)/3
tp7=(h7+l7+a7)/3
tp8=(h8+l8+a8)/3
tp9=(h9+l9+a9)/3
tp10=(h10+l10+a10)/3
tp11=(h11+l11+a11)/3
tp12=(h12+l12+a12)/3
tp13=(h13+l13+a13)/3
tp14=(h14+l14+a14)/3
tp15=(h15+l15+a15)/3
tp16=(h16+l16+a16)/3
tp17=(h17+l17+a17)/3
tp18=(h18+l18+a18)/3
tp19=(h19+l19+a19)/3
tp20=(h20+l20+a20)/3

avg20 = (tp1+tp2+tp3+tp4+tp5+tp6+tp7+tp8+tp9+tp10+tp11+tp12+tp13+tp14+tp15+tp16+tp17+tp18+tp19+tp20)/20

RETURN AVG20
ProScreener allows only a lookback of 254 bars, so I guess 20 month by roughly 21 daily bars each yields 420 approx. which is too much!
NunoParticipant
Average
thank you for your reply Roberto
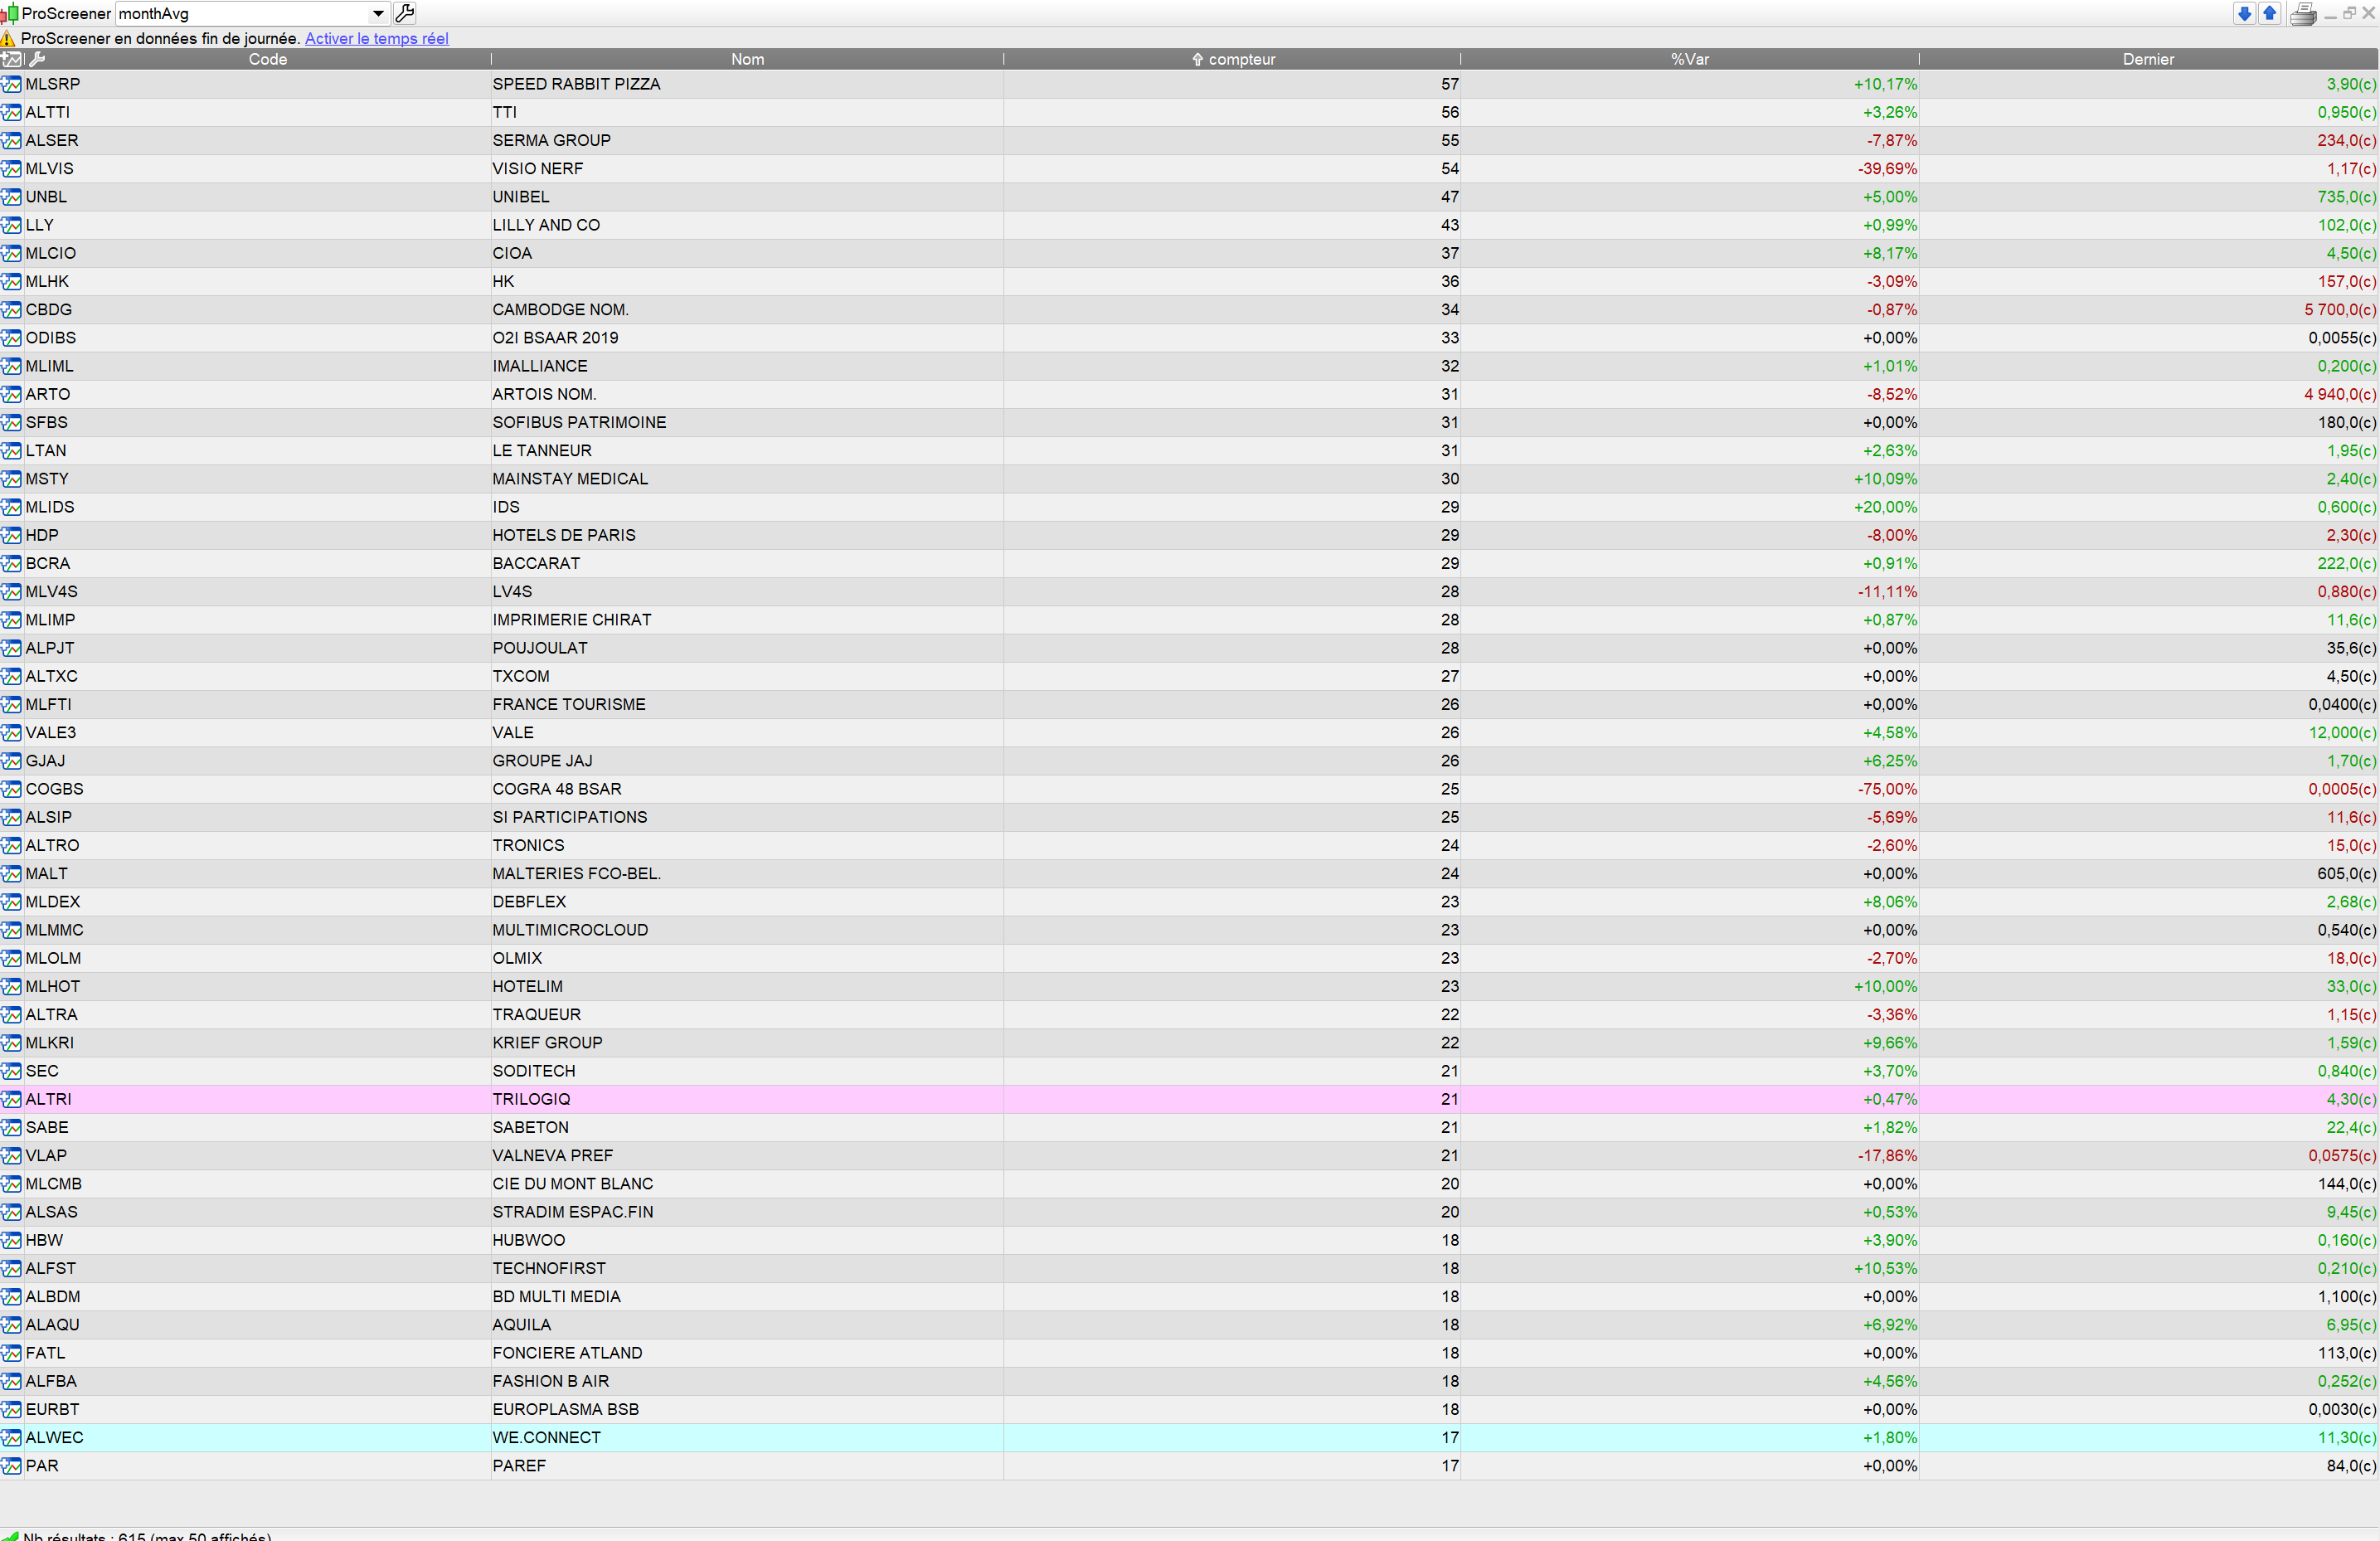
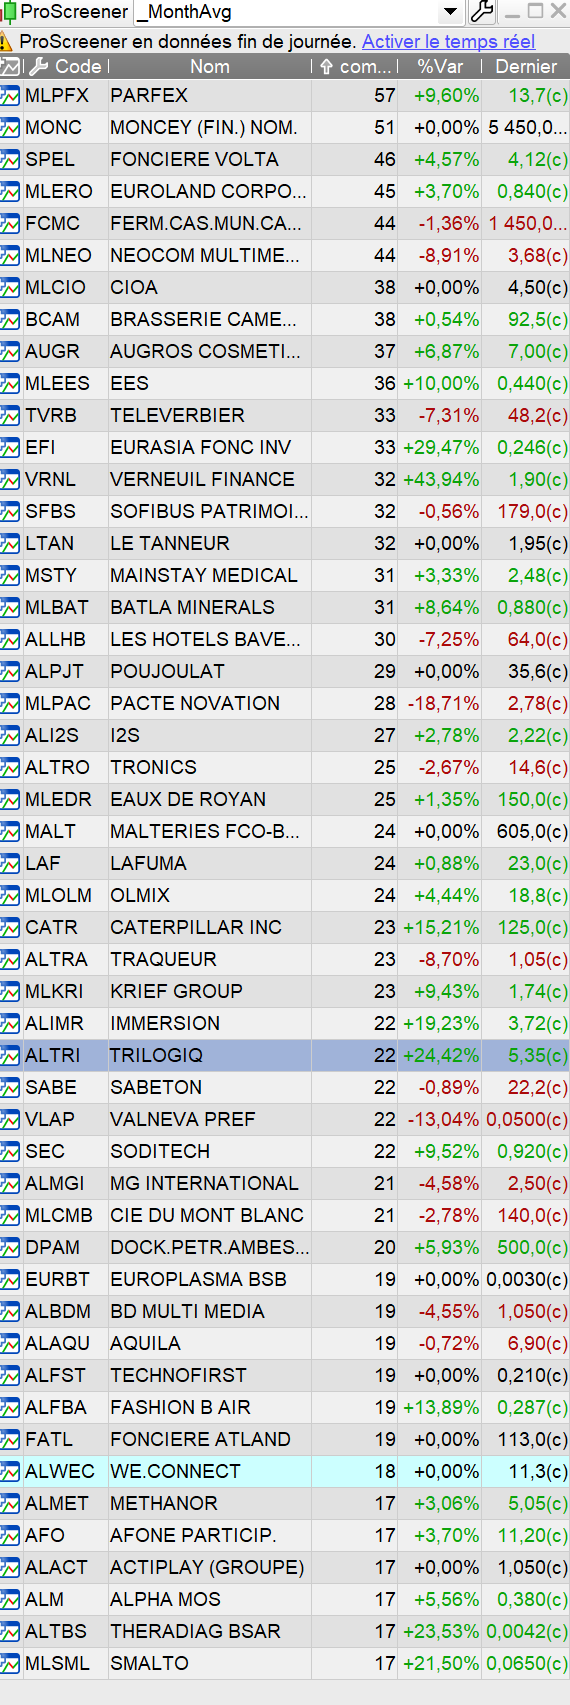
so i don’t understand why some stocks have ‘compteur’ > 20 ( SEE SCREENSHOT ) and value Moving Average is ok ???
here is the proscreener code
timeframe(default)
once monthlyHigh = undefined
once monthlyLow = undefined
once monthlyClose = undefined
once compteur = 0
dailyHigh = DHigh(1)
dailyLow = DLow(1)

if month <> month[1] then
monthlyHigh = Highest[max(1,BarIndex - lastMonthBarIndex)](dailyHigh)
monthlyLow = Lowest[max(1,BarIndex - lastMonthBarIndex)](dailyLow)
monthlyClose = DClose(1)
lastMonthBarIndex = BarIndex

h20 = h19
h19 = h18
h18 = h17
h17 = h16
h16 = h15
h15 = h14
h14 = h13
h13 = h12
h12 = h11
h11 = h10
h10 = h9
h9 = h8
h8 = h7
h7 = h6
h6 = h5
h5 = h4
h4 = h3
h3 = h2
h2 = h1
h1 = monthlyHigh

l20 = l19
l19 = l18
l18 = l17
l17 = l16
l16 = l15
l15 = l14
l14 = l13
l13  =l12
l12 = l11
l11 = l10
l10 = l9
l9  =l8
l8 = l7
l7 = l6
l6 = l5
l5 =l4
l4 = l3
l3 = l2
l2 = l1
l1 = monthlyLow

a20 = a19
a19 = a18
a18 = a17
a17 = a16
a16 = a15
a15 = a14
a14 = a13
a13 = a12
a12 = a11
a11 = a10
a10 = a9
a9 = a8
a8 = a7
a7 = a6
a6 = a5
a5 = a4
a4 = a3
a3 = a2
a2 = a1
a1 = monthlyClose

compteur = compteur+1

endif

tp1=(h1+l1+a1)/3
tp2=(h2+l2+a2)/3
tp3=(h3+l3+a3)/3
tp4=(h4+l4+a4)/3
tp5=(h5+l5+a5)/3
tp6=(h6+l6+a6)/3
tp7=(h7+l7+a7)/3
tp8=(h8+l8+a8)/3
tp9=(h9+l9+a9)/3
tp10=(h10+l10+a10)/3
tp11=(h11+l11+a11)/3
tp12=(h12+l12+a12)/3
tp13=(h13+l13+a13)/3
tp14=(h14+l14+a14)/3
tp15=(h15+l15+a15)/3
tp16=(h16+l16+a16)/3
tp17=(h17+l17+a17)/3
tp18=(h18+l18+a18)/3
tp19=(h19+l19+a19)/3
tp20=(h20+l20+a20)/3

avg20 = (tp1+tp2+tp3+tp4+tp5+tp6+tp7+tp8+tp9+tp10+tp11+tp12+tp13+tp14+tp15+tp16+tp17+tp18+tp19+tp20)/20

CONDITION1 = avg20 > 0
SCREENER[condition1](compteur as "compteur")
Sorry, my fault, you are not using directly a moving average, so the 254-limit does not apply in this case.
Which instruments are you applying the scrrener?
On the Daily TF?
NunoParticipant
Average
The screener is apply in french Stocks on daily Timeframe
I have tested it on many instruments and I think the problem could be that some stocks are not traded everyday and there are many “holes” (some stocks report 1 or 2 tradind days in a month) and this may lead to such odd results.
I’m afraid I cannot be of great help.
NunoParticipant
Average
Thank you Roberto
some stocks (Scor SCR / Fleuri Michon FLE ) in France Stocks with variable ‘compteur’ = 12 are liquid stocks and are traded everyday
If someone have an idea?
NunoParticipant
Average
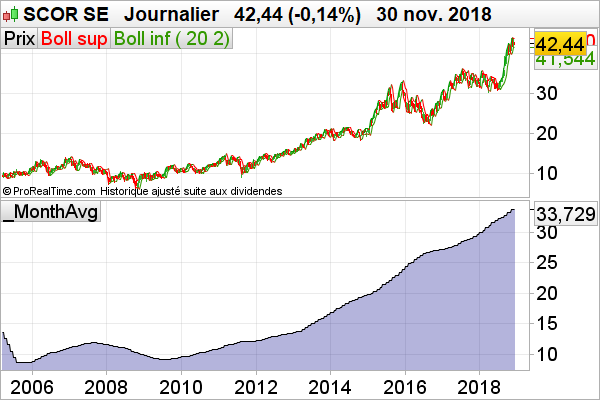
here in a daily graph about SCR with the indicator
all is ok but in Proscreener, value is false
help are welcome
Sorry if I’m wrong but the indicator value compared to the one returned by the screener is not the same in any case:
SCREENER[condition1](avg20)//(compteur as "compteur")
so the 254-limit does not apply in this case.
The 254 bars limit do apply in this case. 254 candlesticks is far from enough to count 20 months on a daily timeframe, so I can’t understand why we get counter of more than 20..because if I change the “compteur” variable incrementing with:
if day<>day[1] then
 compteur = compteur+1
endif
the max value I get is 255..
NunoParticipant
Average
Hi Nicolas,
thank you for your reply
i made de changes about
SCREENER[condition1](avg20)//(compteur as "compteur")
but the moving average value in proscreener is incorrect because compteur < 20 (for average 20 month)
in the monthly and daily charts, moving average value is the same
About the 254 limit, i dont undestand why some value have the variable compteur > 20 . for theses stocks moving average value in Proscreener are ok (se screenshot)
what is false in my code about the variable compteur?
Nothing is wrong in your code, I’m trying to know why your count variable is incrementing while it is not possible due to the bars limitation.
By the way, you’ll not be able to calculate correctly your 20 months moving average in ProScreener on the daily timeframe, and that was the purpose of your initial query. Once I know more about the count issue, I will let you know.
I can now confirm that if the months count increase more than expected is that because some of the instruments haven’t regular quote and therefore less days in a month than as usual.