TickQuest Page link below, download link is top right on the page
http://www.tickquest.com/?page_id=70
Please report back with your thoughts, successes, failures etc?
im using the tickquest and i like it. I like the fact that you see a better range of what to expect and what % ur in. For example a strategy that show max 8 cons losses in backtest, if u run that on say 5000 runs and u see in the results of the monte carlo giving u a range of 4-50 loss in a row and an avg of 20 loss in a row.. That should tell you that you might have to expect more then 8 loss in a row b4 u hit the panic button. same goes for loss in €, wins, profit etc.
One thing i dont like about the monte carlo testing is that you use already optimized backtested data. If your EQ curve is looking nice and results look good, then u cant expect much out of the monte carlo other then a big fat thumbs up. So its basicly like patting yourself on the back saying “good job” when ur actually just looking at the same numbers u have been looking at thru the backtest, just graphed up nicely. Maybe i just dont get the full picture of it?
My understanding is that … yes we use already backtested / optimised variables etc and overall gain is as a result of curve fitting … but monte-carlo testing scrambles the order of the gains and losses and shows if results will still give an overall gain even if trades (gains / losses) don’t come in the order that they do in the backtested price data?
It’s been a while since I even thought about monte-carlo and it’s been a long day working in the garden and spraying my car so I’ll let my brain work on it more while I’m asleep! 🙂
Well yes the monte carlo does scramble the order of things, so it gives u a good “range” of say “Max cons. losses” or other info like that. But still, its based off of trades from an optimized backtest. Im not 100% sure how much i wanna trust it. If ur EQ curve is looking sexy and good and u got like 400+ trades, then scrambling up the trades is probably not gonna “bust” ur system or anything.. Again, i might just not know how to extract the correct information from it.
@Jebus89: Haven’t read everything but with the risk of writing something stupid, I use only OOS-trades for the monte carlo, no insample trades. Using trades you have used for optimization yields an unrealistic result.
For a complete analysis, you can also randomize results between MFE and MAE for each order and re-scramble them, add more or less %win/loss ratio, and even change the normal distribution of them by adding more orders ‘away’ from the mean (+/- 2 or 3 standard deviation, to simulate unexpected trades due to abnormal situation).
Hello,
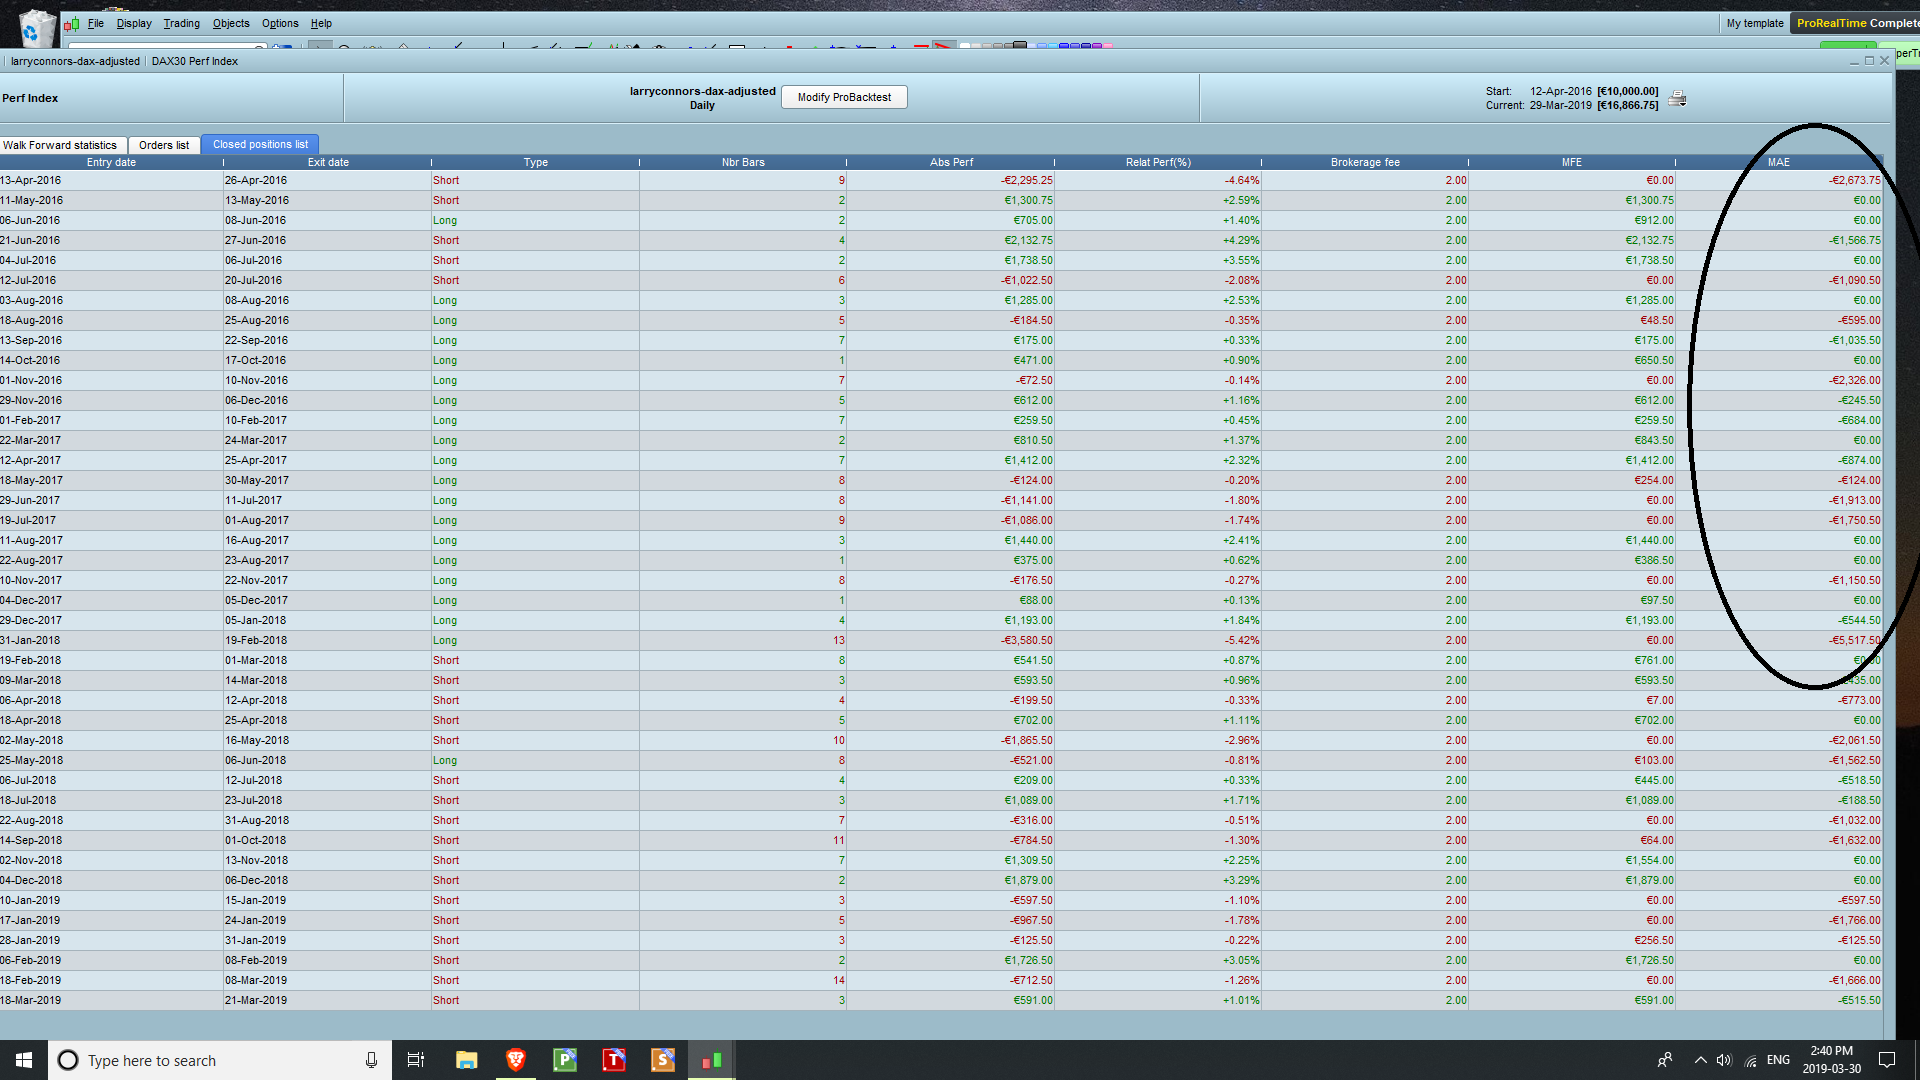
Just checking about PRT data that is used for monte carlo analysis. Sorry I am a newbie here. DO we only used the circled column only to copy to text file before feeding into Monte Carlo analysis software?
Thanks
Sathish
Please do not double post.
Thank you.
DO we only used the circled column
No because then you would be using ONLY the Maximum Adverse Excursion (MAE) figures.
simulate unexpected trades due to abnormal situation).
You need to follow / do what Nicolas is saying in his comment above.
use the ‘Gains’ column to drive the freemc.xls below
OR read / follow the full comment above for the simple method (but not the best).
Read this whole thread first to get useful observations.
Hello,
I was looking for a Monte Carlo simulation and I came across this post, unfortunately the links posted no longer work. Does anyone know how I can do a good Monte Carlo analysis quickly and easily?
Thanks
Try searching this forum for the word MONTECARLO to find links to topics about it.
Google – Free online montecarlo analysis – and loads come up, I would have added a few links, but I think links to external sites are not allowed.
Let us know if you find a good quick, easy one as you mention?
I can’t guys sorry, I tried to search but paid or complex softwares comes up.
I’m looking for a simple tool where I put the list of trades and the analysis comes up. Some time ago I tried going to a link on this post and worked but now it’s no longer available 🙁
Google freemc.xls and the MonteCarlo Simulator shows as the top hit (a download link) under the AI answer.
Instructions on how to use are shown in a tab on the spreadsheet.
Further discussion is available higher up on this Topic.