Not V11 specific but more profound because more Graphs and more History allowed (especially with Premium license) :
I don’t know where the threshold is, but you can work quite “forever” with BackTesting, until one time you have a Graph (command) or too many history for PRT to cope with. Then this starts to creep in …
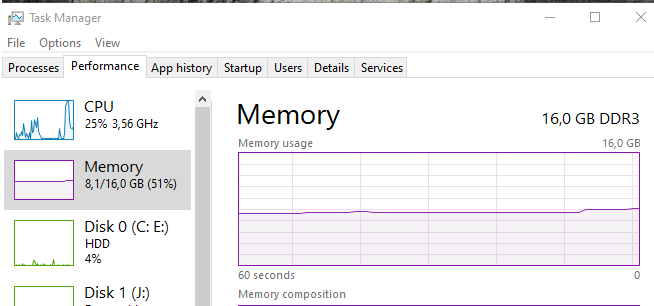
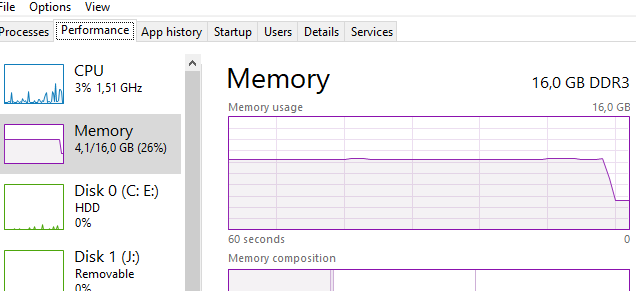
See first attachment. Know that my normal memory usage with one instance of PRT (Demo) is 6.2 or so GB. Without the PRT instance it is ~4GB. You will trust me on that. Now, this first memory plot (attachment) shows that over the course of a last minute things suddenly start to worsen. Why ? well, the base is that just one Graph too many or that number of bars too many. Thus, just preceding this happening I indeed increased the number of bars (FYI, from 50K o 100K). I did not change the number of Graphs, although as a matter of fact I removed one. I feel this removal is related (so PRT, please read carefully, while I try to write carefully).
This first memory plot does NOT show an increase of memory usage because of running that BackTest. Oh, it might a little, but this is not what you see. What you see is me starting to type in the Editor. So each increase is a new attempt to type some words. And that stalls until new memory has been allocated … Mind the course of 60 seconds you see there.
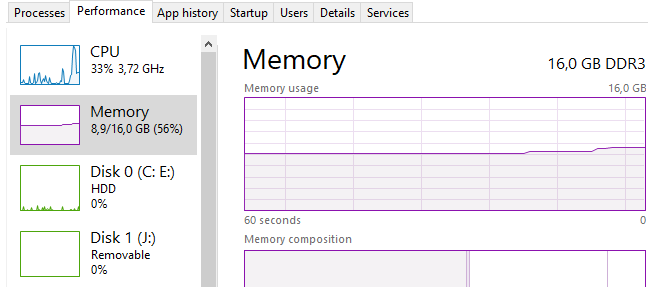
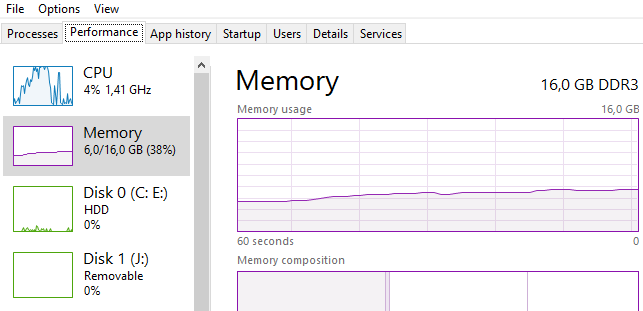
The second plot actually tells where (time period) I made the screenshot of that first plot. No memory increase (first ~45 seconds) because I was not typing but making a screenshot. Easy to see where I started typing in the Editor again. But also easy to see how long it took before my typed word appeared … that’s from where the memory increases until where it is stable again. This is something like 15 seconds, while groups of characters may appear. And look what happens with the amount of memory … a sheer 800MB is consumed additionally over the course of those 15 seconds.
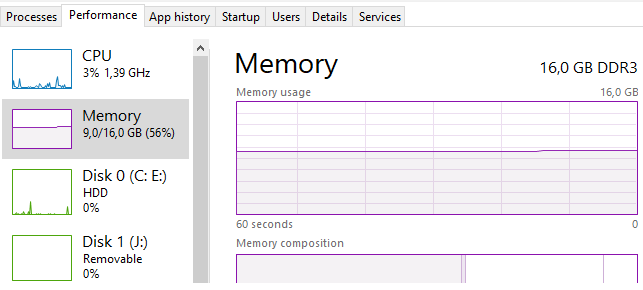
3rd plot same thing, but more again. It is getting more and more difficult now. And you can see that in the 4th plot;
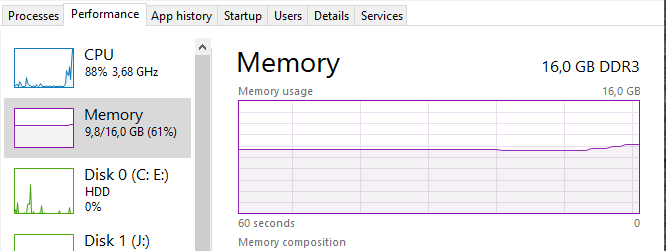
The 4th plot shows that memory is freed (this is again quite al lot although I did not capture the amount, but right after that things explode. The decrease seems related (though not sure at all). But notice that in again 15 secs or so, the amount will have increased with close 1.5GB or more and I recall I wasn’t even typing. I only gave PRT the focus (after making the screenshot).
The explosion really happened, see in the next post.
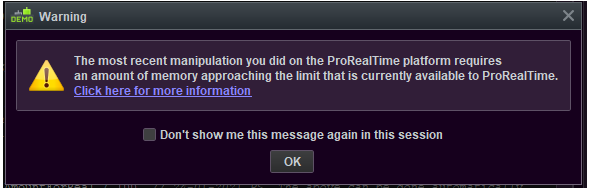
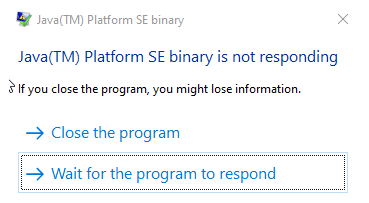
After I very briefly saw a Java error plus an “has to close” while nothing closed that I could see/notice, the to many well known error message appears. See 1st attachment.
Once this message appears, things are definitely out of order and will not recover anymore. We have actually seen why. Mind you, I just stopped the platform because I know from a 100 times before.
Never tick that “Don’t show me this message again in this session” because you WILL lose your lastly typed program code (etc.). Push it too far (click away this message a couple of times) and you will receive the message at the attempt to save. And if not that, PRT will just quit on you.
The 2nd attachment shows where I quit and that indeed my normal memory usage is ~4GB. The third attachment shows where I restarted the platform and that now the “base” memory usage is ~6GB. This will grow to ~6.8GB over the course of BackTesting, until it is pushed to hard and things collapse. Mind you, this is well within the boundaries of of the total memory, so it is PRT internally which reaches (self set ?) limits.
Before someone or PRT comes up with it : I know that there’s a memory setting somewhere (how much PRT is allowed to use) and I recall that it defaults to 2GB. However :
- when I increased that (a year ago or something) it did not help for the session);
- it is not sustained to the next session (plus that makes it not possible to check whether it works in the first place);
- I can not find that setting any more (looked again for it a couple of months ago).
… but that does not matter much because what’s first is that something goes wrong. And Yes, that moment may be increased when first more memory is allowed so that this whatever threshold of error is not crossed. But still something would be wrong.
Please notice that the other day I applied a test (the one for Nicolas) at PRT-IG (what you see here is all PRT-IB). At a second run of a same test which took 1:30 initially (with 8 seconds at PRT-IB), there just never was an answer after more than 8 minutes and I aborted that particular (back)test. Might it be of importance for PRT, right after that the PRT-IB same test still took 8 seconds. Thus :
It really is the PRT instance failing and not the PC / OS.
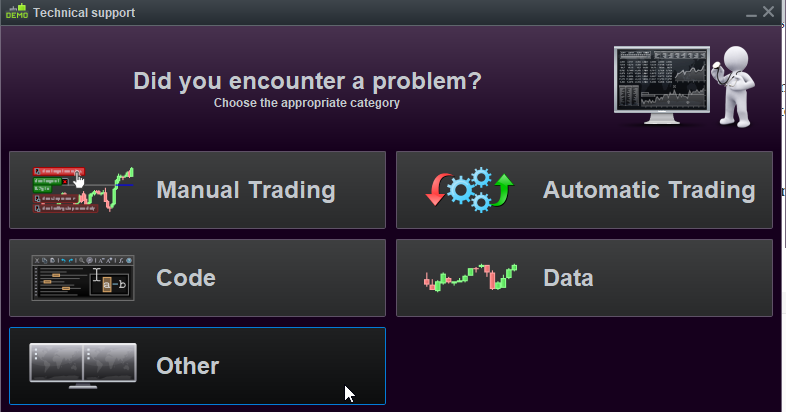
People, please feel free to add your experiences which you feel may be related. It may help PRT to focus on the issue. Next time I am experiencing the message (only then) I will
- Go to Help;
- Choose Technical support;
- Choose other (see 4th attachment);
- Select the chart/instrument I was backtesting;
- Refer in the accompanying text you may add to this topic hence issue in the Bugs List. Try to describe shortly what you *think* may have caused the happening.
- Save, Quit and restart (for your own sake).
I think you should do that too, whenever you experience this message.
Also relevant : today I wasn’t working with PRT for even 30 minutes. So it really is not the length of time slowly increasing the fault. No, it is just passing that unknown threshold.
It just happened again. All I can prematurely conclude is that it is not the number of bars, but merely the number of Graphs. After a fresh restart I added a Graph and at a first BackTest of 10K bars only, I could see it starting to happen again by means of Editor hiccups and memory increase cause by typing in the editor again.
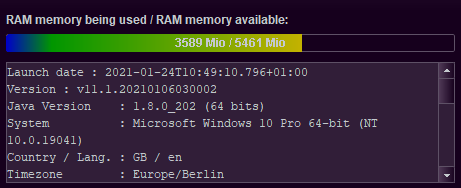
I sent in the technical report, which form interestingly shows the available memory to PRT (as it tells) as well. See attachment 1.
In attachment 2 you see the Java “message” I was talking about. It only says “not responding”. Adding things up, all is quite correct / consistent for memory usage. But something in PRT can’t cope once above 8.5 or so GB for total system-memory usage. Maybe make that 4GB of PRT usage, because at least 4GB is a physical limit in software. Or at least that is a limit which requires a different means of programming.
FYI : because I see the standard PRT usage as 2GB on top of my normal usage (totals to 6GB), as a debugger it could tell me that with that next 2GB which PRT is trying to allocate (total memory grows to above 8GB), … that this last 2GB would really be a severe limit because it is a 32bits limit for internal memory (like array) usage.
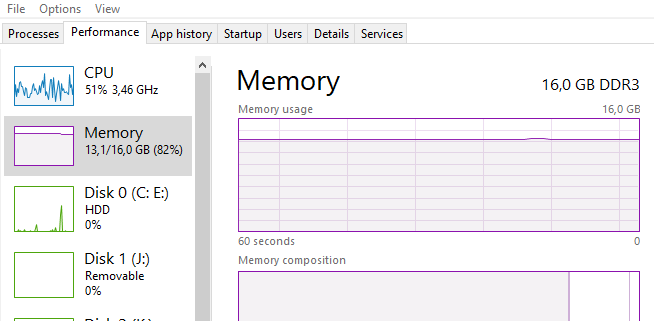
I could even go as far as pre-allocated contiguous memory crossing its “limit” why things not only start to collapse (non contiguous memory is infinity slower to reach) but also start to increase the cpu usage (you can see in the 80%’s in one of the first pictures (in the topic’s first post)). Notice PRT : If you don’t use contiguous memory blocks, then this can’t be the issue. You would use them explicitly (and it is merely OS systems programming usage, which, however, can be applied in Usermode).
Last data I can provide for now, is that I am also having a few (maybe 8-12 ?) GraphOnPrice graphs active, and these are definitely “killing”. In my stage of current (back)testing I can get rid of those easily, so I can most probably also tell easily whether that helped or not (I suppose it does).
In a next post I will try to be more conclusive on that.
The cause of the “collapse” was coincidentally worked out in an other topic, starting at this post.
The conclusion in brief, as written in that topic near the current last post :
PRT, two bugs spring from this :
– The system not behaving once that threshold is crossed (hence try to solve that internal limit);
– The system consuming a lot of memory just and only because of too many strategies / codes (/ Indicators ??) in there. Maybe that can be solved as well.
Today I can add that more backtested systems (more instruments) will add to the memory consumption. This is probably logical. However, the one instrument added that caused to cross that threshold once again, does not cause the memory consumption to decrease when that instrument is thrown off of the screen, together with all its backtest related forms (this goes automatically).
Of course it may depend on the organisation of the PRT program (I now refer to like C++, Java), but I would say that this is a typical “memory leak” (handles are not freed to the system pool of resources).
PS: In this situation I can’t even move screens around any more, only in that Paper instance of PRT. The other instance I have running, is still super smooth. I said it before, it is the PRT instance that blows up itself. The PC remains fine.
Edit to my last post : It actually is dangerous to conclude that the memory is not freed by means of the screenshot I gave in there. This is because the Garbage Collection of Windows also plays a role.
The attachment below speaks better (it is the top one there, and I know it did not decrease because I have been observing it).