Is there a maximum number of lines of code allowed in a strategy or indicator?
The reason I ask is bec
ause I am trying to code a strategy that only uses two variables and trying to get it to simulate every possible combination of these with variables with values between 5 and 200 step 5 for each. The strategy then uses the values that have been most profitable up to the current time or maybe most profitable recently. Due to the lack of arrays in PRT this means an awful lot of repetitive code so before I progress further I would be interested to know if I will hit a limit of maximum lines of code allowed.
Anyone (Nicolas!) know if there is a maximum limit?
Obviously I must be on to something as after hours of coding and just getting to the point of where things were working nicely PRT crash closed on me and I lost everything!
Is there an “autosave” (every n sec or minutes…) function to enable in PRT to avoid what happened to Vonasi ??
As far as I am aware there is no auto-save. I usually just hit CTRL+S regularly but for some reason hadn’t done so for a while. Still it meant that when I started coding it again it was neater and tidier and more efficient than version 1 so it wasn’t a total disaster.
 Leo
LeoParticipant
Veteran
1200 lines is my longest experiment
when I started coding it again it was neater and tidier and more efficient than version
Yes I always make myself do this whenever anything goes wrong / fails … in DIY jobs or any task … make me feel loads better as I get an improvement I wouldn’t have if the job had not gone wrong!
Making Good out of Bad I always say.
Sounds another interesting project you are attempting Vonasi, I can’t keep up with even reading and understanding all your investigations! 🙂 I
look forward to findings / results on this one!
t
I lowered my expectations of my ability to endure repetitive coding and have now coded a strategy of only 9623 lines! I wish we had arrays but then from discussions elsewhere on here I don’t think that the PRT engine could cope with the loops needed to fill the arrays with values anyway – so repetitive coding it is for now. I have now found out that find and replace is horribly slow when you try to replace thousands of items at a time!
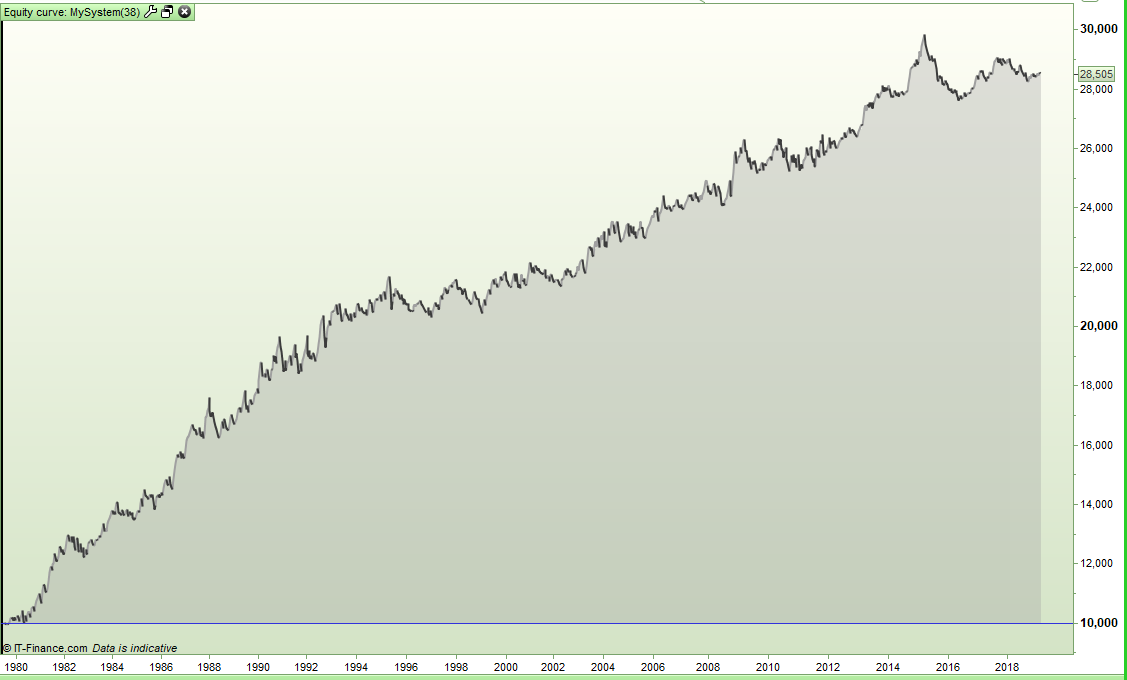
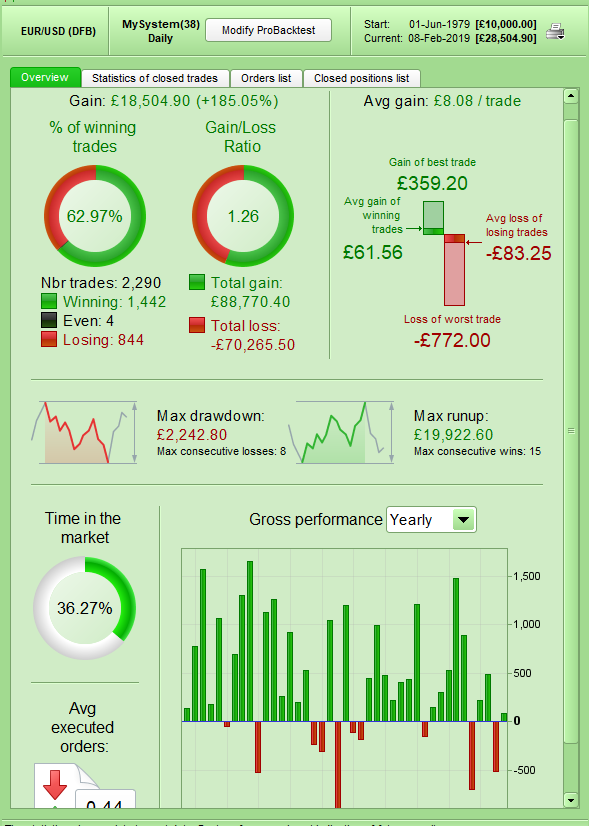
So I now have a strategy that checks 400 combinations of variables x and y (10 to 200 in steps of 10) in a simulated strategy to see which combination of x and y has been the most profitable up to this moment in time. It then uses just the best set of variables in a very simple mean reversal strategy on the EURUSD Daily. First test results seem promising:
[attachment file=90844]
[attachment file=90845]
It appears that the values of 40 and 30 have been the most profitable since about mid 1995 which highlights to me that just looking at all time profitability might not be the best way to select variable values. So I am now working on a modified code with a third variable (p) in a loop that should allow me to base the decision on what look back period combined with what x and y values has been most profitable recently. Unfortunately this means modifying 400 different sections of code! I imagine the resulting strategy will be horrifically slow to compute as it will possibly be calculating 80000 possible combinations for every bar so I may have to lower my expectations again!
t appears that the values of 40 and 30 have been the most profitable since about mid 1995 which highlights to me that just looking at all time profitability might not be the best way to select variable values.
Would not using the normal optimiser since mid 995 give 40 and 30 as the top 2 anyway??
Or am I missing the point again?? 🙂
I guess your method shows what period gives the more consistent results??
At the moment this is just an experiment to see if it is possible to build a self optimizing strategy that can adjust itself as markets change to try to adapt the new market environment. Whether this is more profitable than just picking a fixed set of values is yet to be seen.
The values 40 and 30 might not have been the most profitable from 1995 onwards – maybe they just went into the lead at that point and were never overtaken. Perhaps 50 and 60 had made a loss up until 1995 and then suddenly became very profitable but because they started their recovery from such a low starting point in 1995 they never took the lead even though they made more money from 1995 onwards than 40 and 30 did. Hence why I am now modifying the idea with a third variable for a look back period so that we just look at recent data and see what has been most profitable recently. The idea is to also have this look back period as self optimizing too.
The strategy that I am basing it on appears to be profitable across a very broad range of values for x and y but some of the equity curves are more up and down than others. The hope is that a self optimizing strategy could adjust itself if it finds that it is entering a dip and switch to values that have been recently the most profitable.
The hope is that a self optimizing strategy could adjust itself if it finds that it is entering a dip and switch to values that have been recently the most profitable.
Sounds a great idea … I hope it works!
Its like we do visually by looking at the ‘best profile‘ equity curve when judging which values of variables to use out of several of the optimiser results.
I often check equity curves for 4 to 6 vales for each variables before I decide on the curve profile I prefer etc.
LeoParticipant
Veteran
to build a self optimizing strategy that can adjust itself as markets change to try to adapt the new market environment
That is Machine Learning!
This is what I try to build in the forum of Neural Network!
Yes – but I am starting with a strategy that is already pretty good and just trying to make it a little more robust and adaptive rather than starting with some conditions and seeing if machine learning can turn it into a profitable strategy. Really I’m just re-optimizing at each bar close. It may turn out to be more profitable or more robust or it might just leave me a bit out of synch with the market! I’m just over 50% through modifying my code at the moment – crashes allowing I hope to be finished and tested tomorrow.
I was able to finish the code today and have even managed one or two test runs. It is very slow to calculate a back test and the fact that it is Saturday and the bar behind our boat that I am ‘borrowing’ wifi from is very busy so the internet keeps dying on me and so the tests crash to a stop isn’t helping! Any how I have managed to see some results – I won’t post any images at the moment as I am still trying to get a feel for how this 10000 line ‘monster code’ works and to get an idea of what the results are actually telling me.
So far I have the datum/baseline of what seems to be a good strategy that is profitable over a broad range of two x,y variable values. The best set of optimized variables in this baseline strategy has so far beaten every other test with self auto optimizing strategies that I have carried out so far – and the equity curve of this base line strategy has also been the smoothest of them all so far.
I also have the results of my second test strategy which has two variables self optimizing between the values of 10 and 200 step 10 and only trading using the pair of values that has in all of history so far been the most profitable. This seemed to settle on x, y values in 1995 and then never change them after that. The third test was auto optimizing x, y and with an auto optimizing look back period of p to select x and y values in whatever p length look back period has achieved the best gain/per day with the most profitable x and y values for this look back period. The fourth test was to try various fixed look back periods of p in this last strategy to try to see if just one p value was better than a self optimizing p value.
Hopefully I will come to some conclusions soon. My first impressions are that the original strategy is too good! Auto optimizing multiple values seems to make it less profitable in the past although still a good strategy. Only forward testing will tell us if each new development is more robust than the baseline strategy. My first thoughts are that I am just automating the optimizing and it is a bit like doing a mini walk forward test and then using the last set of values that worked – but just because they are the last values that worked does not mean that they will work in the future any better than some other fixed value. Interestingly when I go from auto optimizing two variables to auto optimizing three the performance gets worse which sort of confirms that more complicated is probably more curve fitted whether that is manual curve fitting or auto curve fitting.
Having read my last post I came to the conclusion that it is a bit confusing! So here is a tiny section of my strategy to give an idea of what I am doing and maybe clarify it a little:
best = 0

for pstart = 1 to 40
ps = pstart * 10

//strategy010010
x010010 = 10// simulated x
y010010 = 10// simulated y

c1s010010 = (simulated price action condition)
c2s010010 = (simulated indicator long entry condition using simulated x and y value)
c3s010010 = (simulated indicator short entry condition using simulated x + y value)

if c1s010010 and c2s010010 then
tots010010 = tots010010 + (close - open)
endif

if not c1s010010 and c3s010010 then
tots010010 = tots010010 + (open - close)
endif

best = max((tots010010 - tots010010[ps])/ps , best)
if ((tots010010 - tots010010[ps])/ps) = best then
x = x010010
y = y010010
p = ps
endif

//strategy010020
x010020 = 10 //simulated x
y010020 = 20 //simulated y

c1s010020 = (simulated price action condition)
c2s010020 = (simulated indicator long entry condition using simulated x and y value)
c3s010020 = (simulated indicator short entry condition using simulated x + y value)

if c1s010020 and c2s010020 then
tots010020 = tots010020 + (close - open)
endif

if not c1s010020 and c3s010020 then
tots010020 = tots010020 + (open - close)
endif

best = max((tots010020 - tots010020[ps])/ps , best)
if ((tots010020 - tots010020[ps])/ps) = best then
x = x010020
y = y010020
p = ps
endif

//strategy010030
x010030 = 10 //simulated x
y010030 = 30 //simulated y

c1s010030 = (simulated price action condition)
c2s010030 = (simulated indicator long entry condition using simulated x and y value)
c3s010030 = (simulated indicator short entry condition using simulated x + y value)

if c1s010030 and c2s010030 then
tots010030 = tots010030 + (close - open)
endif

if not c1s010030 and c3s010030 then
tots010030 = tots010030 + (open - close)
endif

best = max((tots010030 - tots010030[ps])/ps , best)
if ((tots010030 - tots010030[ps])/ps) = best then
x = x010030
y = y010030
p = ps
endif
//
//
//
//and on and on with more simulations for every combination of x and y that you wnat to use for auto optimizing. 10 to 200 step 10 = 400 combinations in totzl!
//
//
//
next

//Real Strategy
c1 = (price action condition)
c2 = (indicator long entry condition using best x and y)
c3 = (indicator short entry condition using best x + y)

sell at market
exitshort at market

if c1 and c2 then
buy 1 contract at market
endif

if not c1 and c3 then
sellshort 1 contract at market
endif
next

graph x coloured(128,0,0)
graph y coloured(0,128,0)
graph p coloured(0,0,0)
I have truncated the code to remove 9900 repeating lines just so that you can see the bones of what I am testing.
The plan is to turn it into an indicator that simulates trades and provides a value for x and y that a strategy can use to trade via CALLing the indicator.