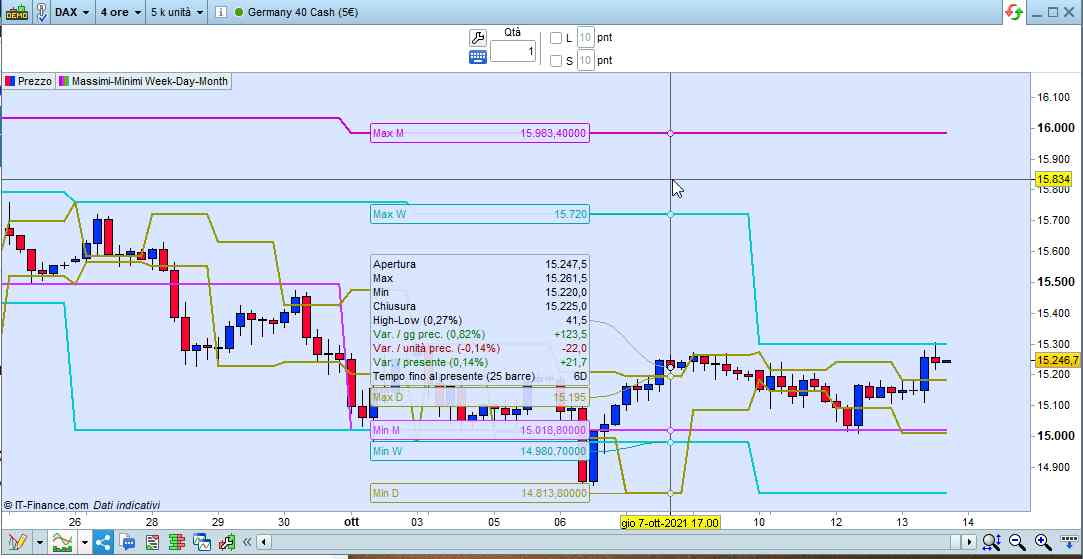
” non gira sotto versione 10.2 – non riconosce drawonlastbaronly” è semplicemente una serie di massimi e minimi da tracciare sul grafico” uso prorealtime e t3 webank – sulla prima è perfetto sulla seconda non funzione. Mi serve averla sulle due piatte e gira solo sulla prima” vi condivido il mio listato di due anni fà con la speranza che qualcuno sappia rattopparlo. Grazie “
defparam drawonlastbaronly = true
hk = highest[500](high)
lk = lowest[500](low)
hh = highest[250](high)
lH = lowest[250](low)
hs = highest[125](high)
ls = lowest[125](low)
hm = highest[22](high)
lm = lowest[22](low)
hw = highest[10](high)
lw = lowest[10](low)
DRAWHLINE(dhigh(0))coloured(0,255,0)
DRAWHLINE(dhigh(1))coloured(0,255,0)
DRAWHLINE(dhigh(2))coloured(0,255,0)
DRAWHLINE(dhigh(3))coloured(0,255,0)
DRAWHLINE(dhigh(4))coloured(0,255,0)
DRAWHLINE(dhigh(5))coloured(0,255,0)
DRAWHLINE(dlow(0))coloured(255,0,0)
DRAWHLINE(dlow(1))coloured(255,0,0)
DRAWHLINE(dlow(2))coloured(255,0,0)
DRAWHLINE(dlow(3))coloured(255,0,0)
DRAWHLINE(dlow(4))coloured(255,0,0)
DRAWHLINE(dlow(5))coloured(255,0,0)
DRAWHLINE(hk)coloured(0,0,0)
DRAWHLINE(lk)coloured(0,0,0)
DRAWHLINE(hh)coloured(0,0,0)
DRAWHLINE(lH)coloured(0,0,0)
DRAWHLINE(hs)coloured(0,0,0)
DRAWHLINE(ls)coloured(0,0,0)
DRAWHLINE(hm)coloured(0,0,0)
DRAWHLINE(lm)coloured(0,0,0)
DRAWHLINE(hw)coloured(0,0,0)
DRAWHLINE(lw)coloured(0,0,0)
Voffset = 5*pipsize
DRAWTEXT(“MAX DUE ANNI”,barindex-60,hk+Voffset,SansSerif,Bold,16)coloured(153,153,0)
DRAWTEXT(“MIN DUE ANNI”,barindex-60,Lk+Voffset,SansSerif,Bold,16)coloured(255,0,0)
DRAWTEXT(“MAX ULTIMO ANNO”,barindex-40,hH+Voffset,SansSerif,Bold,16)coloured(153,153,0)
DRAWTEXT(“MIN ULTIMO ANNO”,barindex-40,LH+Voffset,SansSerif,Bold,16)coloured(255,0,0)
DRAWTEXT(“MAX SEMESTRE”,barindex-28,hS+Voffset,SansSerif,Bold,16)coloured(153,153,0)
DRAWTEXT(“MIN SEMESTRE”,barindex-28,LS+Voffset,SansSerif,Bold,16)coloured(255,0,0)
DRAWTEXT(“MAX MENSILE”,barindex-15,hM+Voffset,SansSerif,Bold,16)coloured(153,153,0)
DRAWTEXT(“MIN MENSILE”,barindex-15,LM+Voffset,SansSerif,Bold,16)coloured(255,0,0)
DRAWTEXT(“MAX SETTIMANALE”,barindex,hW+Voffset,SansSerif,Bold,16)coloured(153,153,0)
DRAWTEXT(“MIN SETTIMANALE”,barindex,LW+Voffset,SansSerif,Bold,16)coloured(255,0,0)
DRAWTEXT(“MAX oggi”,barindex-0,dhigh(0)+Voffset,SansSerif,Bold,10)coloured(153,153,0)
DRAWTEXT(“MAX ieri”,barindex-1,dhigh(1)+Voffset,SansSerif,Bold,10)coloured(153,153,0)
DRAWTEXT(“MAX ieri-2”,barindex-2,dhigh(2)+Voffset,SansSerif,Bold,10)coloured(153,153,0)
DRAWTEXT(“MAX ieri-3”,barindex-3,dhigh(3)+Voffset,SansSerif,Bold,10)coloured(153,153,0)
DRAWTEXT(“MAX ieri-4”,barindex-4,dhigh(4)+Voffset,SansSerif,Bold,10)coloured(153,153,0)
DRAWTEXT(“MAX ieri-5”,barindex-5,dhigh(5)+Voffset,SansSerif,Bold,10)coloured(153,153,0)
DRAWTEXT(“MIN oggi”,barindex-0,dlow(0)+Voffset,SansSerif,Bold,10)coloured(255,0,0)
DRAWTEXT(“MIN ieri”,barindex-1,dlow(1)+Voffset,SansSerif,Bold,10)coloured(255,0,0)
DRAWTEXT(“MIN ieri-2”,barindex-2,dlow(2)+Voffset,SansSerif,Bold,10)coloured(255,0,0)
DRAWTEXT(“MIN ieri-3”,barindex-3,dlow(3)+Voffset,SansSerif,Bold,10)coloured(255,0,0)
DRAWTEXT(“MIN ieri-4”,barindex-4,dlow(4)+Voffset,SansSerif,Bold,10)coloured(255,0,0)
DRAWTEXT(“MIN ieri-5”,barindex-5,dlow(5)+Voffset,SansSerif,Bold,10)coloured(255,0,0)
period = 500
Yhh = highest[period](high)
Yll = lowest[period](low)
FOR i = 0 to period do
if high[i] = Yhh then
Xhh = barindex[i]
endif
if low[i] = Yll then
Xll = barindex[i]
endif
NEXT
DRAWVLINE(Xhh)coloured(0,200,0)
DRAWVLINE(Xll)coloured(200,0,0)
period = 250
Yhh = highest[period](high)
Yll = lowest[period](low)
FOR i = 0 to period do
if high[i] = Yhh then
Xhh = barindex[i]
endif
if low[i] = Yll then
Xll = barindex[i]
endif
NEXT
period = 125
Yhh = highest[period](high)
Yll = lowest[period](low)
FOR i = 0 to period do
if high[i] = Yhh then
Xhh = barindex[i]
endif
if low[i] = Yll then
Xll = barindex[i]
endif
NEXT
period = 22
Yhh = highest[period](high)
Yll = lowest[period](low)
FOR i = 0 to period do
if high[i] = Yhh then
Xhh = barindex[i]
endif
if low[i] = Yll then
Xll = barindex[i]
endif
NEXT
period = 10
Yhh = highest[period](high)
Yll = lowest[period](low)
FOR i = 0 to period do
if high[i] = Yhh then
Xhh = barindex[i]
endif
if low[i] = Yll then
Xll = barindex[i]
endif
NEXT
DRAWVLINE(Xhh)coloured(0,200,0)
DRAWVLINE(Xll)coloured(200,0,0)
DRAWVLINE(Xhh)coloured(0,200,0)
DRAWVLINE(Xll)coloured(200,0,0)
DRAWVLINE(Xhh)coloured(0,200,0)
DRAWVLINE(Xll)coloured(200,0,0)
DRAWVLINE(Xhh)coloured(0,200,0)
DRAWVLINE(Xll)coloured(200,0,0)
RETURN