Hi,
I have one more scan that I would like to get some code for.
I would like to create a scan when these 3 moving averages are very tight together (same price) but I wondering is it possible to have a small variable so if they are not exactly the same it will still show results?
Exponential moving average 6
Moving average 10
Exponential moving average 20
I have been watching the videos on how to wright simple code but still finding it hard to get my head around it. Is there any other even more basic videos that I can view? just so that I can learn to code as well.
Cheers,
Jack
You need to define what the ‘small variable’ is. In this code it is that the lines are all within a percentage of price.
percentage = 0.25

a = exponentialaverage[6]
b = average[10]
c = exponentialaverage[20]

upper = max(max(a,b),c)
lower = min(min(a,b),c)

d = ((upper - lower) / close) *100

e = d <= percentage

SCREENER[e]
Thank you so much! that is what I am after!
O I just had a thought. Does this scan for stocks that are layered with the MA’s 6, 10 and 20 (top to bottom)? How can I add it so that it doesn’t have to be any order?
Just that some of the stocks that I have found with the MA’s tight are not coming up on the scan.
Sorry to be a pain.
Cheers,
Jack
I have found a number of stocks that do not come under this scan, but yet they are under the parameters of what the scan is looking for.
What could be wrong?
The screener does not care what order the lines are in. It just checks the distance between the highest line and the lowest line and compares it to price.
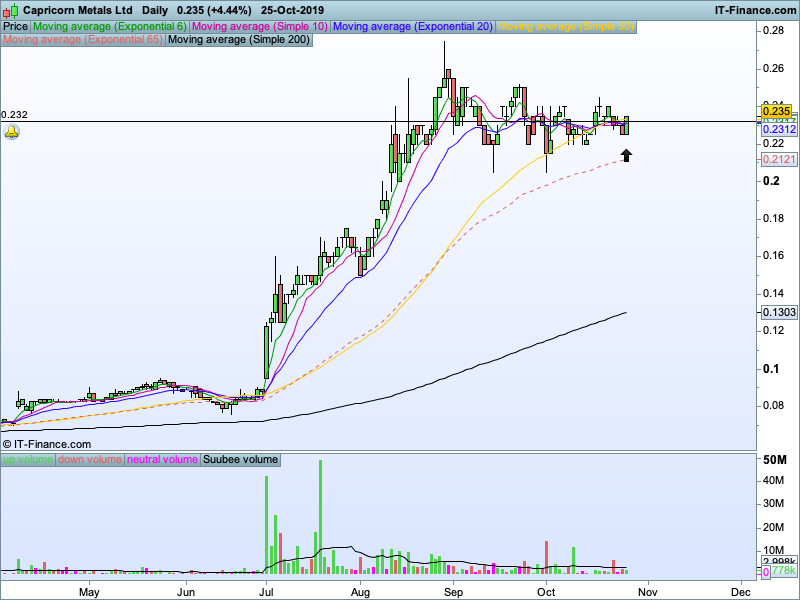
What % of price are you testing for? I notice that one of your images has a price of 0.234 so if you are looking for a maximum gap of say 0.25% between the highest and the lowest line then they must be just 0.000585 apart or less.
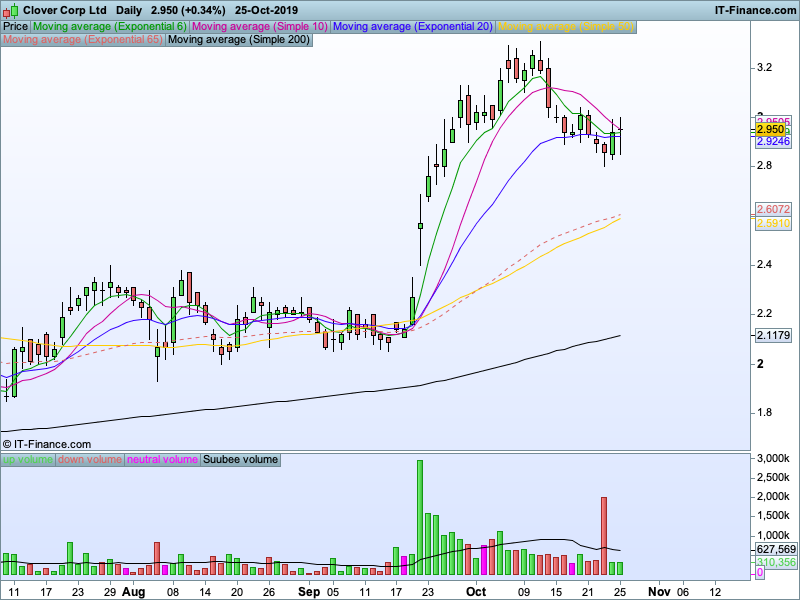
The other image has a price of 2.950 so they would need to be <= 0.007375 apart.
Try increasing the percentage setting if it is missing stocks that you think it should be detecting.
Don’t really have a specific % in mind just wanted to get all the stocks that had the MA’s really tight together so I could choose which ones I thought had the best set ups.
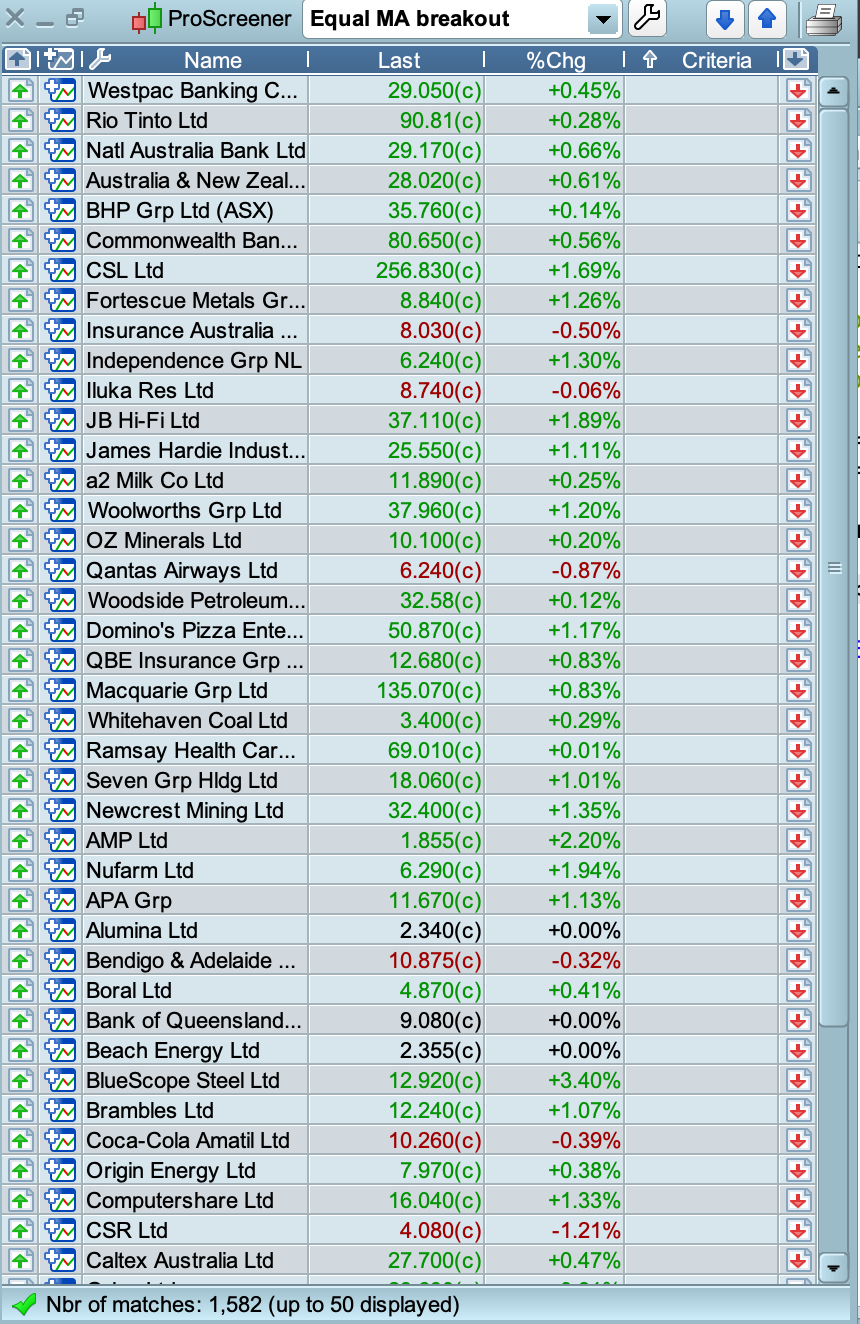
I increased it all the way up to 20% and still didn’t those ones, looks like it’s only finding the larger cap names. Odd.
20% of price would allow the lines to be very far apart indeed!
Yes, I know I have just tried every different % change and it still wont find these stocks from .00002 up to 100%
Wonder what it could be? Super strange
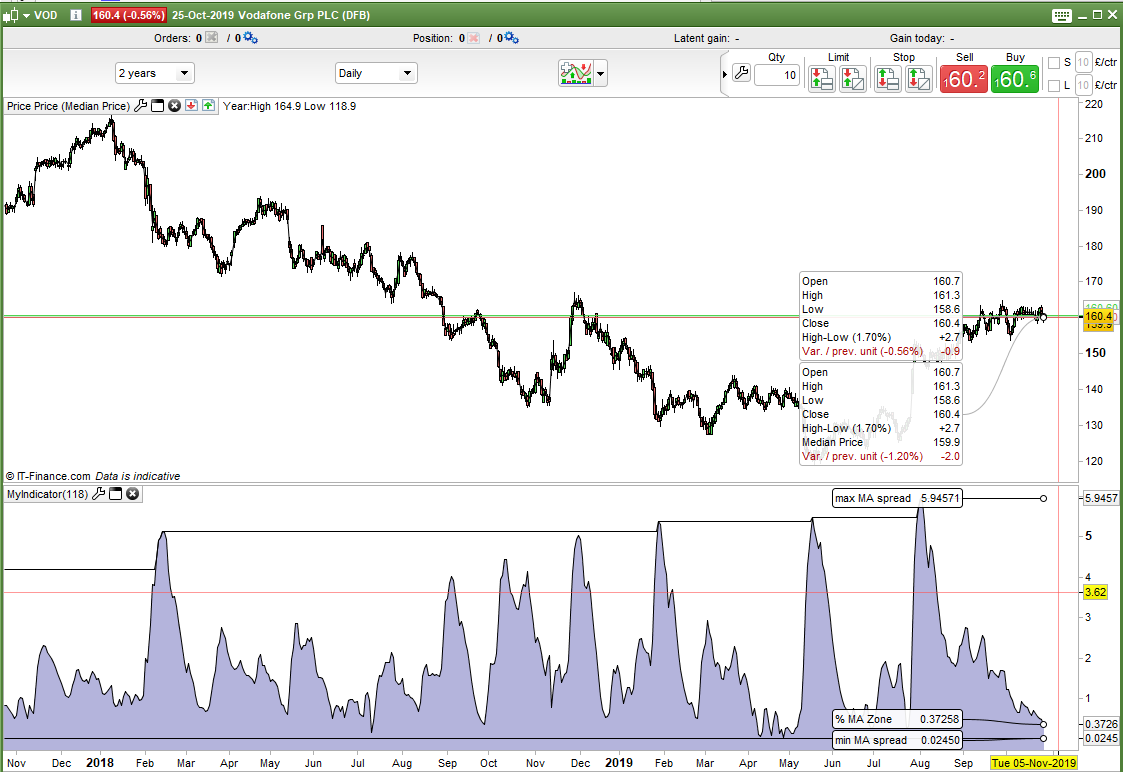
Add this indicator to any chart as a separate indicator and you can see what the current percentage is as well as the historical maximum and minimum spread of the highest to lowest average.
a = exponentialaverage[6]
b = average[10]
c = exponentialaverage[20]

upper = max(max(a,b),c)
lower = min(min(a,b),c)

d = ((upper - lower) / close) *100

if c > 0 then
if minapart = 0 then
minapart = d
endif

maxapart = max(d,maxapart)
minapart = min(d,minapart)
endif

return d as "% MA Zone", maxapart as "max MA spread", minapart as "min MA spread"
Okay thank you so much I really appreciate it 🙂
Both codes above added as Log 183 and 184 to here …
Snippet Link Library
How can I adjust the price range for this scan?
Cheers
Sorry but I don’t understand what you mean by ‘adjust the price range for this scan’.
Sorry I was half asleep when I wrote that.
I would like to narrow the range of stocks I am scanning for, stocks that are priced from .05 to 7 dollars or what ever I am wanting to narrow my search.
Hope that makes sense?
Thank you in advance,
Jack