Difference between LinearRegression and LinearRegressionSlope?
Forums › ProRealTime English forum › ProBuilder support › Difference between LinearRegression and LinearRegressionSlope?
- This topic has 4 replies, 4 voices, and was last updated 3 years ago by
JS.
-
-
01/16/2021 at 9:00 PM #158093
I am having trouble using the LinearRegressionSlope and LinearRegression indicators. The help texts do not provide enough information, so I decided to ask this forum.
- if I want to calculate a regression line using the last “N” daily bars, it has to be calculated on the last “N-1” daily returns. When using the LinearRegressionSlope function, do I have to use “N” or “N-1” as a parameter in brackets? If I want to calculate on the last 100 bars, should I use LinearRegrassionSlope[100](close) or LinearRegressionSlope[99]
- the number returned by the LinearRegressionSlope function, is it given in % or in “$/day”?
- the number returned by the LinearRegression function, is it the intercept? is it given in $?
If someone could provide some light, it would be very helpful to me. I am unable to match the figures returned by these 2 function with those calculated on an excel spreadsheet.
Thanks in advance
01/16/2021 at 9:54 PM #158095LinearRegrassionSlope[100](close) will return the value calculated on the last 100 bars including the still currently forming bar.
LinearRegrassionSlope[100](close[1]) will return the value calculated on the last 100 bars calculated at the close of the bar prior to the still currently forming bar. i.e yesterdays value at closing price on a daily chart.
Where are you getting your Excel spreadsheet data from because if it is not identical to the data feed from your broker to the PRT platform then the calculated result is very unlikely to be identical?
01/17/2021 at 8:15 PM #158192Thank you very much for your quick reply,
In PRT, I use the close adjusted by dividends and splits
In Excel, I use Yahoo Finance historical data, of which I use the “adjusted-close” column.
I think I found the mismatch, and everything is now OK.
What happened was that with candlesticks, I used data for close to close[66]. However, for the LinearRegressionSlope function I have to use 67 candlesticks.
Thank you very much
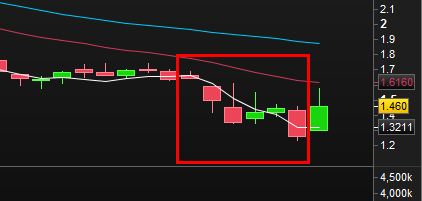
05/15/2022 at 1:00 AM #193194Does anyone know what the figure returned by the Linear Regression Slope function means?
It should mean rate of change of Y divided by rate of change of X. For the 6 candle range on stock I am using it on this would mean about 20 price points over 6 candles, resulting in -3.33.
However the figure it is giving me is -0.058. I cant correlate that to the visible slope (white unbroken line going through the candles)
05/15/2022 at 11:32 AM #193211The indicator calculates the slope of the most appropriate line using the least squares method.
If you use this indicator with a period of 6, the calculation also includes the last (accrual) bar[0], so then the figure of -0.058 could be correct.
-
AuthorPosts

