Kase Peak Oscillator, Kase CD and Kase Permission

Viewing 15 posts - 31 through 45 (of 46 total)
  • Author
    Posts
  • #74585 quote
    Nicolas
    Keymaster
    Master

    Hi Bard, thanks for all these interesting documents about Cynthia Kase’s works and studies. The new version of the Dev Stop to be coded from MT5 is on my to-do list, don’t worry 🙂 I changed the featured image of your recent post with the new one you provided, thank you.

    #74603 quote
    Bard
    Participant
    Master

    Thanks very much for doing that @Nicolas much appreciated.
    Can I / should I, repost the Kase Convergence Divergence code here in a new forum post? Maybe other members would like to take a look at it (and I will refer back to this url for readers to view Kase Research papers like the last pdf I posted)?

    Cheers
    Bard

    #74680 quote
    Nicolas
    Keymaster
    Master

    You can repost it in this thread, since part of the topic title is Kase CD..

    #74796 quote
    Nicolas
    Keymaster
    Master

    I managed to translate the MT5 code of Cynthia Kase Dev Stop, seems that we have the good version this time! I added it directly into the Library: Kase Dev Stop v3

    Bard, shephinc and Bel thanked this post
    #75453 quote
    Bard
    Participant
    Master

    Hi,

    Would anyone like to take a look at coding the following from the top of this post/thread:?

    The combination of using both the Kase Peak Oscillator (already coded on this forum in the indicators section) and the Kase Convergence/Divergence indicator have solid statistical evidence in predicting market turns.

    2) Kase CD (Convergence/Divergence)

    3) Kase Permission Screen

    The Permissions Screener provides an easy visual on when to enter the market.

    The statistical reasons for using these indicators — apart from the fact the Kase Convergence/Divergence indicator actually draws lines showing when these occur, pls see green lines screenshot and the comparison of Kase indicators with the Stochastic and MACD indicator showing divergences —  are well explained in this presentation by the founder and designer of the indicators, the award winning market technician Cynthia Kase CMT.

    https://www.youtube.com/watch?time_continue=1&v=2h6zldXeTW0

    Kase was an energy trader and worked for Aramco consulting as a Director of Technical Analysis and Director of Risk Management.

    The screenshots shows the probabilities for an indicator signal predicting a market turn and preceding a turn using traditional indicators like the RSI and MACD and Kase’s indicators: The Peak Oscillator and the Kase CD indicator. The stats for the market moving to Kase Dev Stop 1 and 3 are also provided.

    “If there is a signal, there is a 71% chance that you will hit Dev Stop 1 using traditional indicators and a 75% chance if you use Kase indicators… for the big turns, so if you have a signal with a traditional indicator like the RSI and MACD there’s only a 28% chance you’re predicting an excursion to the third level stop (Dev Stop 3)… where with the Kase indicators there’s a 43.5% chance that you’re predicting a move to the third level stop (Dev Stop 3).” (Explained around the 25 min mark in the presentation link above).

    She then explains the probabilities of how often indicators precede turns. “Rather than looking at a signal and do I get a turn after it, I’m looking at turns then looking back to see how often I got a signal. Here the difference is much more dramatic.. (second stats screenshot), 55% (traditional indicators) versus 82% (Kase PO and Kase CD). What this mean is that you can rely on the Kase indicators to tell you there’s going to be a turn.”

    Bel thanked this post
    #75460 quote
    Bard
    Participant
    Master

    Kase Permissions Screenshot:

    Bel thanked this post
    #75462 quote
    Nicolas
    Keymaster
    Master

    Just found this one for Kase Peak and Kase CD in the same indi:

    en=p
    len1 = 10
    smooth=c
    atr = AverageTrueRange[len](pri)


    /// Kase Peak Osc ///
    
    RWH=(High-Low[len1])/(atr*SQRT(len1))
    RWL=(High[len1]-Low)/(atr*SQRT(len1))
    X=RWH-RWL
    
    pek=WeightedAverage[smooth](X)
    mean=Average[len](pek)
    sd=STD[len](pek)
    
    
    c1=(mean+(nbdev*sd)) > nbhigh
    c2=(mean-(nbdev*sd)) < -nblow
    
    c3=pek[1] >= 0 And pek > 0
    c4=pek[1] <= 0 And pek < 0
    
    If c1 Then
    v1=mean+(nbdev*sd)
    Else
    v1=nbhigh
    Endif
    
    If c2 Then
    v2=mean-(nbdev*sd)
    Else
    v2=-nblow
    Endif
    
    If c3 Then
    v3=v1
    Elsif c4 Then
    v3=v2
    Else
    v3=0
    Endif
    
    /// Kase CD ///
    
    pk=WeightedAverage[smooth](X)
    pki = Average[8](pk)
    KCD=(pk)-Average[8](pk)
    
    Return pek as "Kase Peak Osc", v3 as "Peak Osc Line", KCD as "Kase CD", pki as "Signal"
    #75478 quote
    Bard
    Participant
    Master

    Thanks, but what made Kase’s Peak Osc and Con/Divergence indicators more accurate was their ability to adapt to changing cycle lengths, being logarithmic and be able to use a Serial Dependancy index.

    As an example from the code I posted at the top of this thread, I believe it’s this part of the code that covers the cycle length Nicolas:
    Ps// The code writer had been in touch with Kase)

    extern string TimeFrame               = “Current time frame”;
    
    extern double kcdDeviations           = 2.0;
    
    extern int    kcdShortCycle           = 8;
    
    extern int    kcdLongCycle            = 65;
    
    extern double kcdSensitivity          = 40;
    
    extern bool   allPeaksMode            = false;
    
    extern bool   drawDivergences         = true;
    
    extern bool   drawIndicatorTrendLines = true;
    
    extern bool   drawPriceTrendLines     = true;
    
    extern string drawLinesIdentificator  = “kaseCD1″;
    
    extern bool   Interpolate             = true;


    And this:

    double max1 = 0;
    
    double maxs = 0;
    
    for (int k=kcdShortCycle; k<kcdLongCycle; k++)
    
    {
    
    max1 = MathMax(MathLog(High[i]/Low[i+k])/MathSqrt(k),max1);
    
    maxs = MathMax(MathLog(High[i+k]/Low[i])/MathSqrt(k),maxs);

    Here’s a slide from her presentation where she writes out the features: (the scribble is Log P/P(n))

    Cheers
    Bard

    #78058 quote
    Bard
    Participant
    Master

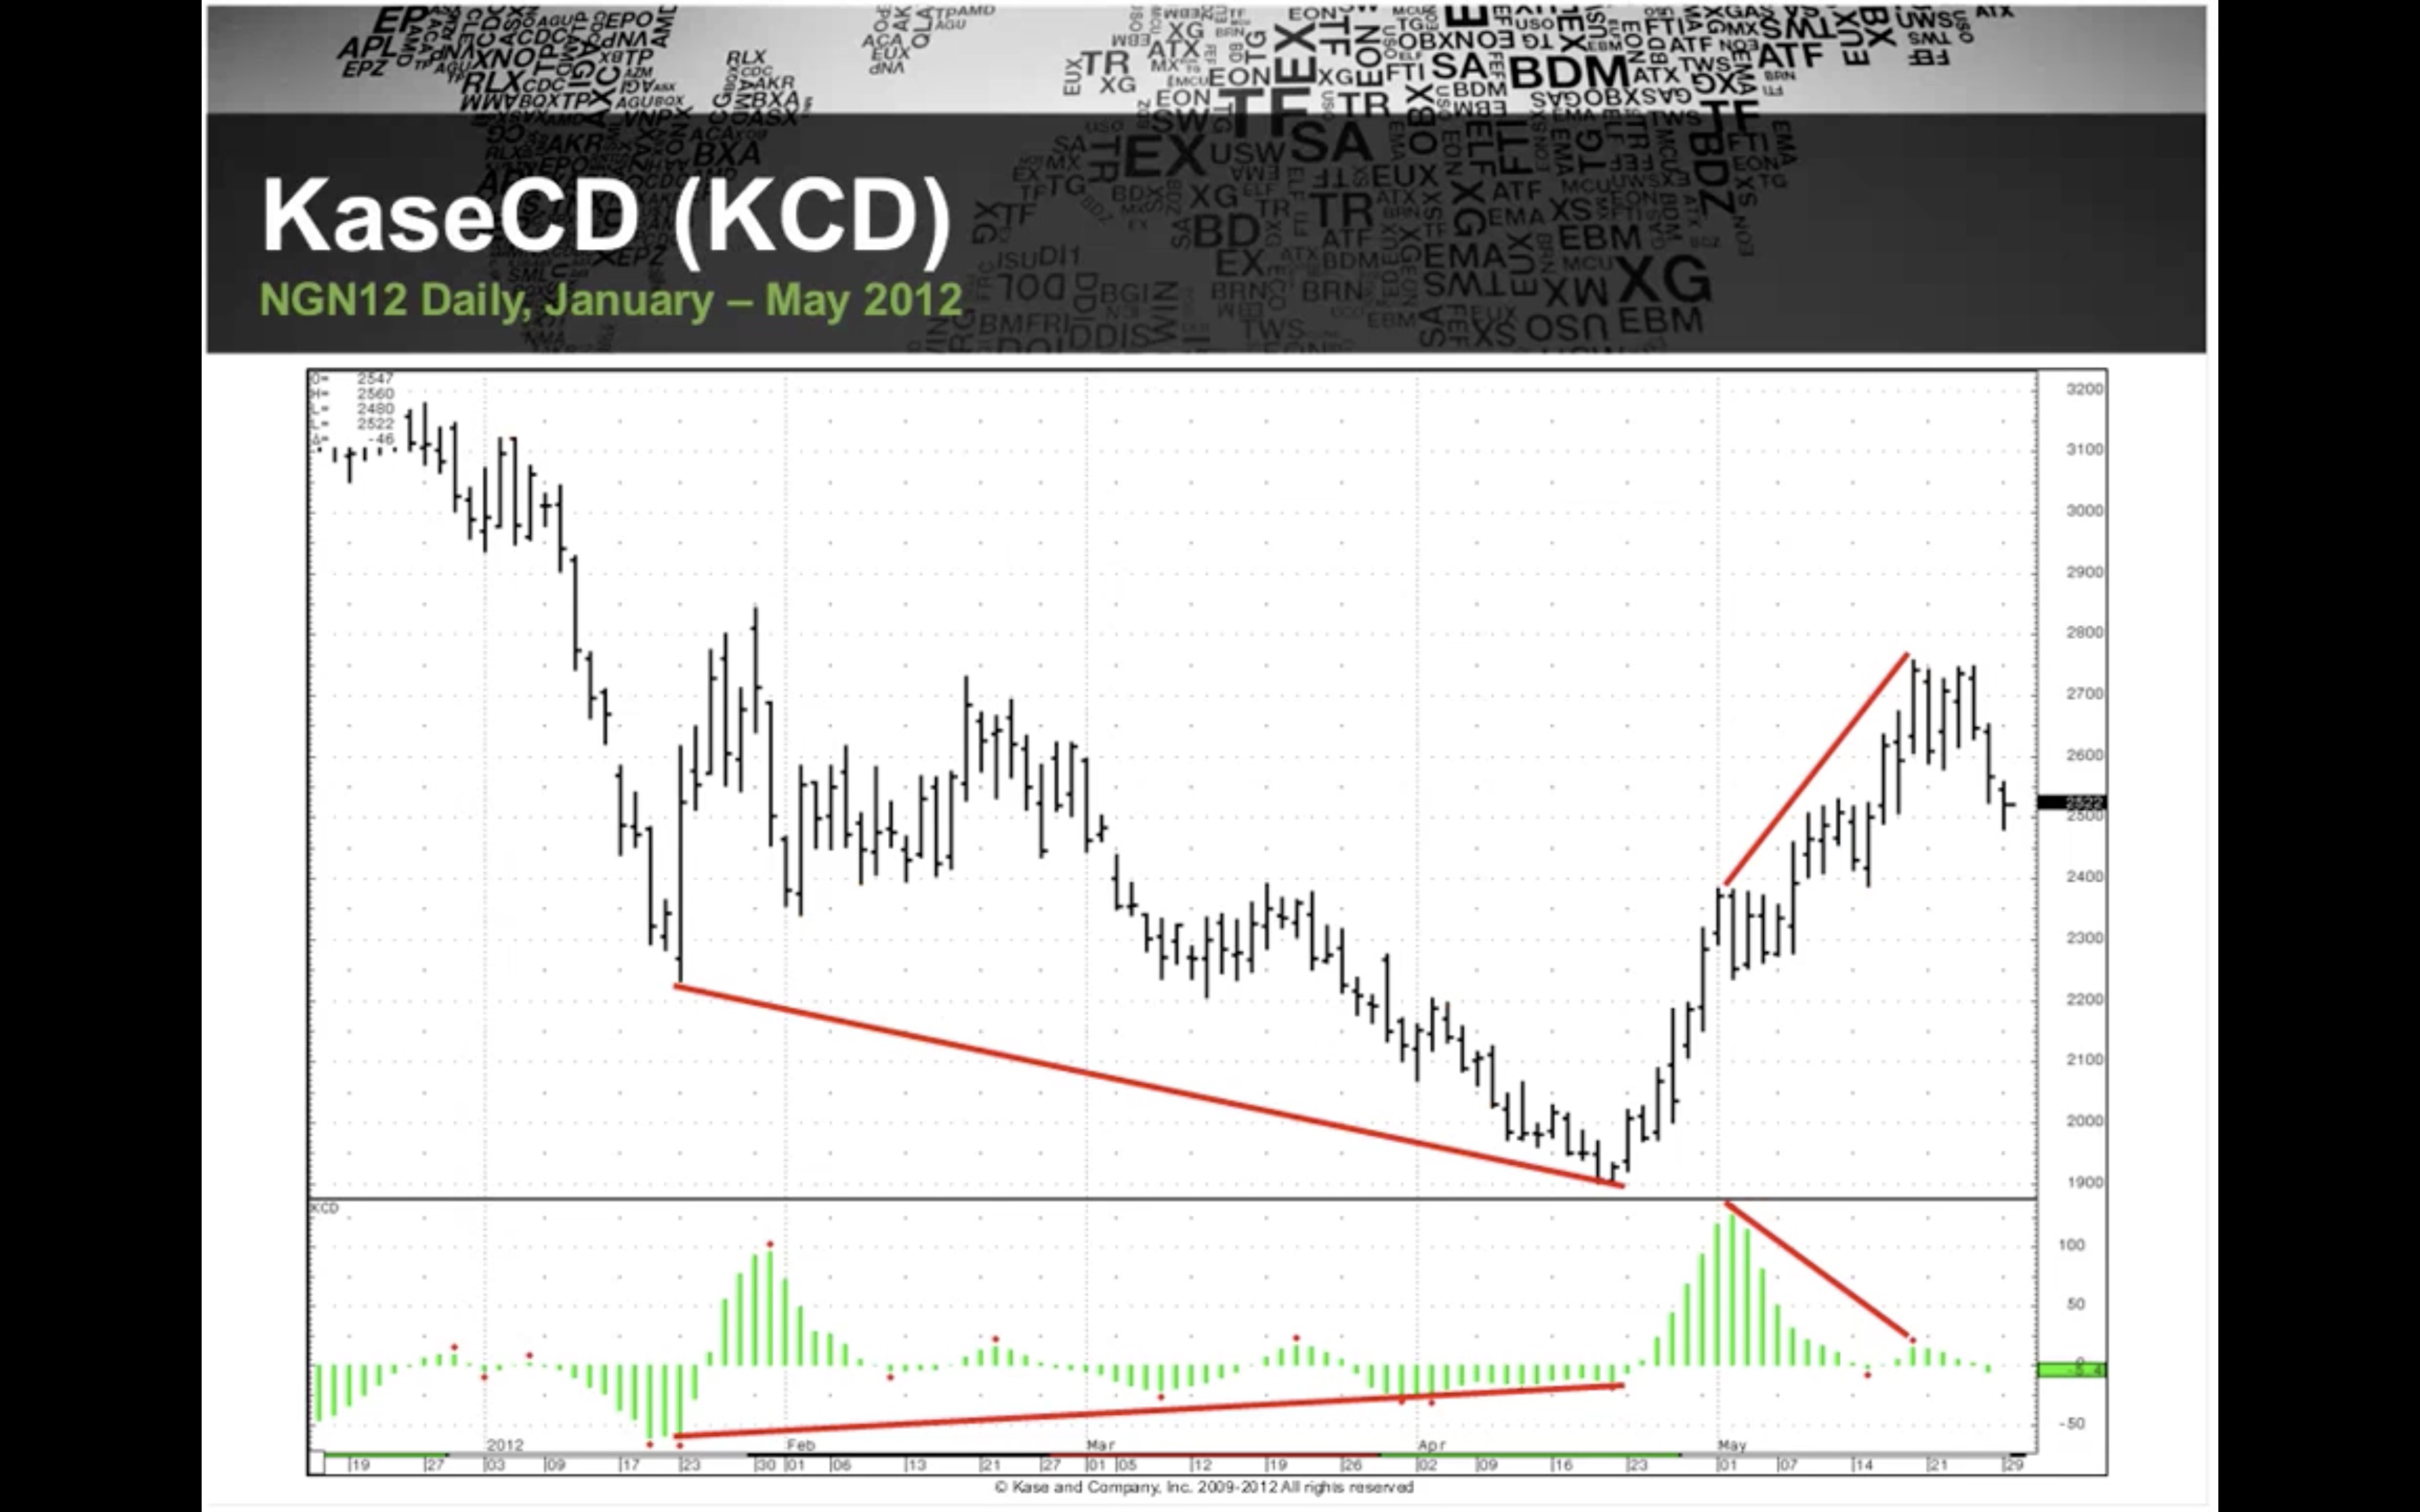
    Coding the Kase Convergence/Divergence indicator?

    Is there anyone that would like to convert Cynthia Kase’s Convergence/Divergence indicator?

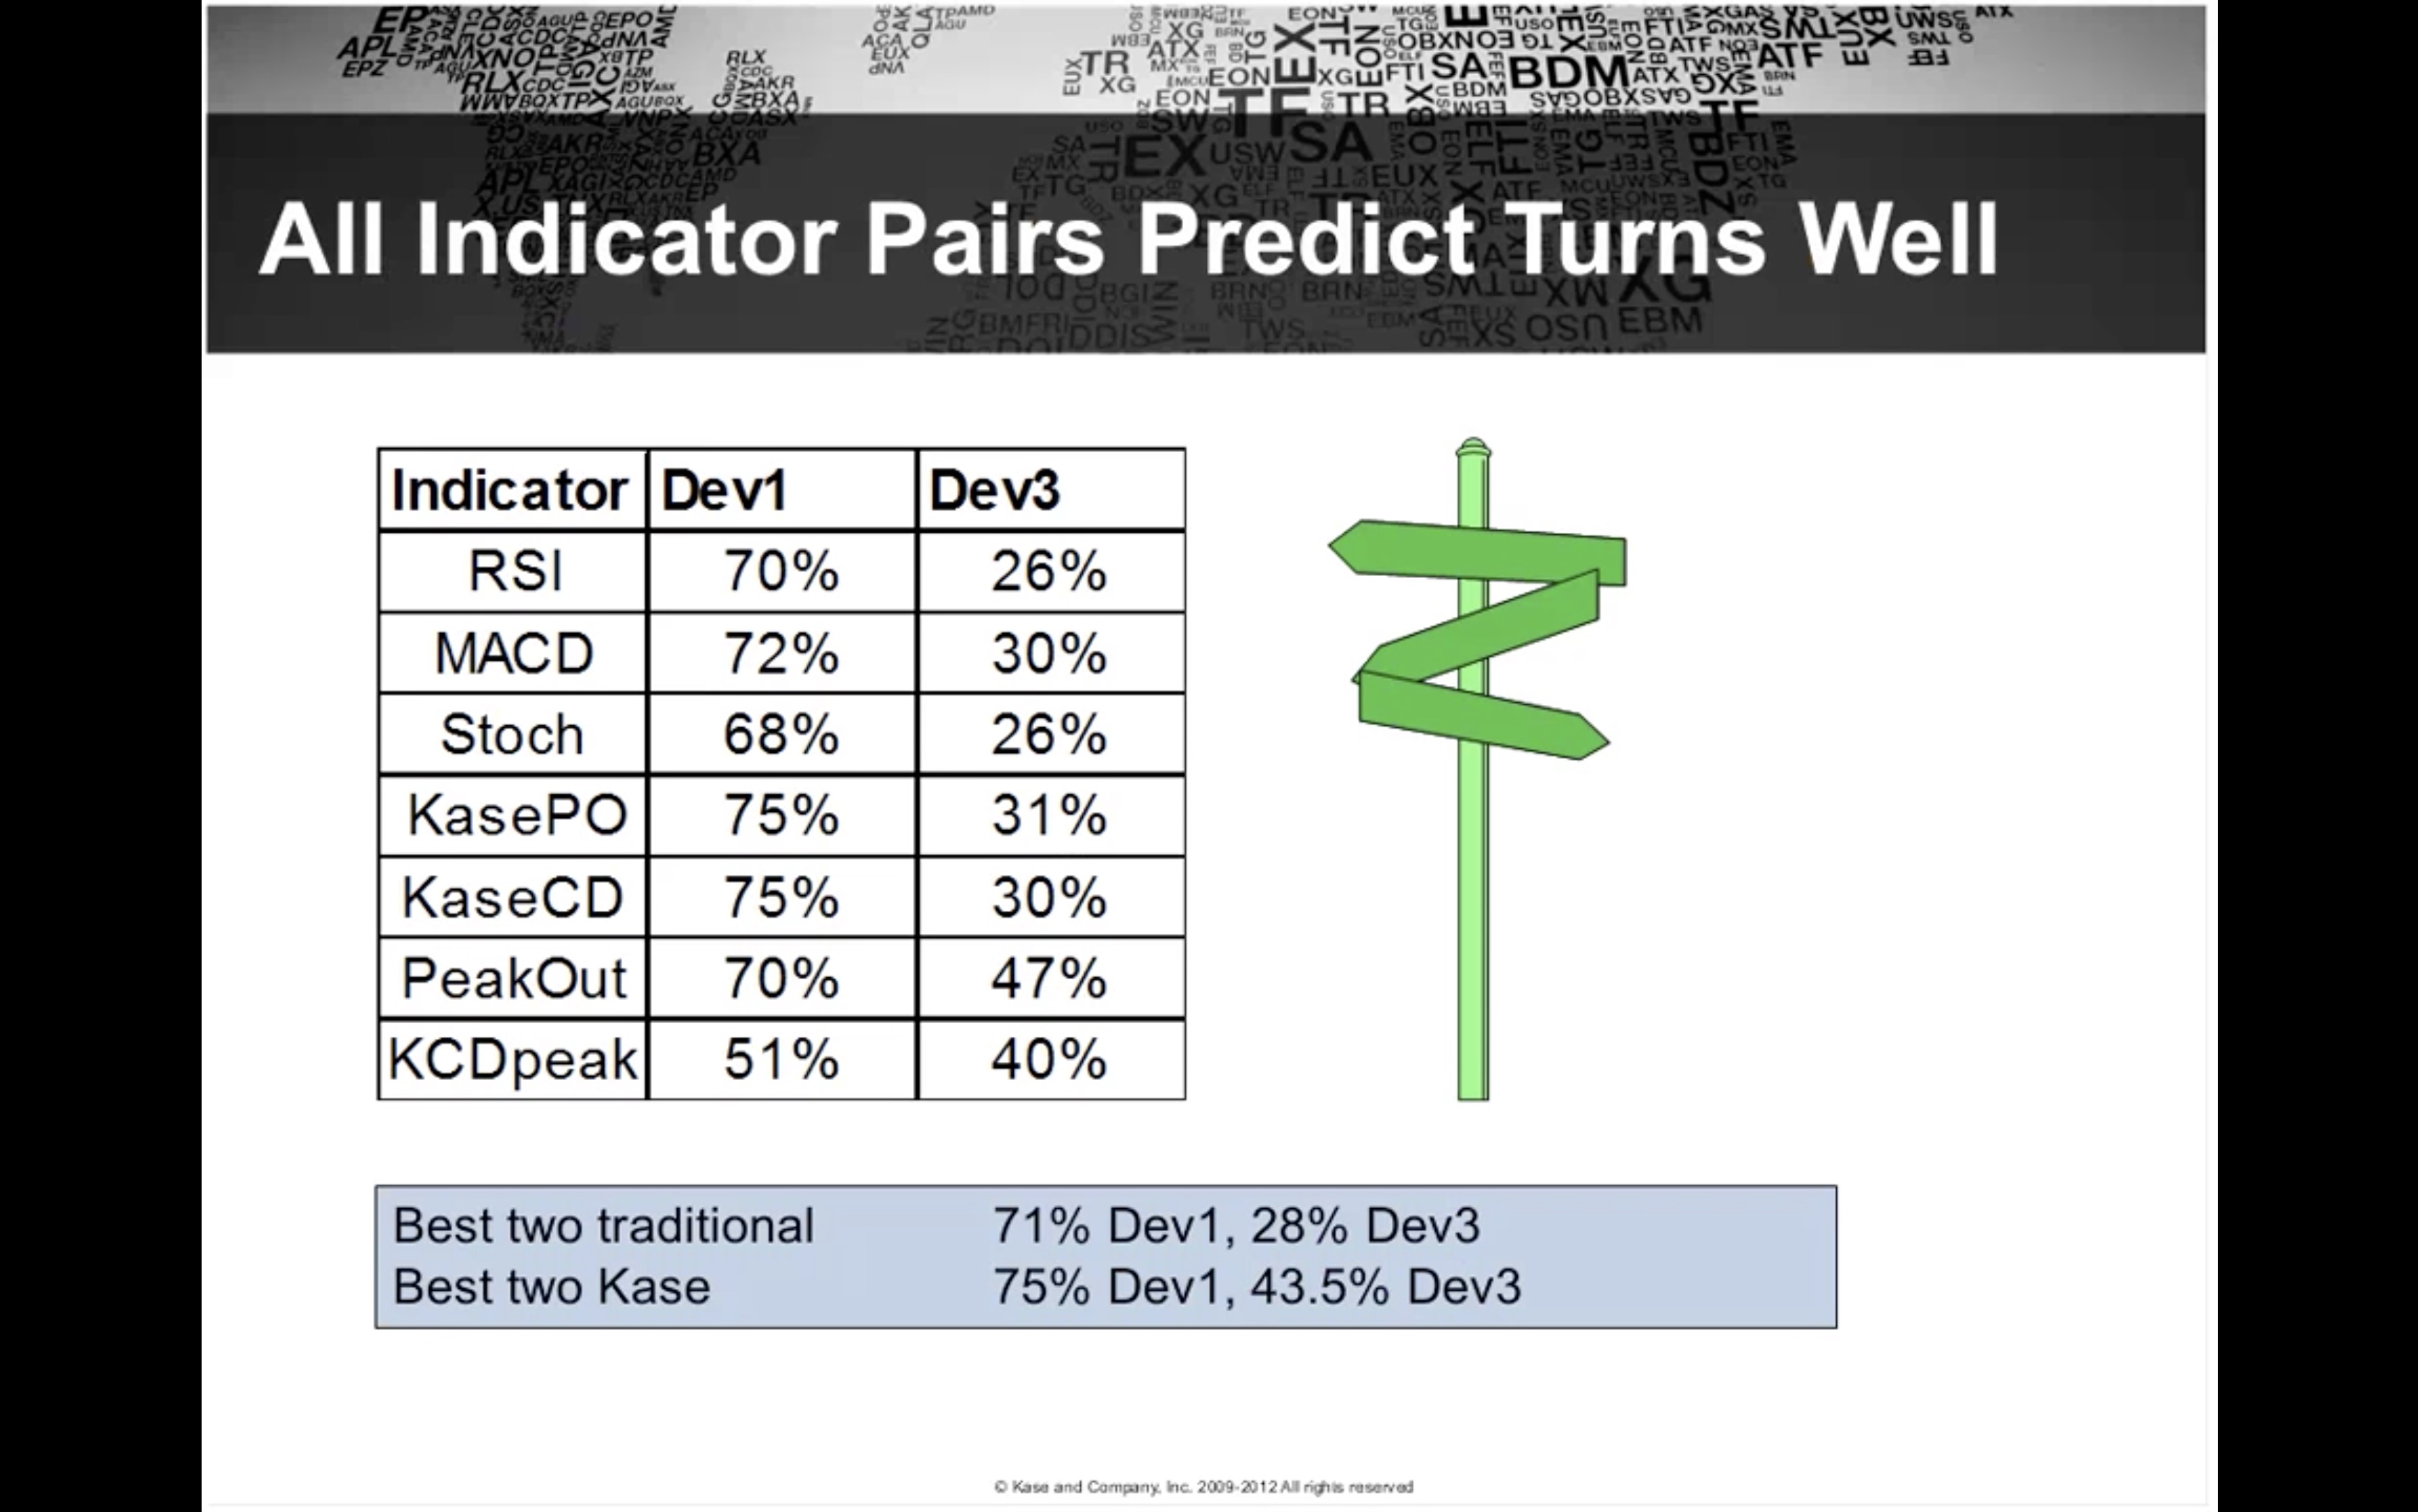
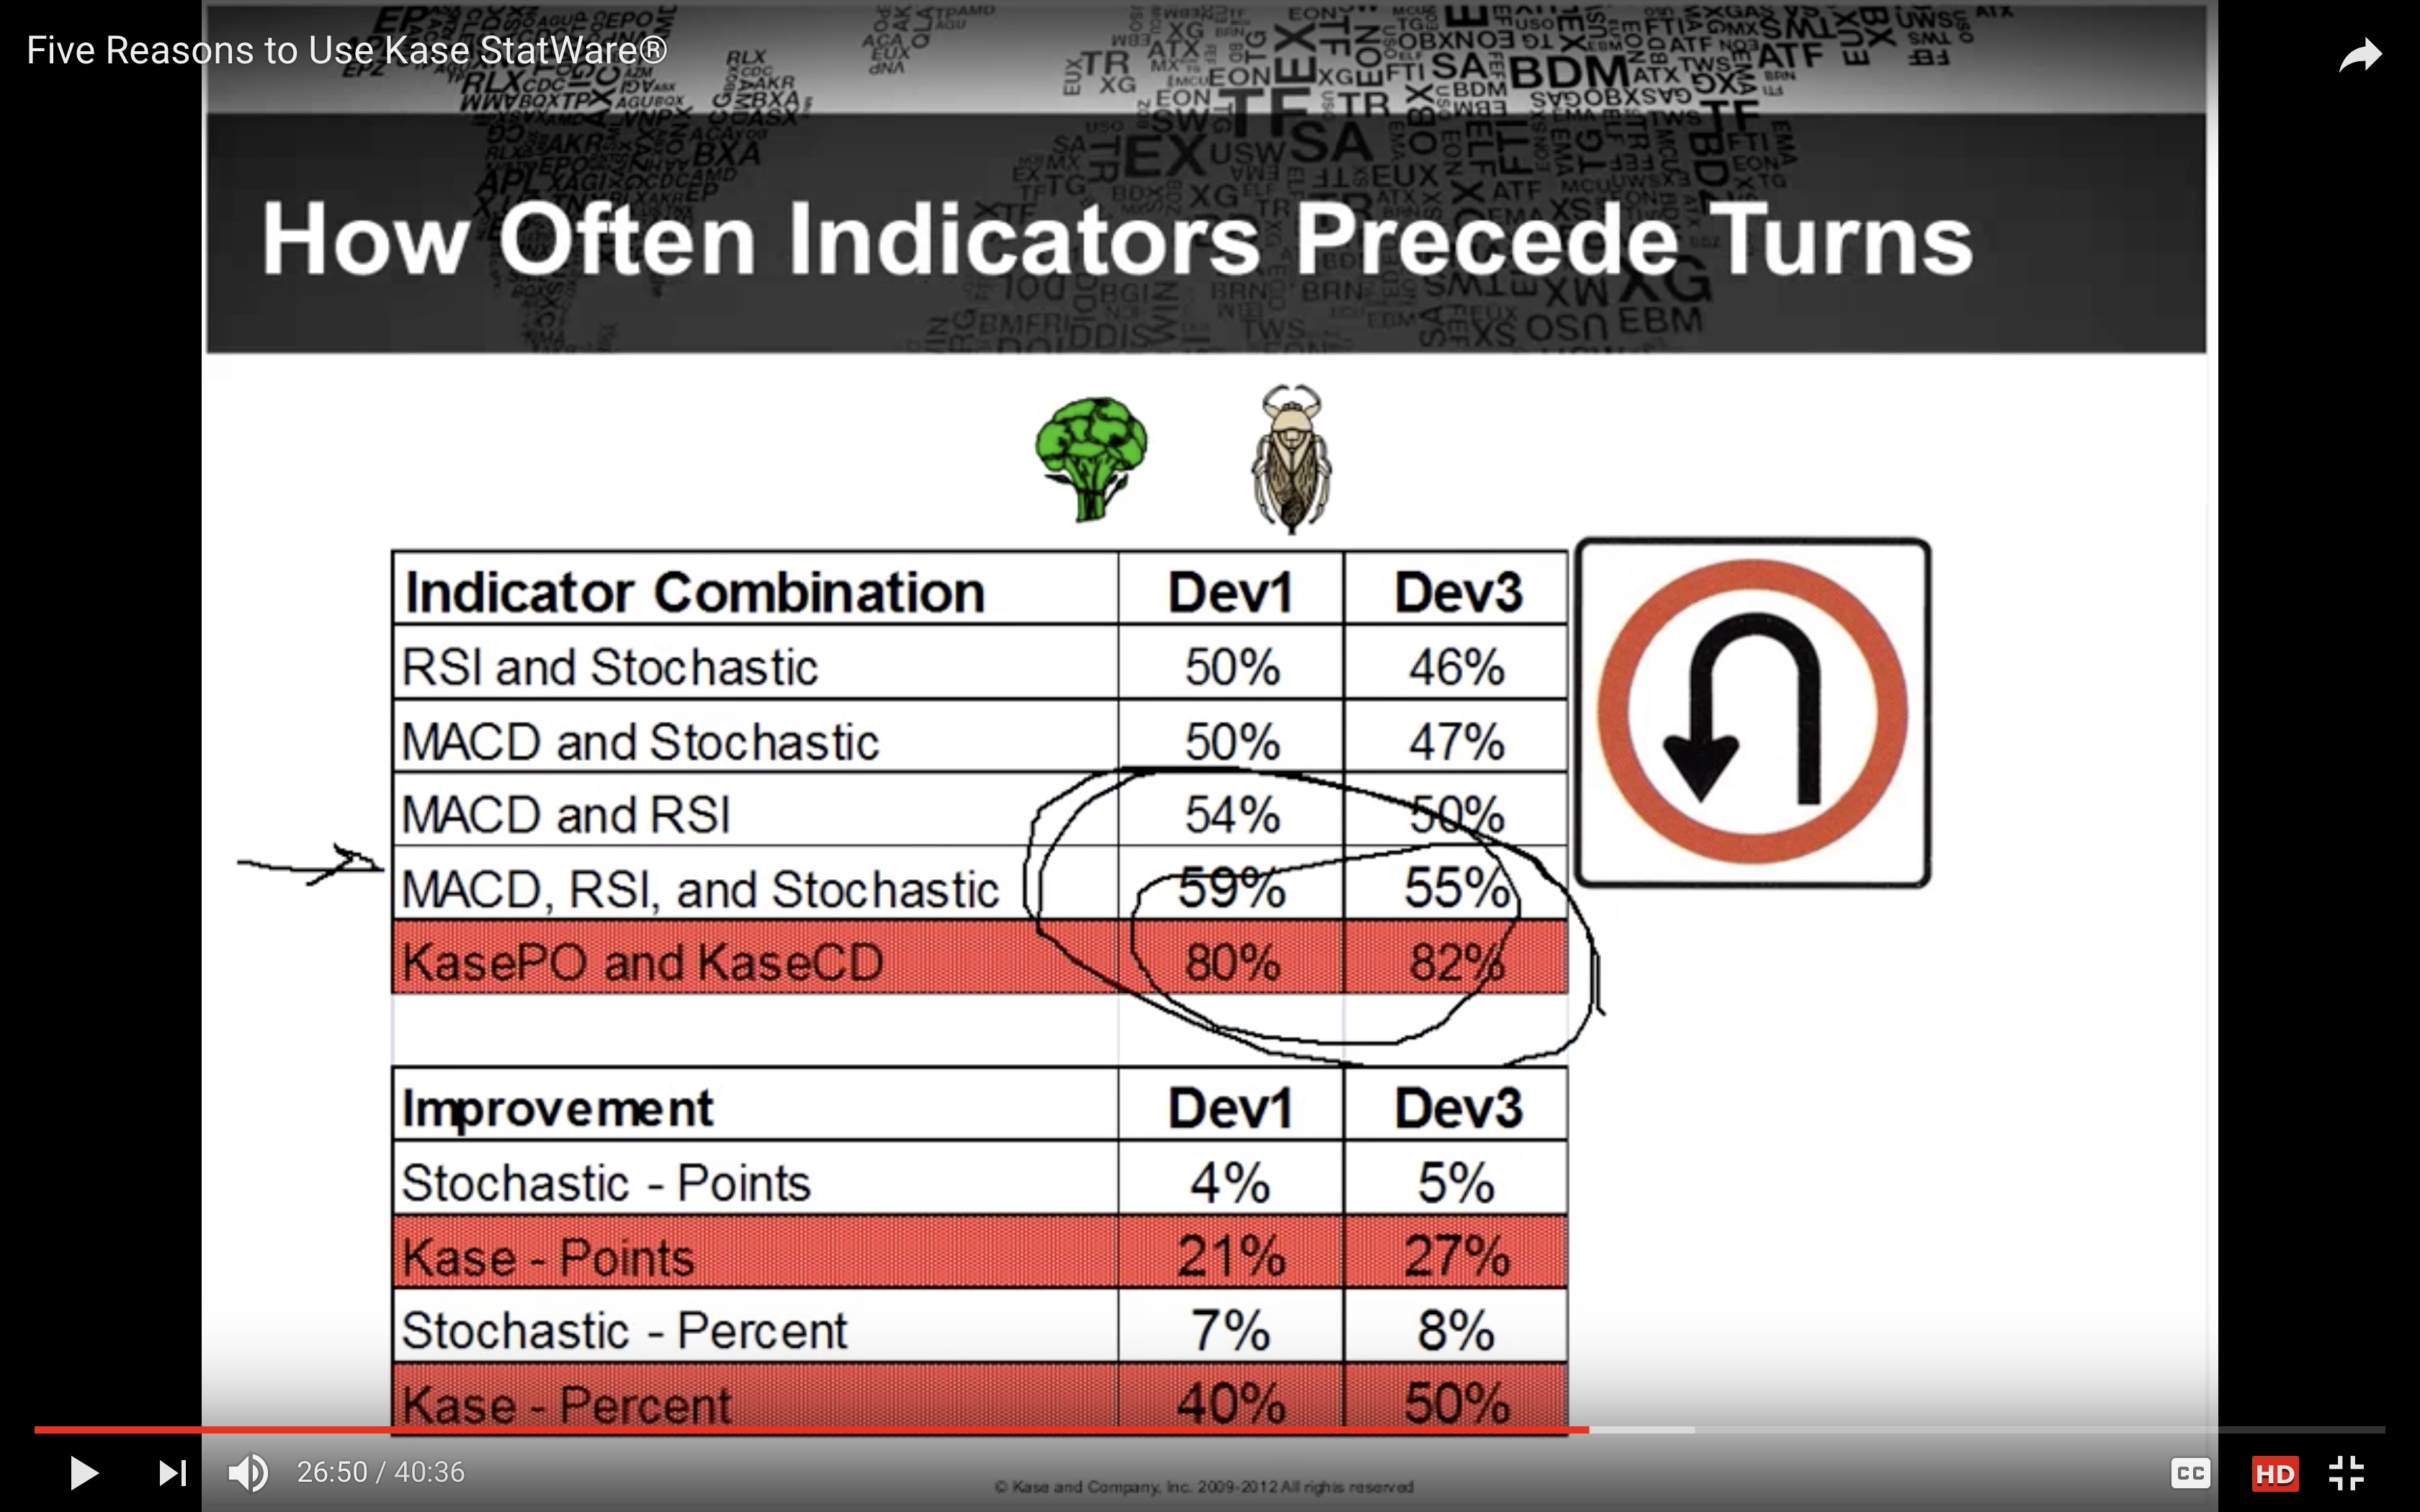
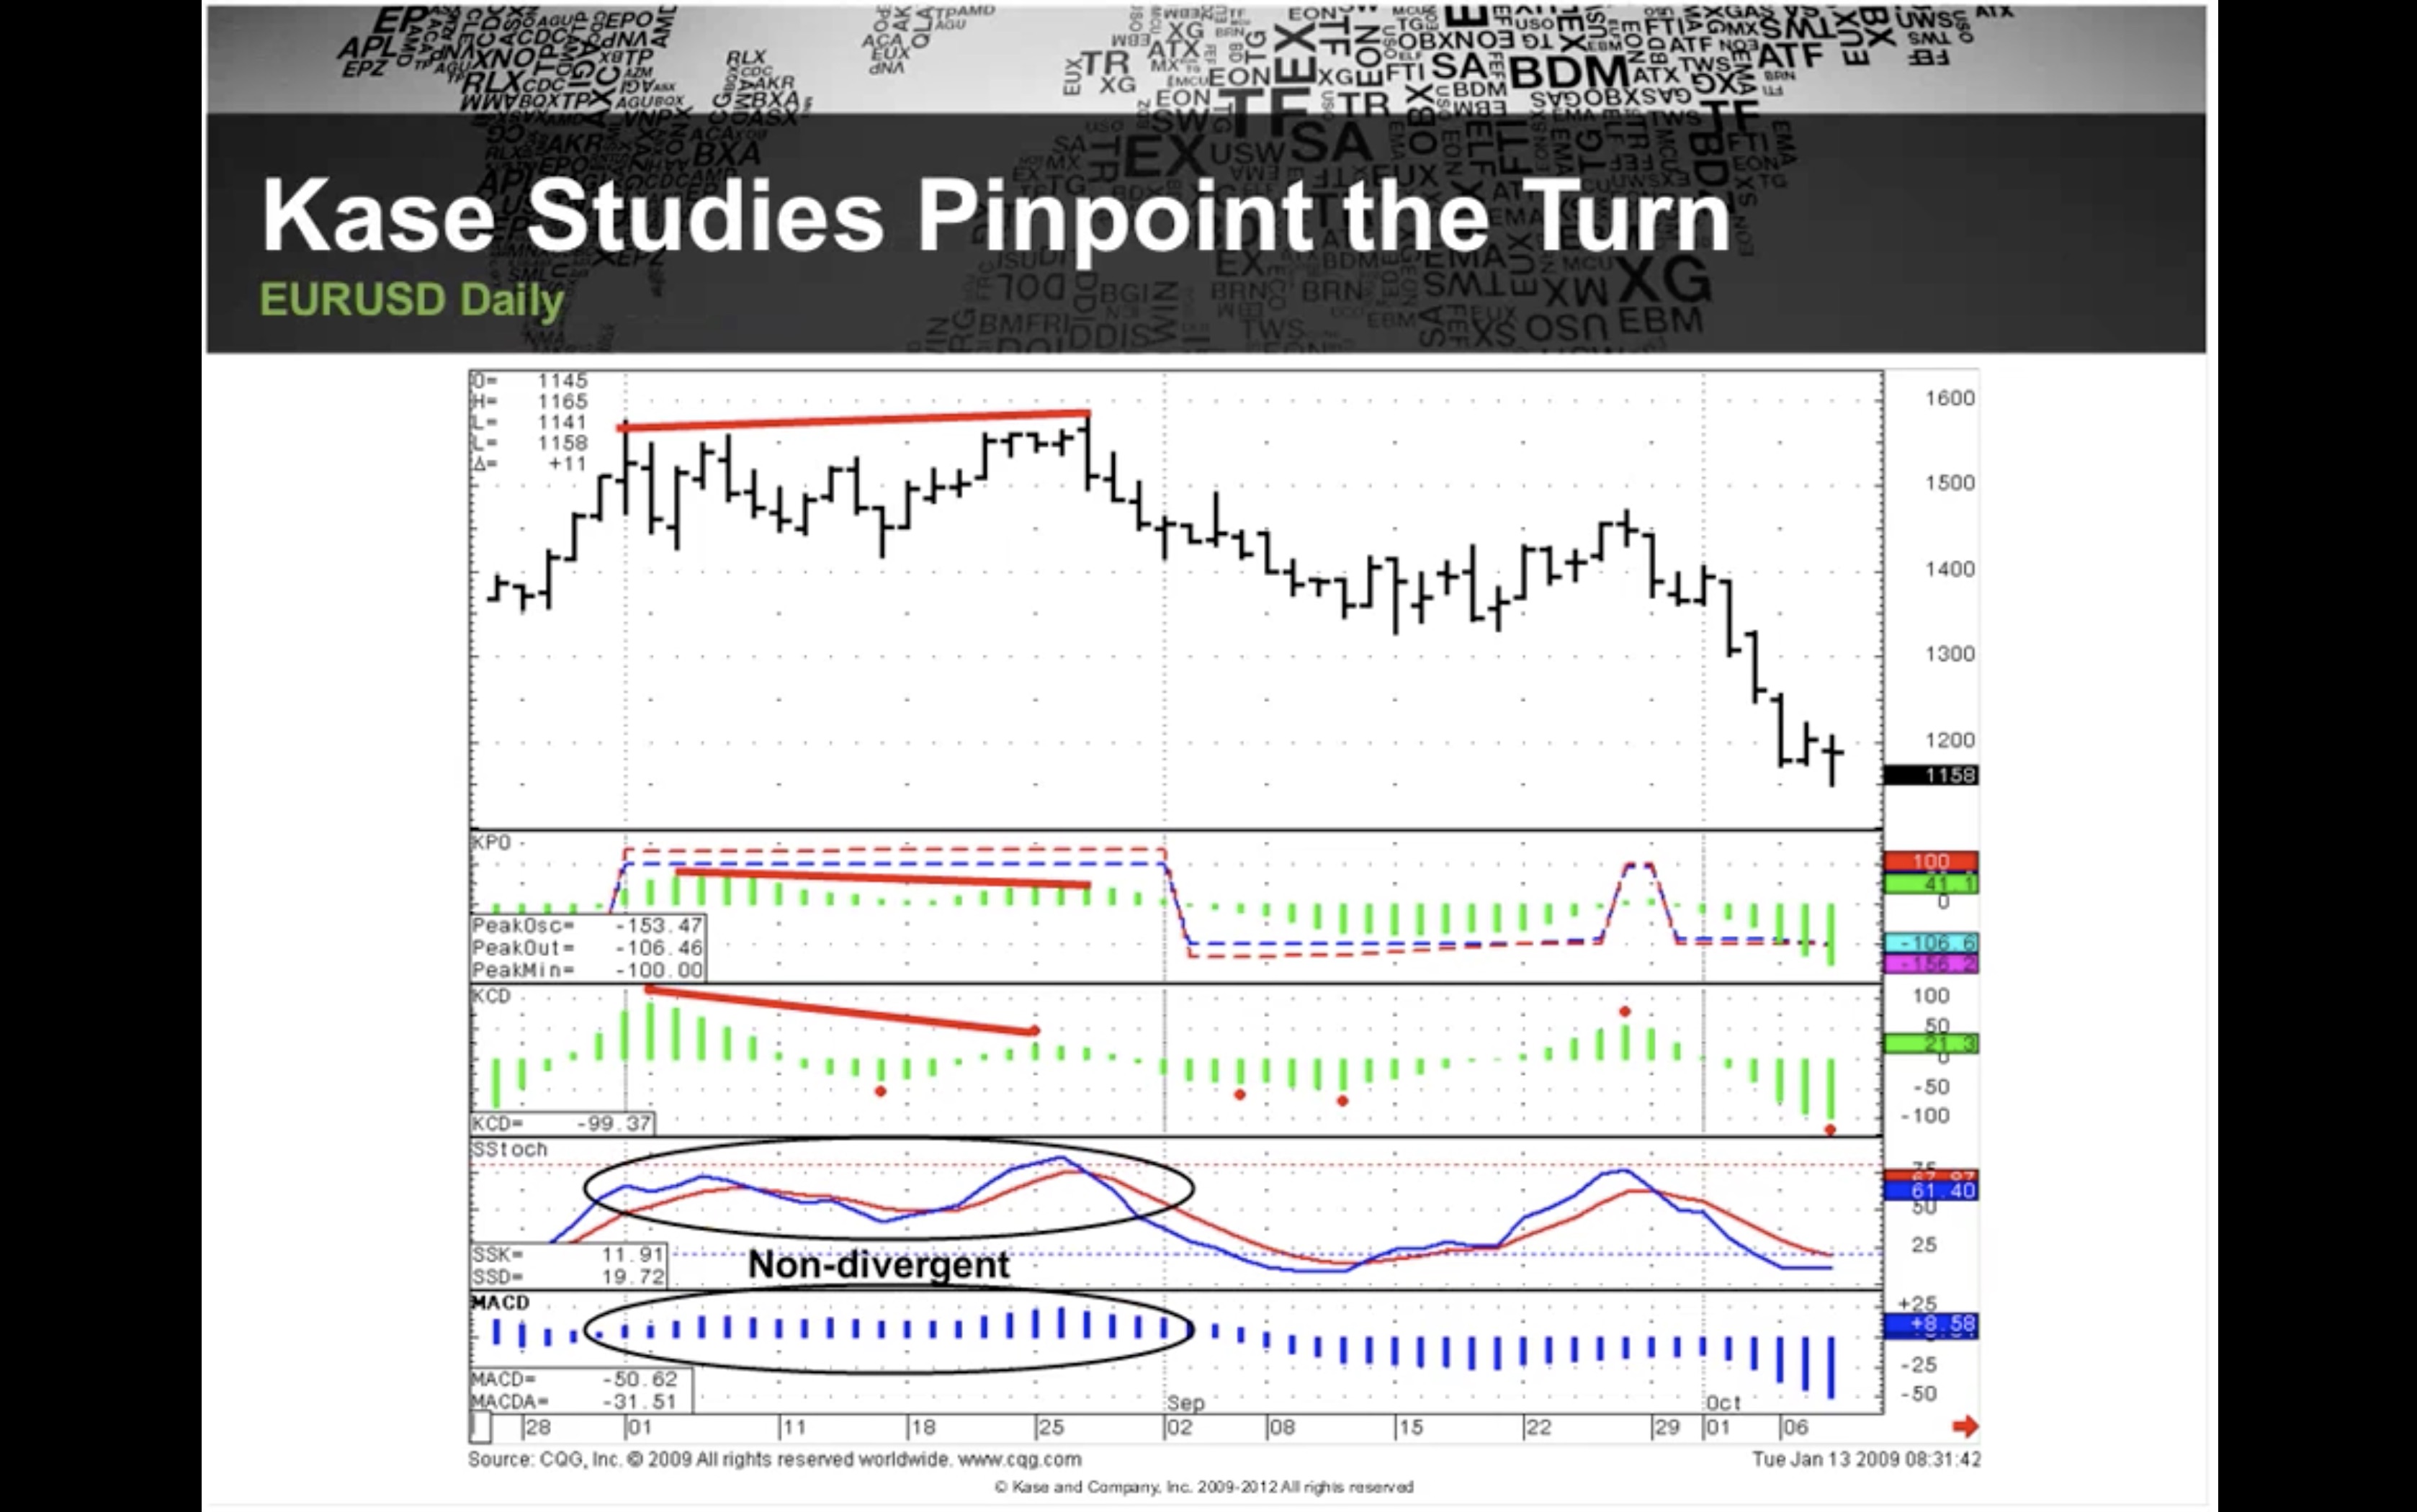
    Kase has already statistically proven the validity of using her Kase Peak Oscillator (KPO) combined with the Convergence/Divergence (KCD) indicator and it out performs conventional indicators like RSI and MACD for picking out market turning points:
    http://www.kaseco.com/support/articles/Proof_That_Technical_Analysis_Really_Works.pdf

    Using the KPO and Kase’s Dev Stops have produced more profitable results — on many different currency pairs and also Brent Crude, the Dow and DAX, (just change which Dev Stop to use due to individual markets having their own volatility profile) — than any other system/indicators I’ve used on PRT including the stunning John Ehlers indicators.

    As @nicolas pointed out to me, the danger with mean reverting systems is that they can also potentially get you in on the wrong side of the trade resulting in wider movement against your position before the Dev Stop closes the position.

    When testing, look at the Maximum Adverse Excursion column figures in the Detailed Report to gauge validity. I have taken out the ADX > 25 part of the entry code to minimise complexity and help future results being less robust than back tests. The simpler the system with the less parameters the more robust it will be in the future.

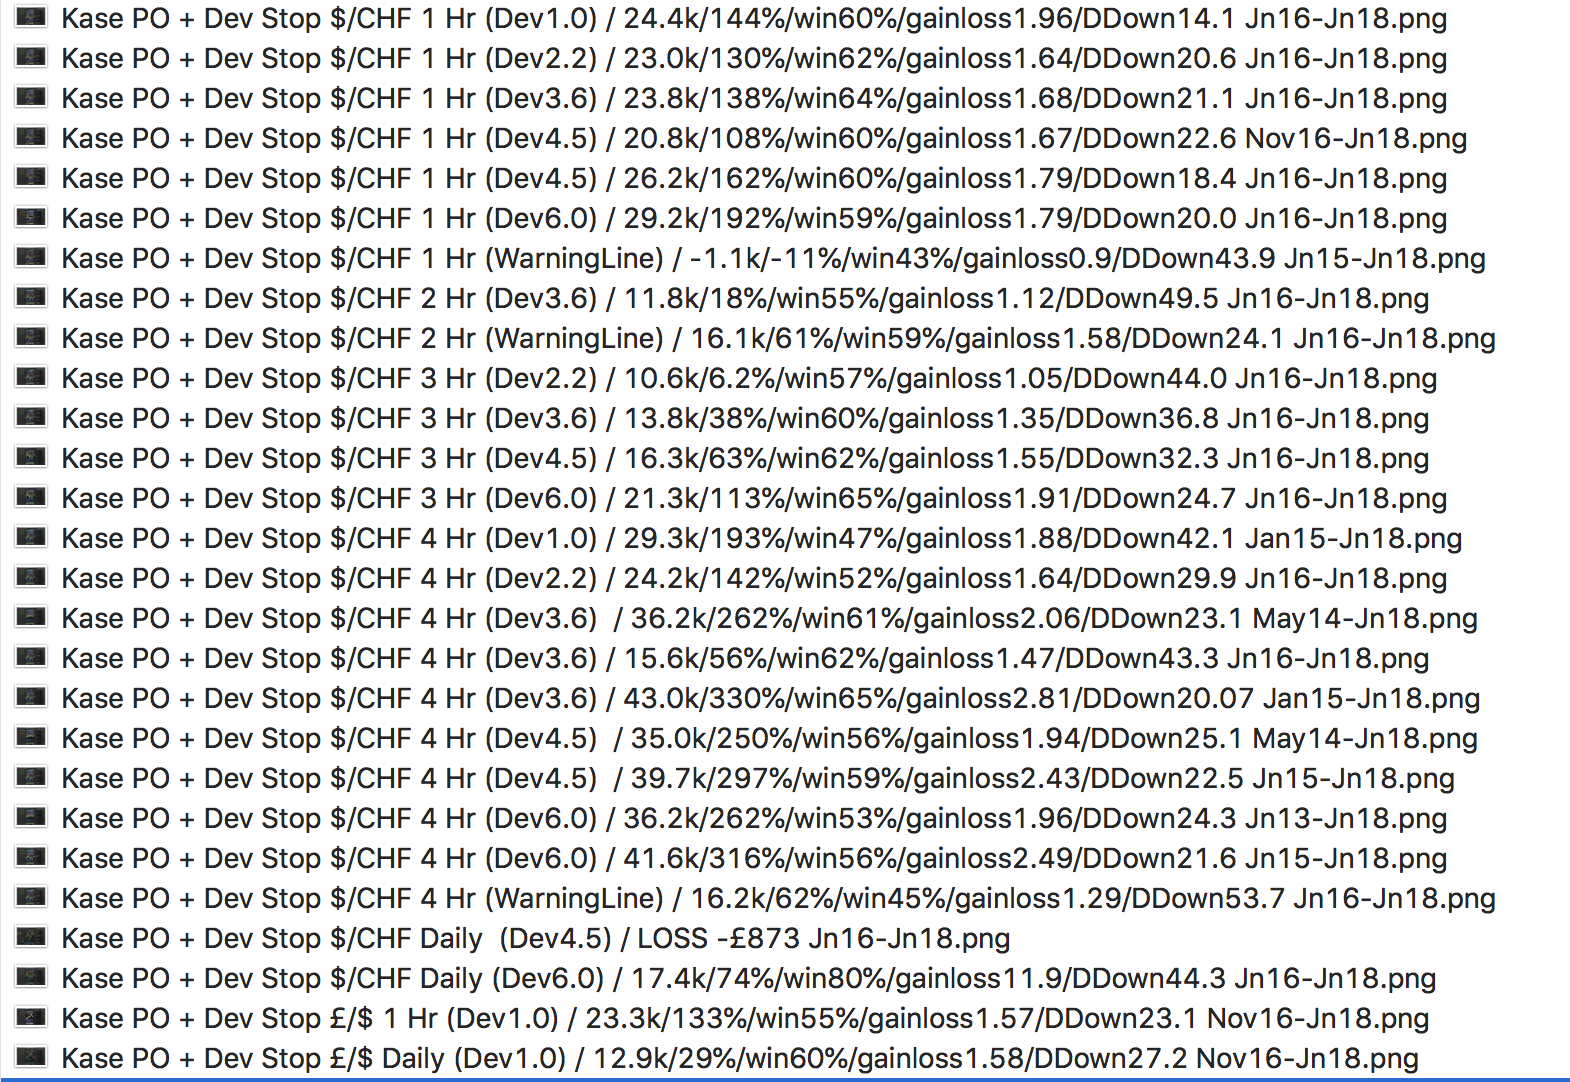
    Please see screen shot for results on the (stable) Swissy (USD/CHF) usingi different time frames and Dev Stops:

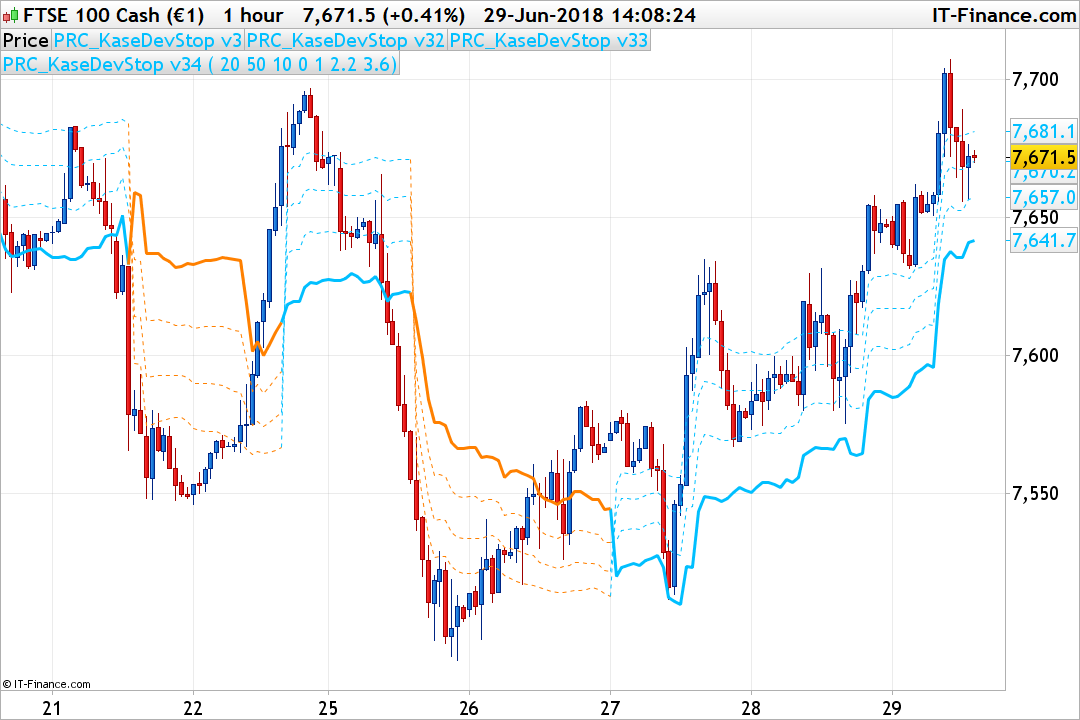
    The code for the KPO is on this forum as is the code for the Kase’s Dev Stops is below (check out KRev (Reversal) Amounts too to calculate your monetary risk per trade per Dev Stop stop line).

    If anyone would like to add to this code below, maybe try different financial instruments or maybe add a trend filter or perhaps a Choppiness Index/Kaufman Efficiency Ratio – I haven’t had time yet – please feel free and post your results here.

    When adding a Trailing Stop results were sometimes better, sometimes worse.

    Thanks a lot,
    Bard

    // Definition of code parameters
    DEFPARAM CumulateOrders = False // Cumulating positions deactivated
    
    // Conditions to enter long positions
    ignored, ignored, ignored, ignored, indicator2 = CALL "Kase Peak Oscillator"
    c1 = (indicator2 < 0) //Kase Pink Bar Peak Out Entry
    IF c1 THEN
    BUY 10 PERPOINT AT MARKET
    ENDIF
    
    // Conditions to exit long positions
    ignored,ignored,ignored,ignored,indicator3, ignored = CALL "Kase Dev Stop Lisse +SAR+4.5/6" 
    c2 = (close CROSSES UNDER indicator3) // Kase Dev Stop 4.5
    
    IF c2 THEN
    SELL AT MARKET
    ENDIF
    
    // Conditions to enter short positions
    ignored, ignored, ignored, ignored, indicator5 = CALL "Kase Peak Oscillator"
    c3 = (indicator5 > 0)
    
    IF c3 THEN
    SELLSHORT 10 PERPOINT AT MARKET
    ENDIF
    
    // Conditions to exit short positions
    ignored,ignored,ignored, ignored,indicator6, ignored = CALL "Kase Dev Stop Lisse +SAR+4.5/6"
    c4 = (close CROSSES OVER indicator6)
    
    IF c4 THEN
    EXITSHORT AT MARKET
    ENDIF
    
    
    //KASE DEV STOP + 4.5 + 6.0
    //Settings
    n=30
    
    p1=1.0
    p2=2.2
    p3=3.6
    p4=4.5
    p5=6.0
    
    difference=0
    Hg=highest[2](high)
    Lw=lowest[2](low)
    DTR=max(max(Hg-Lw,abs(Hg-close[2])),abs(Lw-close[2]))
    aDTR=average[n](DTR)
    for i=0 to n-1 do
    difference=difference+square(DTR[i]-aDTR)
    next
    difference=difference/n
    sdev=sqrt(difference)
    
    dev0=close-aDTR
    dev1=close-aDTR-p1*sdev
    dev2=close-aDTR-p2*sdev
    dev3=close-aDTR-p3*sdev
    dev4=close-aDTR-p4*sdev
    dev5=close-aDTR-p5*sdev
    
    if dev0<dev0[1] and close>dev5[1] then
    dev0=dev0[1]
    endif
    if dev1<dev1[1] and close>dev5[1] then
    dev1=dev1[1]
    endif
    if dev2<dev2[1] and close>dev5[1] then
    dev2=dev2[1]
    endif
    if dev3<dev3[1] and close>dev5[1] then
    dev3=dev3[1]
    endif
    if dev4<dev4[1] and close>dev5[1] then
    dev4=dev4[1]
    endif
    if dev5<dev5[1] and close>dev5[1] then
    dev5=dev5[1]
    endif
    
    dev6=close+aDTR
    dev7=close+aDTR+p1*sdev
    dev8=close+aDTR+p2*sdev
    dev9=close+aDTR+p3*sdev
    dev10=close+aDTR+p4*sdev
    dev11=close+aDTR+p5*sdev
    
    if dev6>dev6[1] and close<dev11[1] then
    dev6=dev6[1]
    endif
    if dev7>dev7[1] and close<dev11[1] then
    dev7=dev7[1]
    endif
    if dev8>dev8[1] and close<dev11[1] then
    dev8=dev8[1]
    endif
    if dev9>dev9[1] and close<dev11[1] then
    dev9=dev9[1]
    endif
    if dev10>dev10[1] and close<dev11[1] then
    dev10=dev10[1]
    endif
    if dev11>dev11[1] and close<dev11[1] then
    dev11=dev11[1]
    endif
    
    if close>dev11[1] then
    flag=-1
    else
    if close<dev5[1] then
    flag=1
    endif
    endif
    
    if flag=-1 then
    ind0=dev0
    ind1=dev1
    ind2=dev2
    ind3=dev3
    ind4=dev4
    ind5=dev5
    //k=1
    r=0
    g=191
    b=255
    else
    ind0=dev6
    ind1=dev7
    ind2=dev8
    ind3=dev9
    ind4=dev10
    ind5=dev11
    //k=-1
    r=255
    g=128
    b=0
    endif
    
    //ORANGE AND LIGHT BLUE
    return ind0 coloured(r,g,b) style(dottedline,2) as "Warning Line", ind1 coloured(r,g,b) style(dottedline,2) as "Dev Stop 1.0", ind2 coloured(r,g,b) style(dottedline,2) as "Dev Stop 2.2", ind3 coloured(r,g,b) style(line,2) as "Dev Stop 3.6", ind4 coloured(r,g,b) style(dottedline,2) as "Dev Stop 4.5", ind5 coloured(r,g,b) style(line,2) as "Dev Stop 6.0"
    
    
    #78063 quote
    Fr7
    Participant
    Master

    Hello Bard,

    Could you say the variables used in the Kase Peak indicator?

    en=p???
    len???
    smooth=c???
    nbdev??nbhigh??nblow???
    #78073 quote
    Bard
    Participant
    Master

    Hi Fr7,

    I don’t recognise these variables?
    Try the latest version (V2) that Nicolas updated here:
    I left settings as standard.

    //PRC_Kase Peak Oscillator V2 | indicator
    //19.07.2017
    //Nicolas @ www.prorealcode.com
    //Sharing ProRealTime knowledge
    //translated from MT4 code
    
    // --- settings
    kpoDeviations= 2.0 // Kase peak oscillator deviations
    kpoShortCycle= 8 // Kase peak oscillator short cycle
    kpoLongCycle = 65 // Kase peak oscillator long cycle
    kpoSensitivity = 40
    allPeaksMode = 0 //1=true ; 0=false
    // --- end of settings
    
    if barindex>kpoLongCycle*2 then
    ccLog = Log(Close[0]/Close[1])
    ccDev = std[9](ccLog)
    
    avg = average[30](ccDev)
    
    if (avg>0) then
    max1 = 0
    maxs = 0
    
    for k = kpoShortCycle to kpoLongCycle-1 do
    max1 = Max(Log(High[0]/Low[0+k])/Sqrt(k),max1)
    maxs = Max(Log(High[0+k]/Low[0])/Sqrt(k),maxs)
    next
    x1 = max1/avg
    xs = maxs/avg
    endif
    
    xp= kpoSensitivity*(average[3](x1)-average[3](xs))
    xpAbs = Abs(xp)
    
    kpoBuffer = xp
    kphBuffer  = xp
    
    tmpVal = average[50](xpAbs)+kpoDeviations*std[50](xpAbs)
    maxVal = Max(90.0,tmpVal)
    minVal = Min(90.0,tmpVal)
    
    if (kpoBuffer > 0) then
    kpdBuffer = maxVal
    kpmBuffer = minVal
    else
    kpdBuffer = -maxVal
    kpmBuffer = -minVal
    endif
    kppbuffer=0
    if (not allPeaksMode) then
    if (kpoBuffer[1]>0 and kpoBuffer[1]>kpoBuffer[0] and kpoBuffer[1]>=kpoBuffer[2] and kpoBuffer[1]>= maxVal) then
    kppBuffer = kpoBuffer[1]
    endif
    if (kpoBuffer[1]<0 and kpoBuffer[1]<kpoBuffer[0] and kpoBuffer[1]<=kpoBuffer[2] and kpoBuffer[1]<=-maxVal) then
    kppBuffer = kpoBuffer[1]
    endif
    else
    if (kpoBuffer[1]>0 and kpoBuffer[1]>kpoBuffer[0] and kpoBuffer[1]>=kpoBuffer[2]) then
    kppBuffer = kpoBuffer[1]
    endif
    if (kpoBuffer[1]<0 and kpoBuffer[1]<kpoBuffer[0] and kpoBuffer[1]<=kpoBuffer[2]) then
    kppBuffer = kpoBuffer[1]
    endif
    endif
    endif
    
    return kphBuffer coloured(105,105,105) style(histogram), kpoBuffer coloured(105,105,105) style(line,2), kpdBuffer coloured(255,0,255), kpmBuffer coloured(0,191,255), kppBuffer coloured(255,0,255) style(histogram,2)
    
    //105,105,105=grey
    //255,0,255=pink
    //0,191,255=blue
    
    #78085 quote
    Fr7
    Participant
    Master
    en=p
    len1 = 10
    smooth=c
    atr = AverageTrueRange[len](pri)


    /// Kase Peak Osc ///
     
    RWH=(High-Low[len1])/(atr*SQRT(len1))
    RWL=(High[len1]-Low)/(atr*SQRT(len1))
    X=RWH-RWL
     
    pek=WeightedAverage[smooth](X)
    mean=Average[len](pek)
    sd=STD[len](pek)
     
     
    c1=(mean+(nbdev*sd)) > nbhigh
    c2=(mean-(nbdev*sd)) < -nblow
     
    c3=pek[1] >= 0 And pek > 0
    c4=pek[1] <= 0 And pek < 0
     
    If c1 Then
    v1=mean+(nbdev*sd)
    Else
    v1=nbhigh
    Endif
     
    If c2 Then
    v2=mean-(nbdev*sd)
    Else
    v2=-nblow
    Endif
     
    If c3 Then
    v3=v1
    Elsif c4 Then
    v3=v2
    Else
    v3=0
    Endif
     
    /// Kase CD ///
     
    pk=WeightedAverage[smooth](X)
    pki = Average[8](pk)
    KCD=(pk)-Average[8](pk)
     
    Return pek as "Kase Peak Osc", v3 as "Peak Osc Line", KCD as "Kase CD", pki as "Signal"
    

    this is different from what you say………………Could you say the variables used in the Kase Peak indicator?

    es = p ???
    len ???
    suave = c?
    nbdev ?? nbhigh ?? nblow ???
    #78092 quote
    Bard
    Participant
    Master

    Thats version #1. Do NOT use it, it doesn’t work.

    Use the v2 I provided.

    Cheers
    Bard

    #91571 quote
    ggolfet
    Participant
    Senior

    I read the discussion about this really interesting system by Kase.

    Have Kase CD and Kase permission been coded for prorealtime?

    #91630 quote
    Bard
    Participant
    Master

    Hi @ggolfet, currently just the Kase Peak Oscillator (KPO) has been coded, along with her Dev Stops. It’s a shame because only with the Convergence and Divergence indicator (KCD) being used in conjunction with the KPO – which has not been coded – can the statistically proven high probability entries be achieved. But to be fair, I believe it is a long a time consuming job to convert and I think Nicolas didn’t have the same feeling about these indicators as I did.

Viewing 15 posts - 31 through 45 (of 46 total)
  • You must be logged in to reply to this topic.

Kase Peak Oscillator, Kase CD and Kase Permission


ProBuilder: Indicators & Custom Tools

New Reply
Author
author-avatar
Bard @brad Participant
Summary

This topic contains 45 replies,
has 8 voices, and was last updated by ggolfet
6 years, 11 months ago.

Topic Details
Forum: ProBuilder: Indicators & Custom Tools
Language: English
Started: 07/05/2017
Status: Active
Attachments: 32 files
Logo Logo
Loading...