John Carter TTM Waves

Viewing 10 posts - 1 through 10 (of 10 total)
  • Author
    Posts
  • #89738 quote
    therealdaytherealday
    Participant
    New

    Hi All

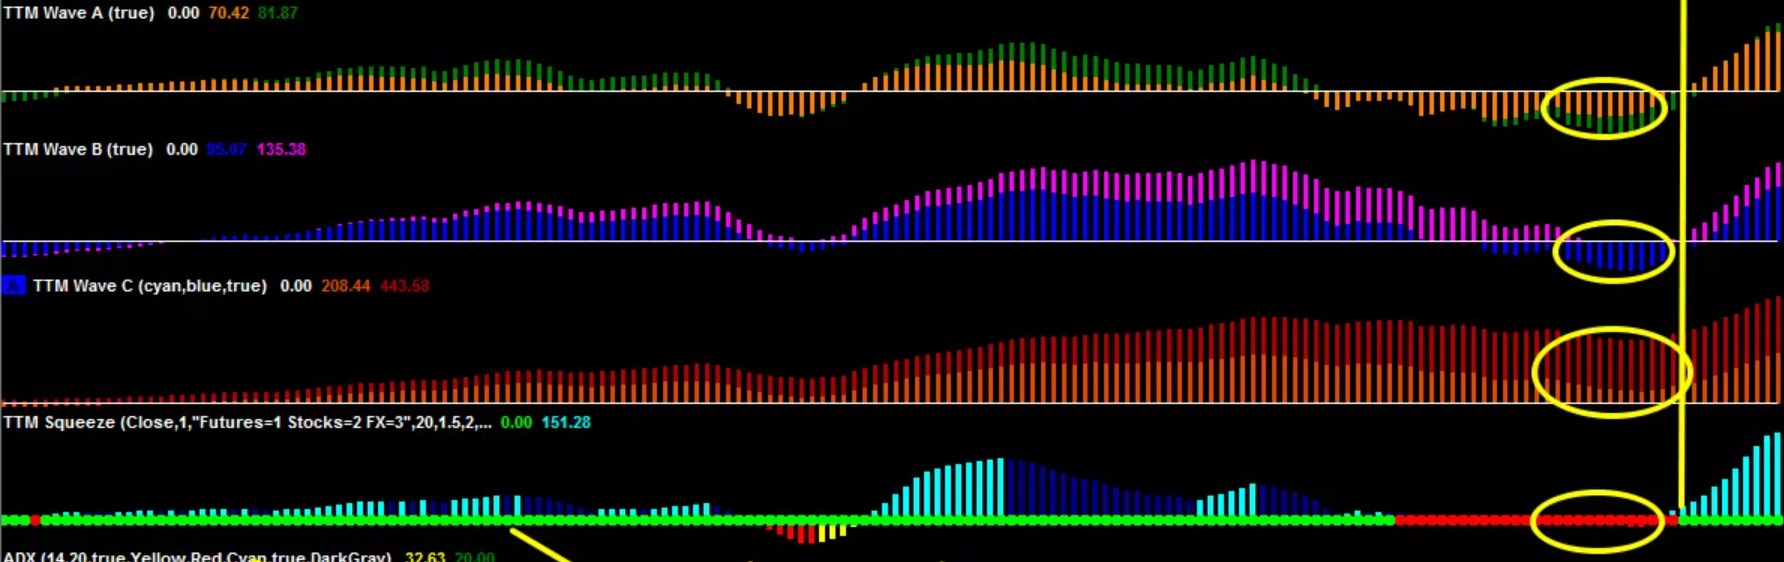
    I found the TTM squeeze/ price, I also would like to use the waves in conjunction to the primary indicator.

    (See attached )

    I would really appreciate if someone could create these waves,

    Thanks in advance

    TTM-wave.jpg TTM-wave.jpg
    #89834 quote
    therealdaytherealday
    Participant
    New

    Here is a similar coding, but it is buggy

    Wave momentums

    #89846 quote
    NicolasNicolas
    Keymaster
    Legend

    Why buggy? TTM waves are similar to MACD but with different periods settings, FYI.

    #89961 quote
    therealdaytherealday
    Participant
    New

    They don’t work at times and arn’t aesthetically pleasing


    @Nicolas
    , do you think you could make better waves that are similar to the picture?

    #89966 quote
    NicolasNicolas
    Keymaster
    Legend

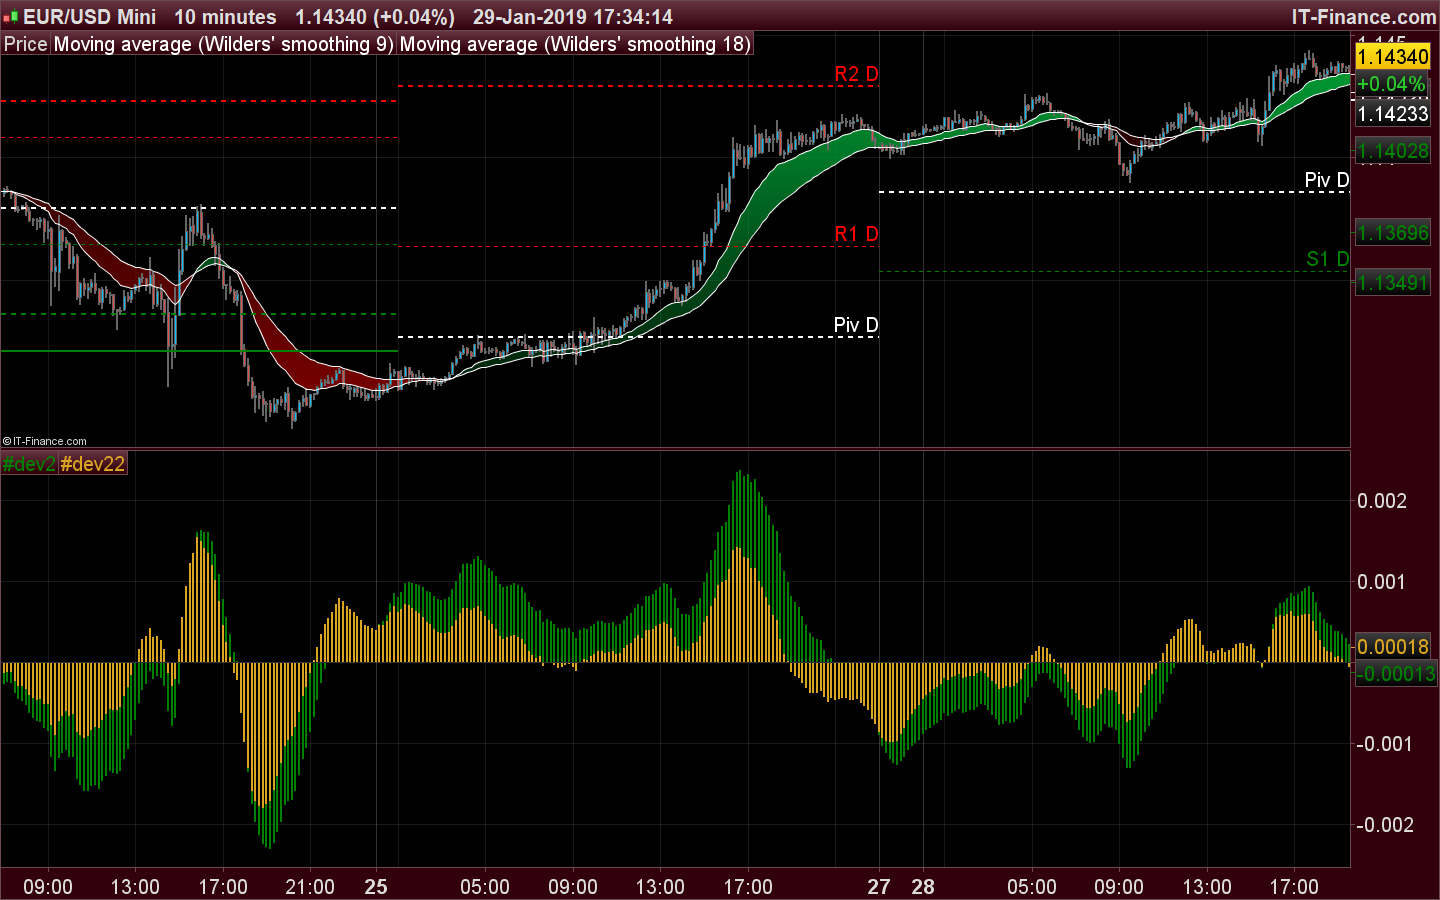
    Example for Wave A of the indicator you posted the link above:

    macd1= exponentialaverage[8](close)-exponentialaverage[34](close)
    signal1= average[34,1](macd1)
    hist1= macd1-signal1
    macd2= exponentialaverage[8](close)-exponentialaverage[55](close)
    signal2= average[55,1](macd2)
    hist2= macd2-signal2
    
    return hist2 coloured(0,128,0) style(histogram),hist1 coloured(218,165,32) style(histogram)

    You need to change the periods in order to get the waves B and C.

    TTM-WAVES.png TTM-WAVES.png
    #90007 quote
    therealdaytherealday
    Participant
    New

    That A wave worked perfectly @nicolas, i appreciate it!

    I tried changing the periods to the following for wave B.. The wave just disappeared

    macd1= exponentialaverage[8](close)-exponentialaverage[89](close)
    signal1= average[89,1](macd1)
    hist1= macd1-signal1
    macd2= exponentialaverage[8](close)-exponentialaverage[144](close)
    signal2= average[144,1](macd2)
    hist2= macd2-signal2
    
    return hist2 coloured(0,128,0) style(histogram),hist1 coloured(218,165,32) style(histogram)


    I have no idea what I’m doing when it comes to coding, sorry if i’m being a nuisance…

    #90010 quote
    NicolasNicolas
    Keymaster
    Legend

    If you replace the original code by another, it is obvious that the older one ‘disappear’ 🙂

    Make a different indicator for each of the Wave, that’s the easier solution and name them differently: Wave A, Wave B, Wave C.

    therealday thanked this post
    #90014 quote
    therealdaytherealday
    Participant
    New

    Thanks mate, my bad…

    finally i would like to change the colour for waves B and C.

    How would I go about doing this, or is there a video I should watch?

    #90015 quote
    VonasiVonasi
    Moderator
    Master

    COLOURED

    Click on the colour chart image to see what numbers give you what colours.

    therealday thanked this post
    #90023 quote
    NicolasNicolas
    Keymaster
    Legend

    This website is my favourite to pick nice colors easily: http://cloford.com/resources/colours/500col.htm

    Vonasi and therealday thanked this post
Viewing 10 posts - 1 through 10 (of 10 total)
  • You must be logged in to reply to this topic.

ProRealAI ProRealAI New

Stuck on this ProBuilder code?

Describe what this topic is trying to build, in plain English, and ProRealAI writes the ProRealTime™ indicator, screener or system for you.

Available in 7 languages
Try ProRealAI

John Carter TTM Waves


ProBuilder: Indicators & Custom Tools

New Reply
Author
author-avatar
therealday @theproday Participant
Summary

This topic contains 9 replies,
has 3 voices, and was last updated by NicolasNicolas

7 years, 8 months ago.

Topic Details
Forum: ProBuilder: Indicators & Custom Tools
Language: English
Started: 01/27/2019
Status: Active
Attachments: 2 files
ProRealCode ProRealCode
Loading...