JS
JSParticipant
Senior
Hi @sam00075
Here’s the screener for the “Bearish BreakOut”…
// today variation
tdVar = (Open - Close) / Close * 100

// Var condition
avgVar = 0
for i = 1 to 10 do
if (close[i] > open[i]) then
avgVar = avgVar + (close[i] - open[i]) / open[i]
else
avgVar = avgVar + (open[i] - close[i]) / close[i]
endif
next
avgVar = avgVar / 10 * 100

c1 = tdVar > avgVar

// Lowest break condition
minValue = Lowest[10](Low)[1]
c2 = minvalue < Open and Close < minvalue

// Volume condition
avgVol = average[20](volume)
sum = 0
for i=0 to 20
if (volume[i] < avgVol*10) then
sum = sum + volume[i]
else
sum = sum + avgVol
endif
next

avgVol = sum / 21
c3 = avgVol > 1000

// Breakout Var%
breakoutVar = (close - minvalue)/close*100

// Screener
SCREENER[c1 and c2 and c3](breakoutVar as "Breakout Var%")
Awesome ! A big Thank you.
Hello
@JS , thanks again for the last code, works like a charm.
I need your help for another one if you have time : I’d like to add some criterias to the screener “Break out with high volume”
https://www.prorealcode.com/prorealtime-market-screeners/screener-break-out-with-high-volume/
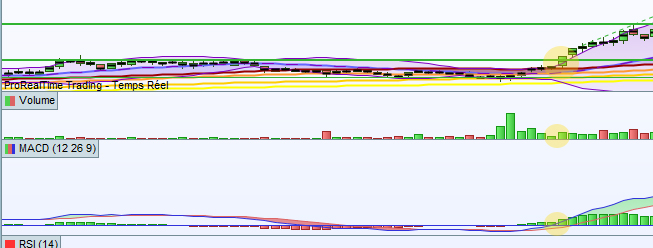
1- The price candle spreads the Bollinger band to the upside.
2- The MACD baseline is touched, and broken to the upside.
3- The volume is bigger than the last candle (tho i guess it’s already the case in the actual code ?)
I joined a picture as an example for the configuration i’m looking for.
Thank you in advance.
JSParticipant
Senior
Hi Sam,
How many periods do you want to use for the Bollinger Band and how much standard deviation?
The BollingerUp[period](Close) uses 2 standard deviations I think…
For the MACD, use the line: MACDLine[12,26,9](Close) or MACD[12,26,9](Close)?
The volume larger than the last candle is not yet specific in the code but is no more than: C5=Volume>Volume[1]
JSParticipant
Senior
Forget the stupid question about the MACD… (I’m not very familiar with MACD)
Do you mean this:
C4=MACD[12,26,9](Close) CrossesOver MACDLine[12,26,9](Close)
Hi
@JS , thanks for the quick reply.
– i don’t know what the technical term is for the MACD : What i meant is Cross the Horizontal line, in direction of the upside, i think the Horizontal line value is 0,00
– for the bollinger band standard deviation, and periods, i have no idea, if you can please do what you think is best, we’ll ajust if needed.
– for the volume, let’s test the without adding this part, just keeping what’s in the original code, we’ll see if it’s needed after testing the code.
JSParticipant
Senior
Hi Sam,
Hereby the screener with the extra conditions:
// today variation
tdVar = (close[0] - open[0]) / open[0] * 100

// Var condition
avgVar = 0
for i = 1 to 10 do
if (close[i] > open[i]) then
avgVar = avgVar + (close[i] - open[i]) / open[i]
else
avgVar = avgVar + (open[i] - close[i]) / close[i]
endif
next
avgVar = avgVar / 10 * 100

c1 = tdVar > avgVar

// highest break condition
maxValue = highest[10](high)[1]
c2 = maxvalue < close and open < maxvalue

// Volume condition
avgVol = average[20](volume)
sum = 0
for i=0 to 20
if (volume[i] < avgVol*10) then
sum = sum + volume[i]
else
sum = sum + avgVol
endif
next

avgVol = sum / 21
c3 = avgVol > 1000

// Breakout Var%
breakoutVar = (close - maxvalue)/close*100

// Extra Conditions
c4=Close Crosses Over BollingerUP //The price candle spreads the Bollinger band to the upside.

c5=MACD[12,26,9](Close) Crosses Over 0 //The MACD baseline is touched, and broken to the upside.

//c6=Volume>Volume[1] //The volume is bigger than the last candle

// Screener
SCREENER[c1 and c2 and c3 and c4 and c5](breakoutVar as "Breakout Var%")
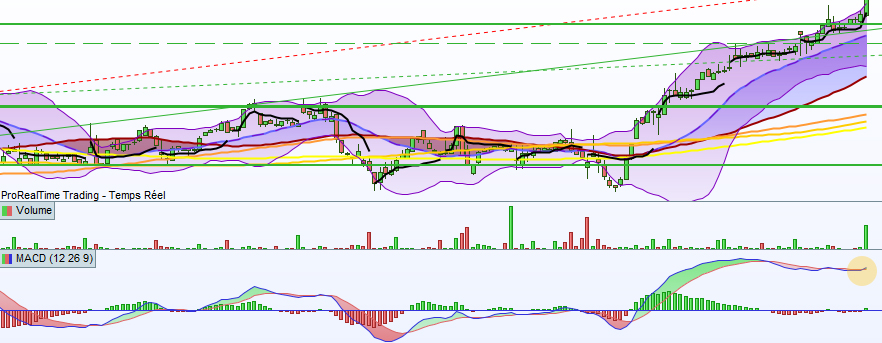
Awesome ! You even included the .ift
– For the Bollinger it seems good.
– For the MACD it shows some results that are far from the Horizontal Baseline, like the joined picture.
Do you know the reason ?
JSParticipant
Senior
What I see in your screenshot is that the MACD is correct, it goes from red to green in the last bar…
It’s about the zero line, MACD crosses the zero line upwards…
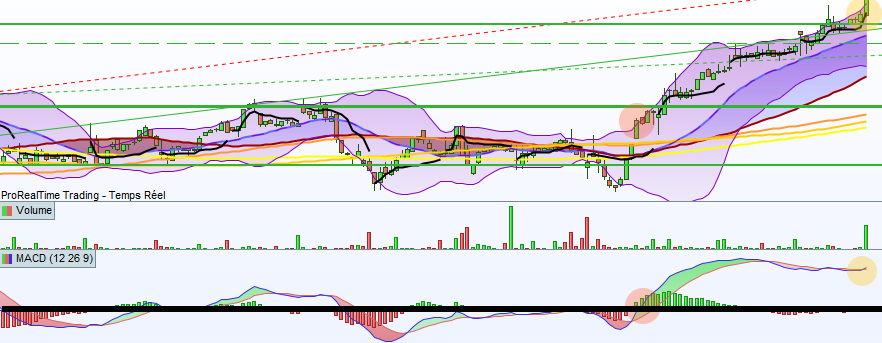
Sorry i didn’t know how to express it better,
please see the joined picture i drawed the line in Black, this is the one i want to be crossed.
JSParticipant
Senior
For me that is the zero line…you see the crossing (from red to green) in the last bar…
JSParticipant
Senior
You only have to look at the last bar, the screener looks for stocks that now meet the conditions and when you call up the graph of the stock it is always about the last bar (where all conditions are true)…
Yes screeners are for the last bar, Agree.
The picture was just as an example, what i would like is the detection when the Black line is crossed.
JSParticipant
Senior
We’re talking past each other… 🙂
How do you call that black line… what function does it have in the MACD?