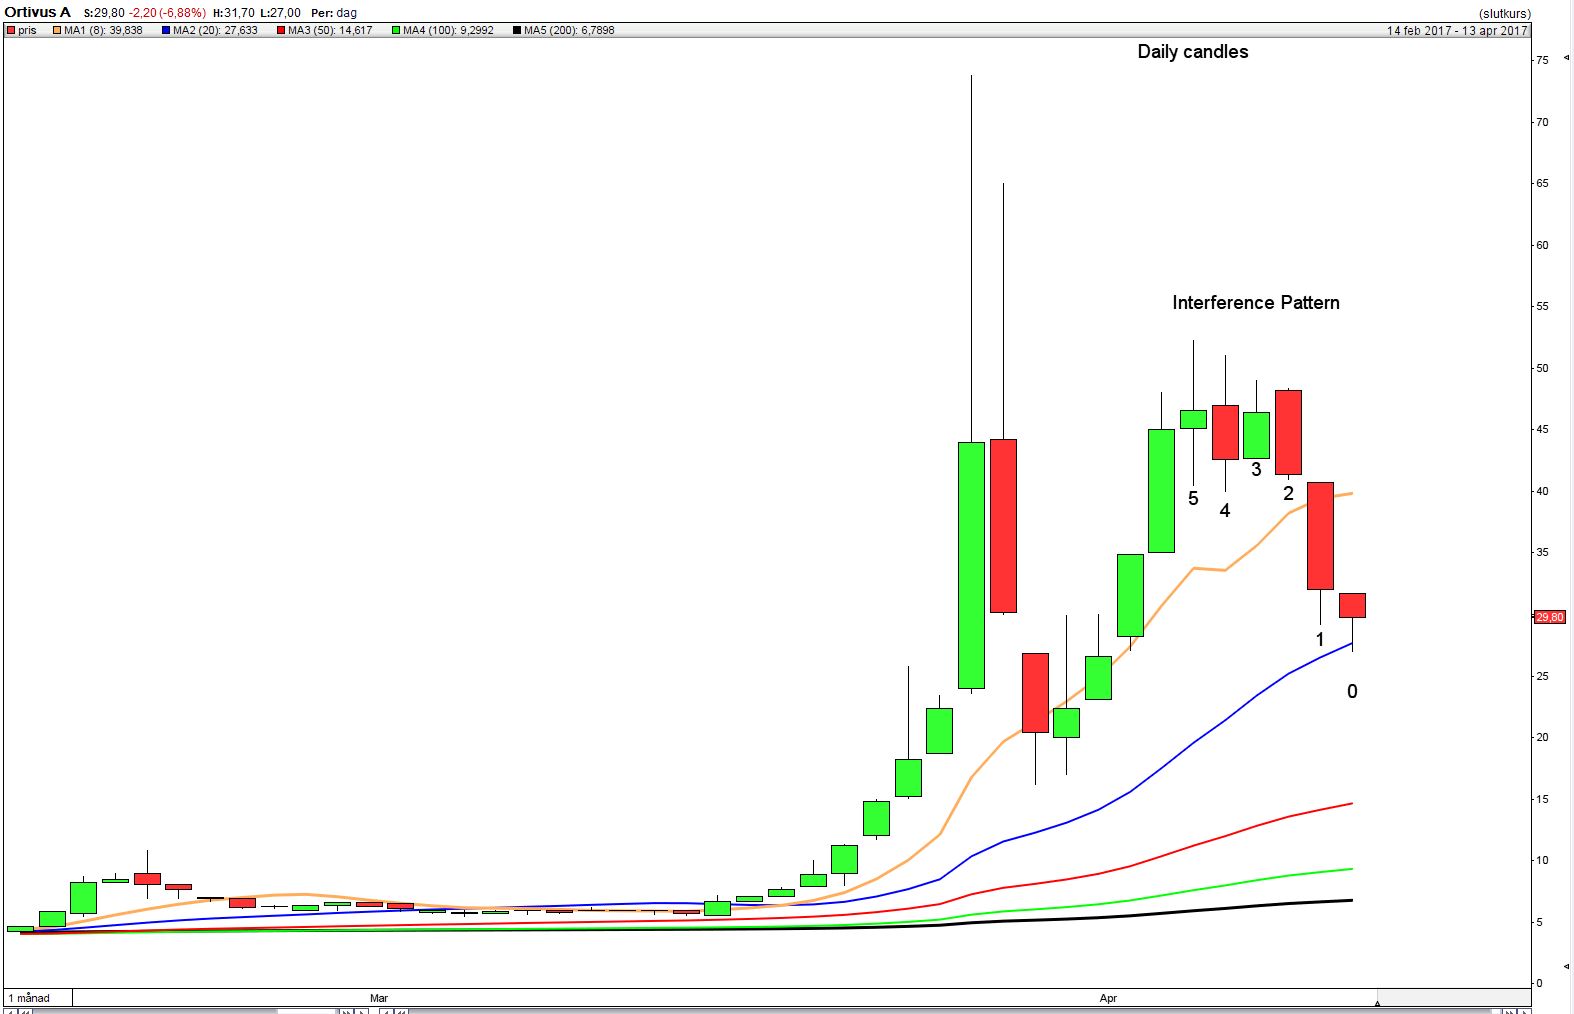
A very nice candlestick pattern is the interference pattern. The criterias for the pattern are:
Day 0 must Close lower than day 1
Day 1 must Close Lower than day 2
Day 2 must Close lower than day 3
Day 3 must Close higher than day 4
Day 4 must Close Lowe than day 5
Sometimes the colour of the candlesticks can be different, but that doesn’t matter, as long as the closing is lower
in all candles, besides from day 3, which must have a higher Close.
Can you help me to tell what was wrong with my code? The screenerresults
are showing stocks with this pattern, but it is also showing some other stocks where the criterias are not fulfilled. So something is wrong with my code. :-(, and I have
tried for hours to fix it, but without success. As you maybe can guess, I am new to this with programming, and this is my first attempt.
Would appreciate the correct
code, and maybe information what was wrong with the code from me: My code was like this:
c1 = (close < close[1])
c2 = (close[1] < close[2])
c3 = (close[3] > close[4])
c4 = (close[4] < close[5])

SCREENER[c1 AND c2 AND c3 AND c4] ((close/DClose(1)-1)*100 AS "%Chg yest.")
Thanks!
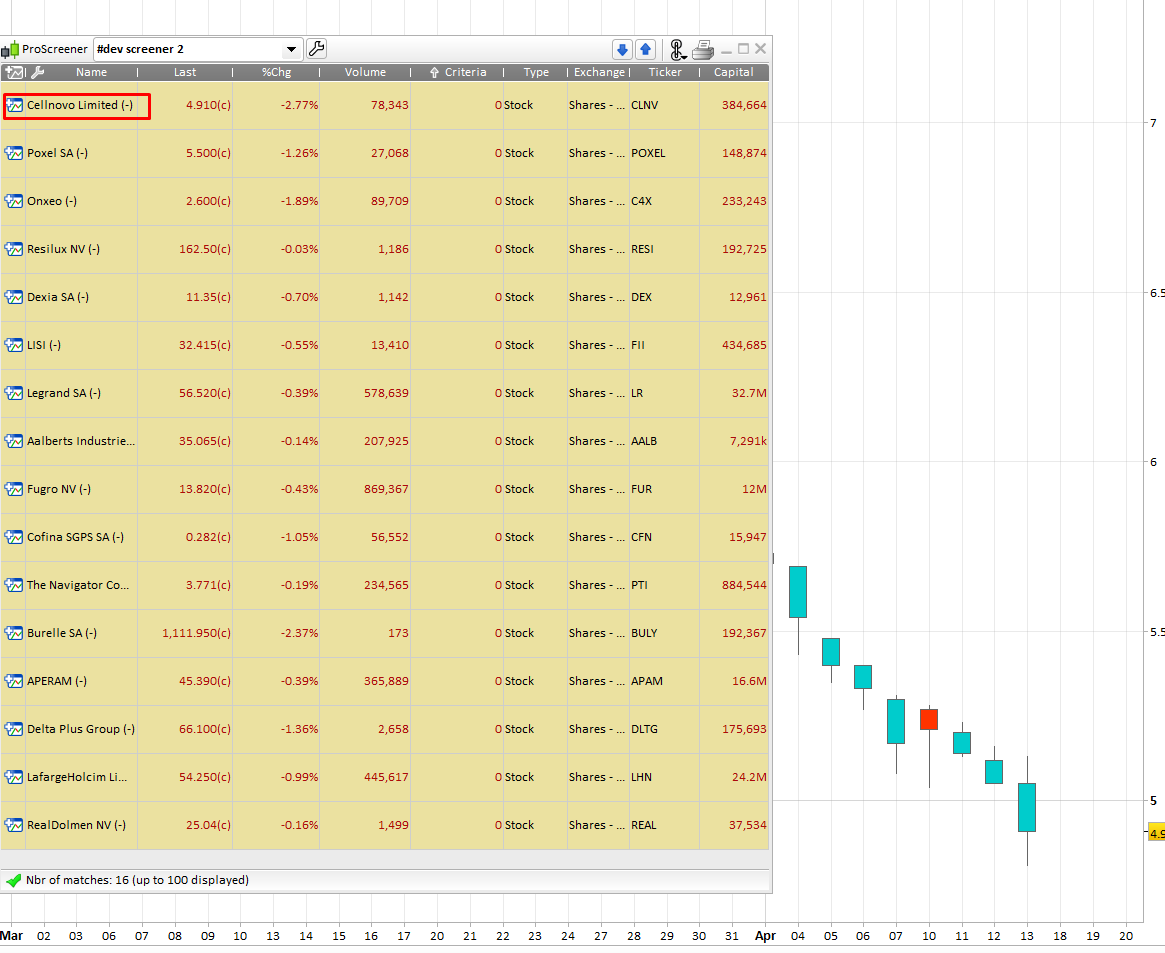
If I understood correctly your query, this code should do the trick:
c = close<close[1] and close[1]<close[2] and close[2]<close[3] and close[3]>close[4] and close[4]<close[5]

screener[c]
Please find attached an example of results on Euronext shares list.
It works wonderfully! 🙂 Thanks a lot!!!
So you go long at next bar open after this pattern is found? Do you filter the major trend also? Or is this pattern occurrence can be traded as is?
Yes tell us more please
Djfromsweden … I did a quick search on google and couldn’t find much at all re Interference Pattern. Do you have any reference links I could read … I keep an open mind for anything new! 🙂
Thanks
GraHal
OMG Grahal you are now a Master member! Congratulations! 😉
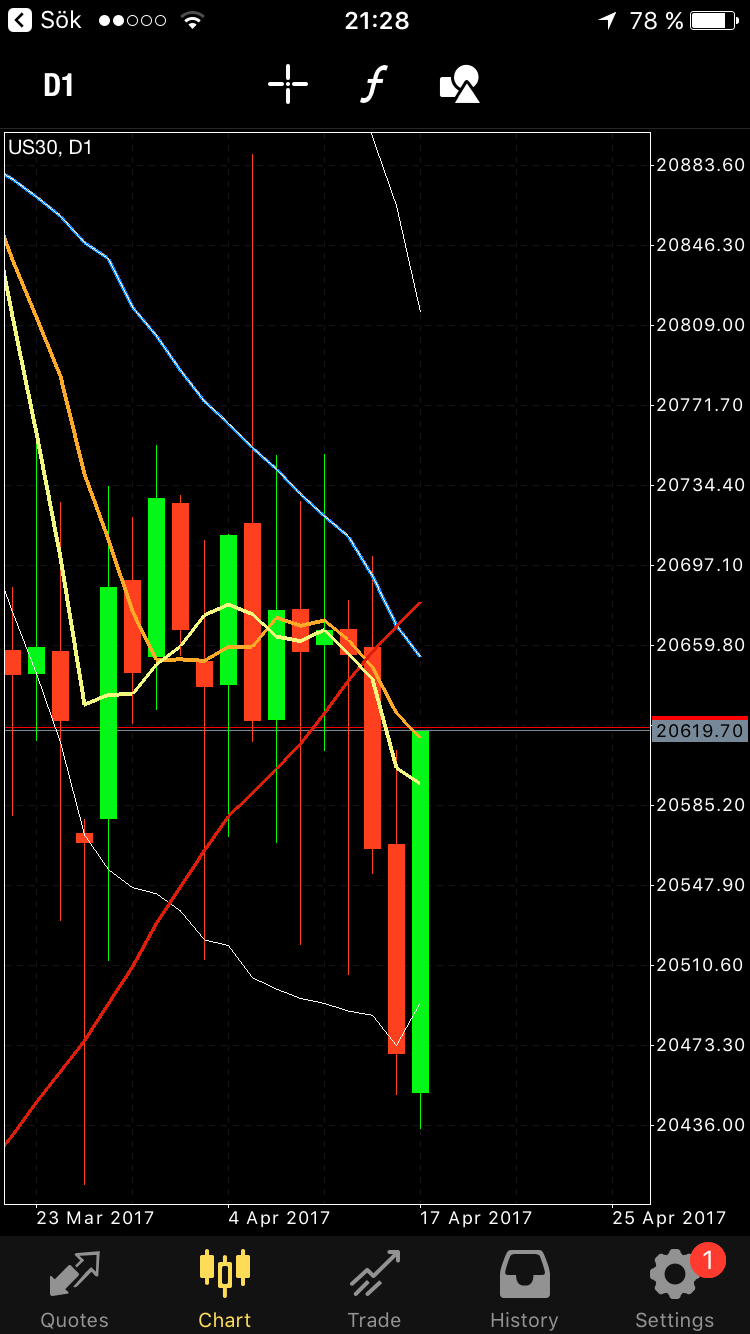
The original way to trade the pattern, is to buy it at the close at the end of the formation. The assumption is that it will go up. Very often it goes up allready next day, but sometimes it takes longer. One exit strategy could be to sell it the first day that you have profit on the position at the close of that day. If no profit on the position after five days, close anyway. Stop loss could be 3ATR down. (that is a wide stop loss not to mess up with the patterns possibility) We have one interference formed on thursday before the holiday, and today we have a string movement upwards, in the dow Jones future. See my attached picture.
The pattern has a very high accurucy. It’s hitrate is more than 80% of certain markets. It works very well on popular instruments (heavily traded Products), like
for example Equity indices, Eur/usd, Gold, and bigger stocks. It works better in bullmarkets, than in bearmarkets, but can be used in both. When the formation is not
working, the drawdown can be big, so what stop loss to be used can be individual, according to you trading style. The pattern, can also be used as a filter, meaning that
you could wait until the next day of the formation, and wait for some bying signal in a lower timeframe like the 1 hour chart, and then you try to trade it with a long position.
In this case you can have a much tighter stop loss.
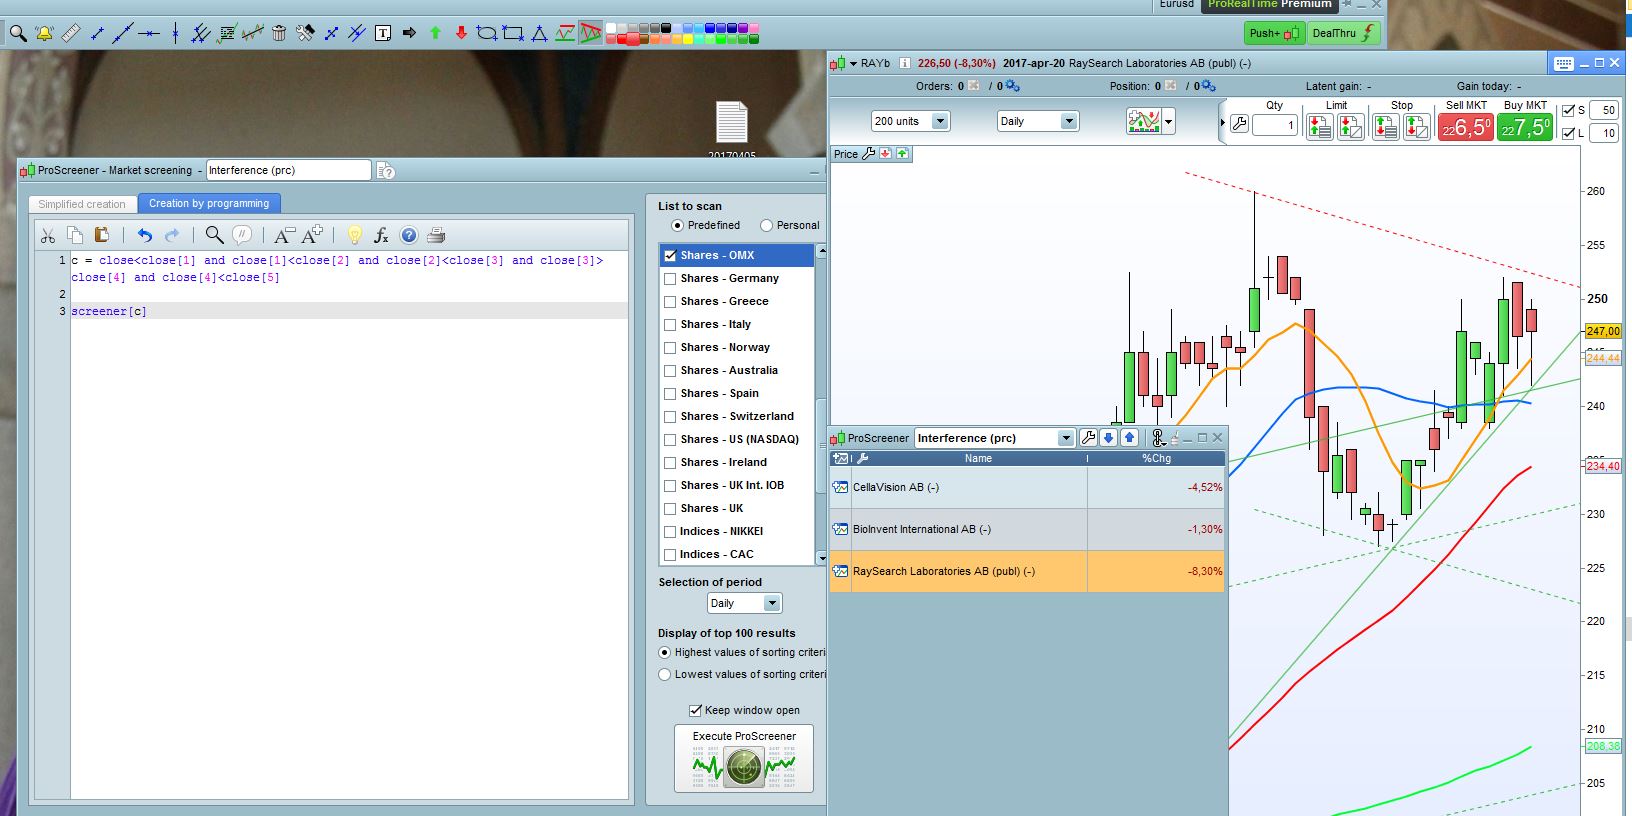
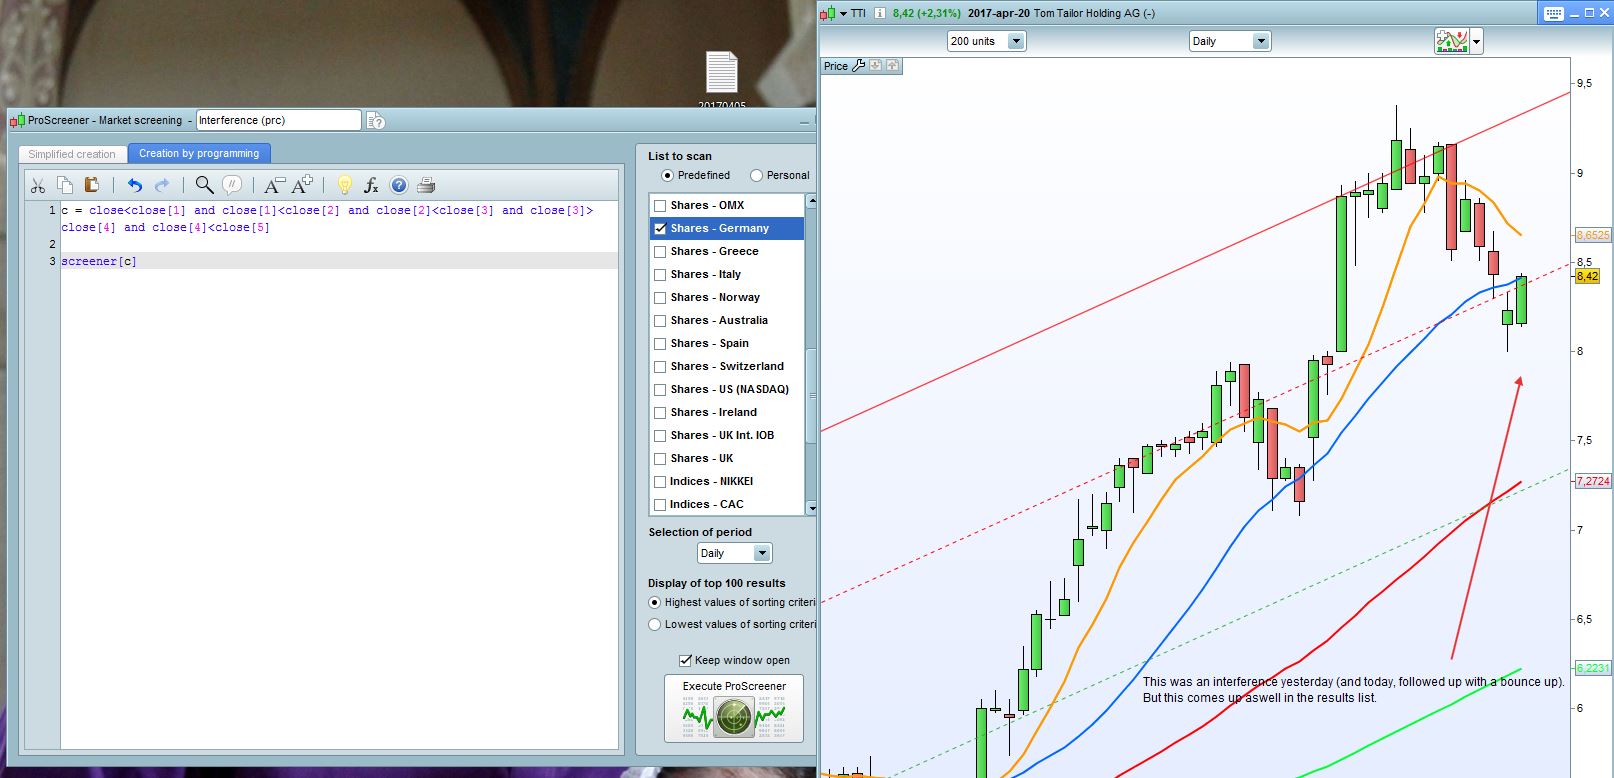
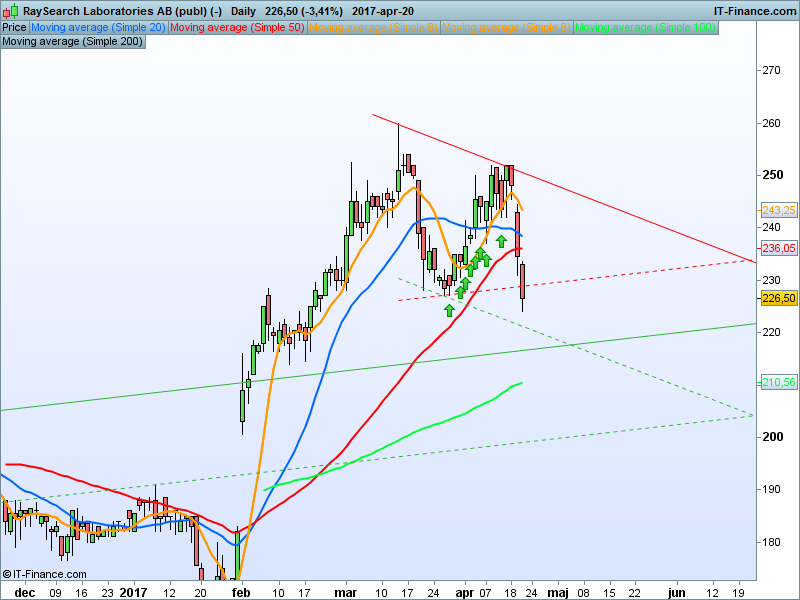
Hi Nicolas! When I use the screener on the Swedish stockmarket, there is one stock showing up, even though it is not an interference pattern. See my attached Pictures. On the second Picture, there was an interference pattern, one day earlier, but this comes up in the result list. Is there anything we can change in the code?
Did you subscribe to the live data feeds for these stocks lists?
Hi Nicolas. In my first example, the stock named RAYb, I have live data, but the charts have been showing completely wrong. I don’t know why. I should ask IG about that. When I open the chart today, it looks completely differently. See the new attached Picture. I have been putting green Arrows to every candlesticks which looks different. And
now it is a inteference pattern, so the screener did it’s job! 🙂
In the second example (where I don’t have any livedata yet) a stock named Tom Tailor Holding, (on the german stock market), the chart still look the same
like yesterday.
If you don’t own the subscription to live data, you’ll always be 1 bar late, I can’t do anything for it!