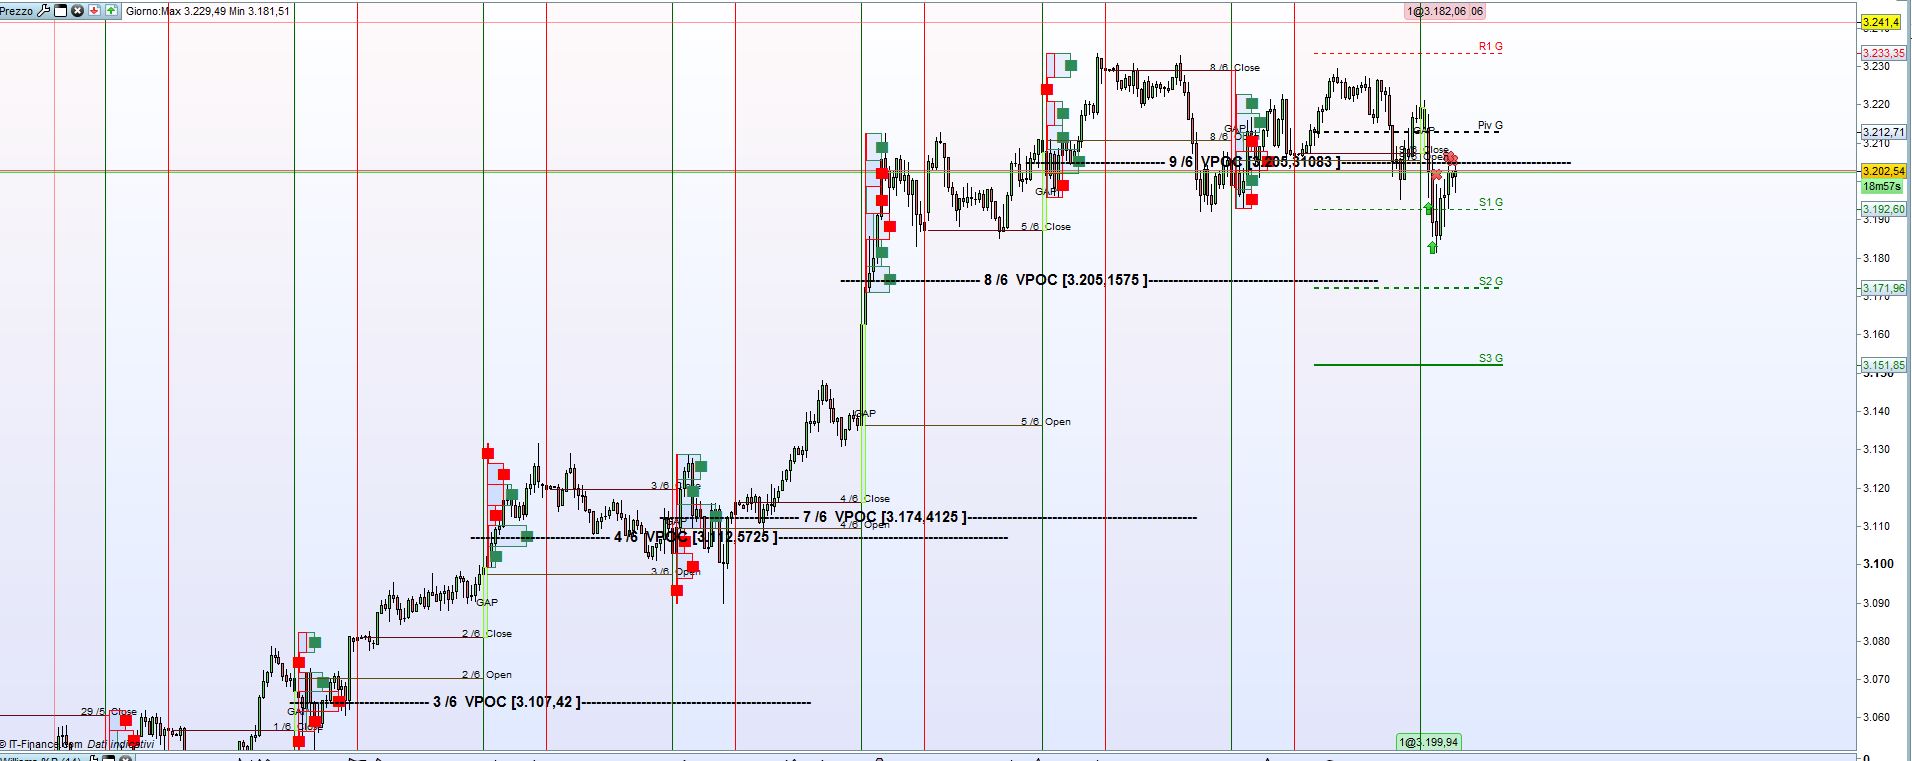
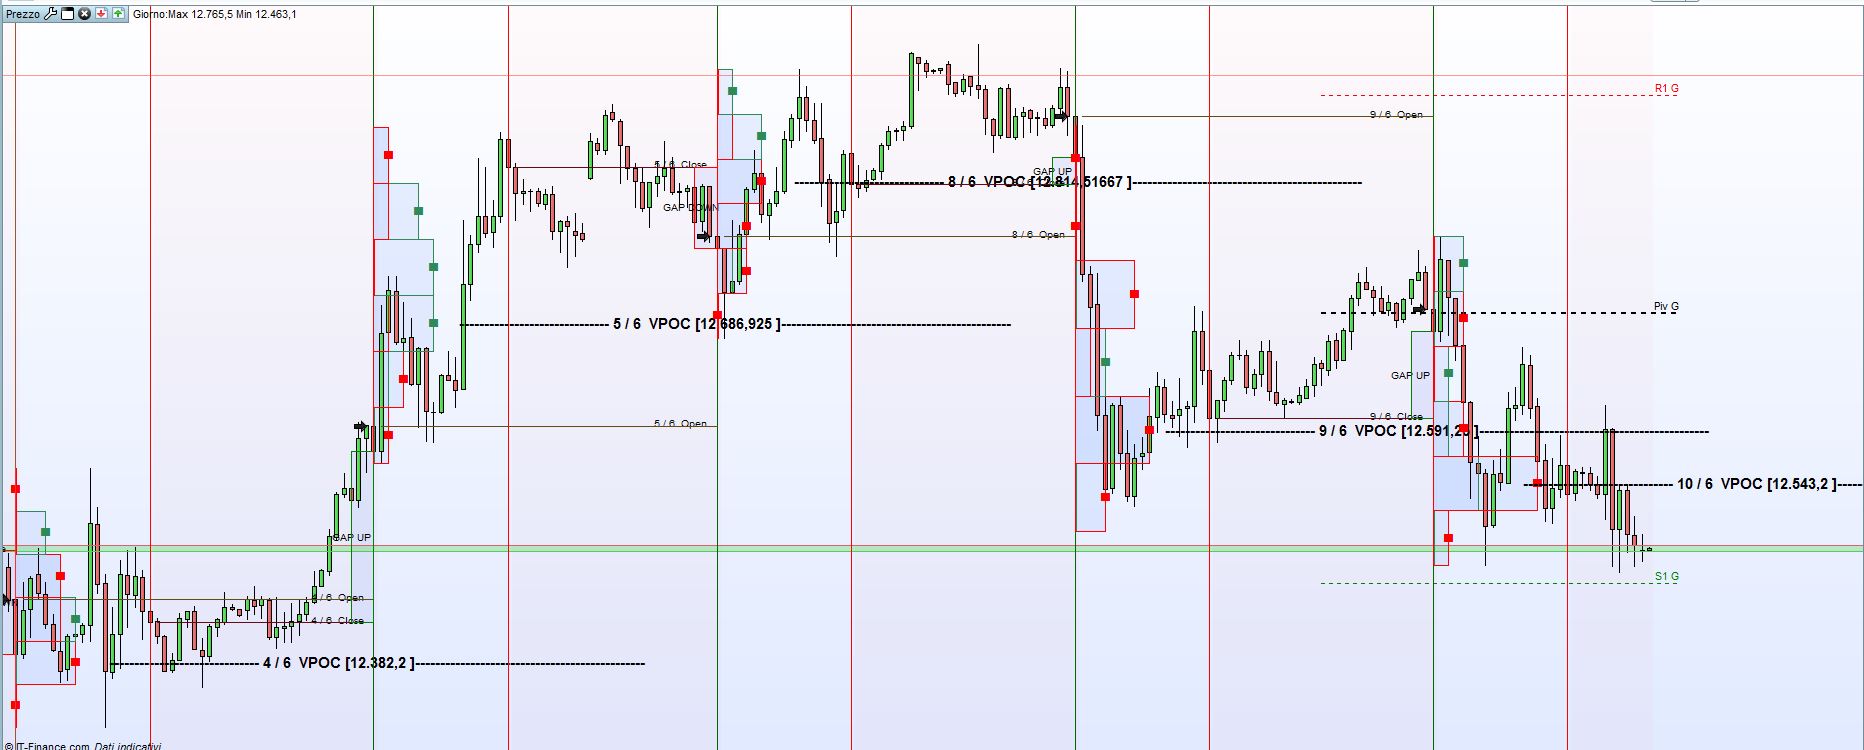
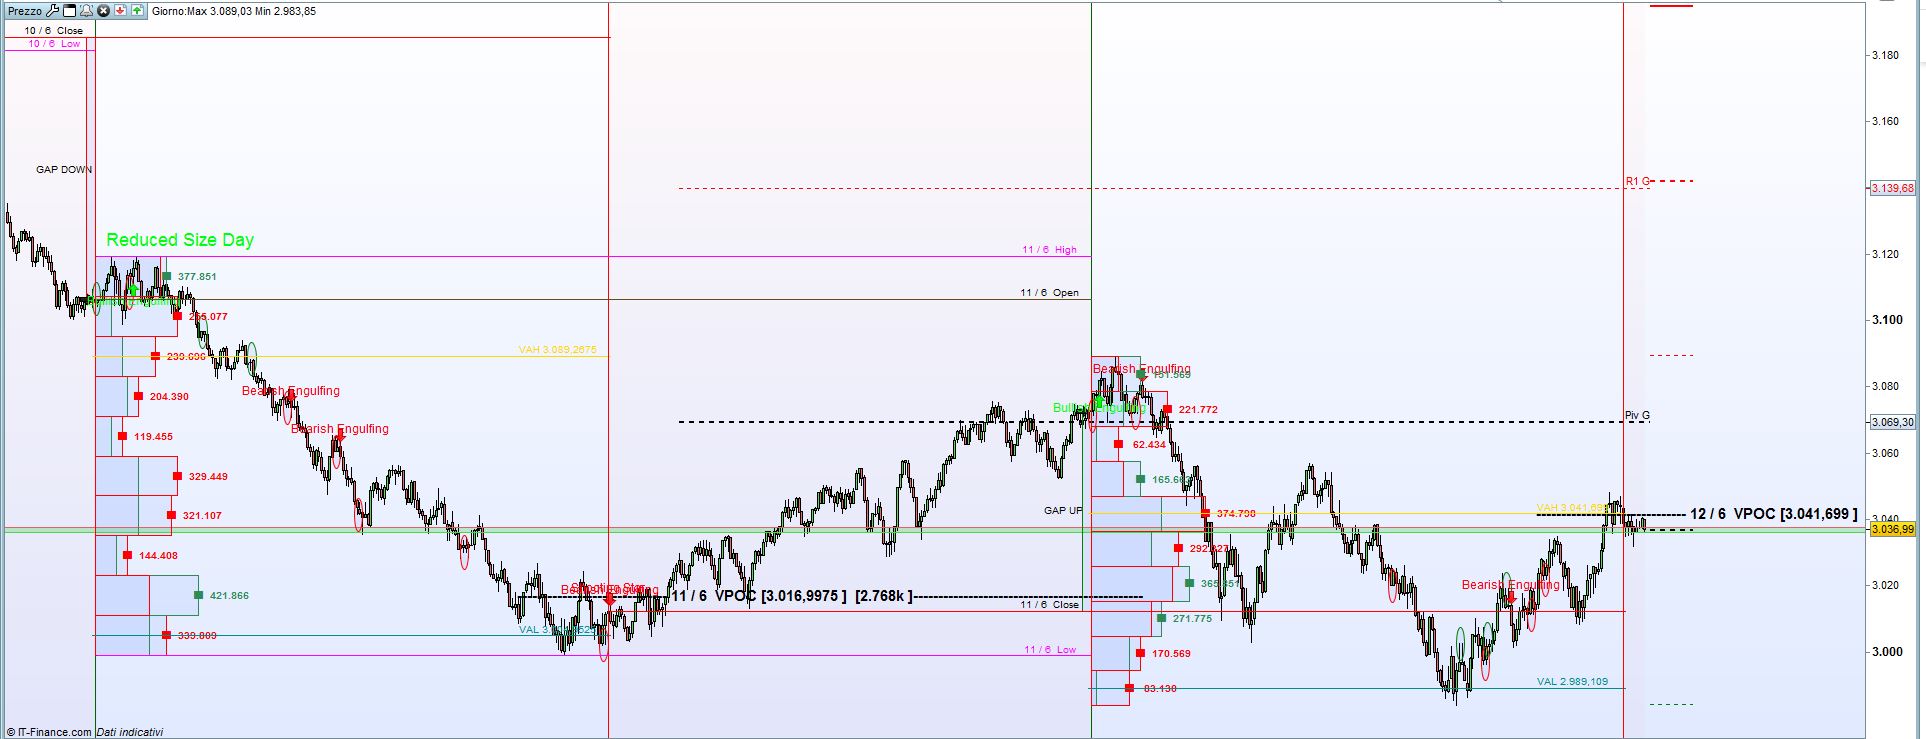
Nuova versione 1.4, con alcune modifiche
-La scritta VPOC adesso si colora rossa o verde in base alla prevalenza di scambi (non so se abbia molto senso questa cosa)
-Aggiunta la configurazione per la percentuale del calcolo della val (solitamente 70%) il valore deve essere indicato in decimali esempio: 0.7
Qualche suggerimento:
ValNbrBars non deve essere superiore a 10 (purtoppo nella versoine 10.3 di prorealtime non ci sono gli array, e quindi ho dovuto bloccare a 10 alcuni calcoli)
ValMinMaxFactor meglio se compreso tra 0 e 1 per dare un segnale affidabile
Esempi di configurazione
DAX
***30min***
ValStart:9
valStop:18
ValMinMaxFactor: 1
ValNbrBars: 8
ValVolPerc: 0.7
***5min***
ValStart:9
valStop:18
ValMinMaxFactor: 1
ValNbrBars: 9
ValVolPerc: 0.7
***333ticks***
ValStart:9
valStop:18
ValMinMaxFactor: 0.5
ValNbrBars: 7
ValVolPerc: 0.7
//v1.4
//defparam drawonlastbaronly=true
defparam calculateonlastbars=1500
HourStart=ValStart //15
HourStop=ValStop //23
dataOggi=date
ScaleFactor=2
NbrBars=ValNbrBars
//ValMinMaxFactor=1
dataTemp=dataOggi
Conteggio=0
once SelEnd=0
once SelStart=0
once CountDays=0
once PrezzoChiusura=0
once PrezzoApertura=0
once PrezzoLow=0
once PrezzoHigh=0
once ColoreSfondo=0
once LastStartBarIndex=0
once LastStopBarIndex=0
once LastPrezzoChiusura=0
Conteggio=Conteggio+1
if date[Conteggio]<> dataTemp then
CountDays=CountDays+1
SelEnd=0
SelStart=0
endif
OraBarra=openhour[Conteggio]
//Calcolo Doppi Max/Min
MinMaxFactor=ValMinMaxFactor*pipsize
DiffHigh=abs(high[1]-high[2])
DiffMin=abs(low[1]-low[2])
Doppio=0
if DiffHigh <= MinMaxFactor and SelStart=1 then
DRAWELLIPSE(barindex, high[1]-(5*pipsize), barindex[3], high[2]+(5*pipsize))Coloured(0,128,0)
Doppio=1
endif
if DiffMin <= MinMaxFactor and SelStart=1 then
DRAWELLIPSE(barindex, low[1]+(5*pipsize), barindex[3], low[2]-(5*pipsize))Coloured(255,0,0)
Doppio=1
endif
if OraBarra=HourStart and SelStart=0 then //Inizio sessione
DRAWVLINE(Barindex[Conteggio])Coloured(0,100,0)
DRAWTEXT("#DayStart#/ #MonthStart# Close ", barindex, PrezzoChiusura+(2*pipsize))
DRAWTEXT("#DayStart#/ #MonthStart# Open ", barindex, PrezzoApertura+(2*pipsize))
DRAWTEXT("#DayStart#/ #MonthStart# High ", barindex, PrezzoHigh+(2*pipsize))Coloured(255,0,255)
DRAWTEXT("#DayStart#/ #MonthStart# Low ", barindex, PrezzoLow+(2*pipsize))Coloured(255,0,255)
DRAWSEGMENT(Barindex[Conteggio],PrezzoChiusura,LastStopBarIndex,PrezzoChiusura) Coloured(255,0,0)
DRAWSEGMENT(Barindex[Conteggio],PrezzoApertura,LastStartBarIndex,PrezzoApertura) Coloured(100,75,22)
DRAWSEGMENT(Barindex[Conteggio],PrezzoHigh,LastStartBarIndex,PrezzoHigh) Coloured(255,0,255)
DRAWSEGMENT(Barindex[Conteggio],PrezzoLow,LastStartBarIndex,PrezzoLow) Coloured(255,0,255)
//DRAWSEGMENT(Barindex[Conteggio],ValH,LastStopBarIndex,ValH) Coloured(210,105,30)
//DRAWSEGMENT(Barindex[Conteggio],ValL,LastStopBarIndex,ValL) Coloured(0,139,139)
if Close[conteggio]>PrezzoChiusura then
//Green
R=0
G=128
B=0
DRAWTEXT("GAP UP ", barindex, (Close[conteggio]+PrezzoChiusura)/2)
else
R=255
G=0
B=0
DRAWTEXT("GAP DOWN ", barindex, (Close[conteggio]+PrezzoChiusura)/2)
endif
DRAWRECTANGLE(Barindex-4,Close[conteggio],Barindex[1],PrezzoChiusura) Coloured(R,G,B)
//DRAWTEXT("GAP", barindex, (Close[conteggio]+PrezzoChiusura)/2)
DayStart=day
MonthStart=month
if DayStart and MonthStart then
endif
LastStartBarIndex=barindex
LastPrezzoChiusura=PrezzoChiusura
//LastPrezzoApertura=PrezzoApertura
LastPrezzoLow=PrezzoLow
LastPrezzoHigh=PrezzoHigh
PrezzoApertura=open[Conteggio]
DRAWARROW(barindex-2, open[Conteggio])
SelStart=1
ColoreSfondo=0
maxbar=0
LastStartBarIndex=barindex
LastPrezzoChiusura=PrezzoChiusura
VolBar0=0
VolBar1=0
VolBar2=0
VolBar3=0
VolBar4=0
VolBar5=0
VolBar6=0
VolBar7=0
VolBar8=0
VolBar9=0
VolBar10=0
PriceBar0=0
PriceBar1=0
PriceBar2=0
PriceBar3=0
PriceBar4=0
PriceBar5=0
PriceBar6=0
PriceBar7=0
PriceBar8=0
PriceBar9=0
PriceBar10=0
//vPocNBar=0
vPocVol=0
ValH=0
ValL=0
//DisegnaLariga
endif
LastBarOnChart=Currenthour+1=openhour and Currentminute=openminute and date=today// Currenttime+010000=time and date=today //Currenthour+1=hour and Currentminute=minute and date=today
if LastBarOnChart then
ValLastBarOnChart=1
else
ValLastBarOnChart=0
endif
if OraBarra=HourStop and SelEnd=0 or SelStart=1 and ValLastBarOnChart=1 then
PrezzoChiusura=close[Conteggio]
DayStop=day
MonthStop=month
//Calcolo POC
StopLookback=barindex-LastStartBarIndex+1
hh=highest[StopLookback](high)
ll=lowest[StopLookback](low)
div = (hh-ll)/NbrBars
i=0
volsum=summation[StopLookback](volume)
volsum70=volsum*ValVolPerc //0.7
startbar = barindex[StopLookback]
maxbar = 0
vPocNBar=0
PrezzoLow=ll
PrezzoHigh=hh
ValH=0
ValL=0
while i<NbrBars do
lrange=ll+div*i
hrange=lrange+div
volbull=0
volbear=0
voltot=0
pricelevel=0
ij=1
//for ij = 1 to StopLookback do
while ij<StopLookback do
j=ij
if close[j]>=lrange and close[j]<=hrange then
if close[j]>open[j] then
volbull=volbull+volume[j]
else
volbear=volbear+volume[j]
endif
endif
ij=ij+1
wend
//next
voltot=volbull+volbear
pricelevel=(lrange+hrange)/2
bullbar = round((volbull*StopLookback)/volsum)*scalefactor
bearbar = round((volbear*StopLookback)/volsum)*scalefactor
drawrectangle(startbar,lrange,startbar+bullbar,hrange) coloured(46,139,87)
drawrectangle(startbar,lrange,startbar+bearbar,hrange) coloured(255,0,0)
if bullbar>bearbar then
drawtext("■",startbar+bullbar,(lrange+hrange)/2,Dialog,Bold,10) coloured(46,139,87)
drawtext(" #voltot#",startbar+bullbar,(lrange+hrange)/2,Dialog,Bold,10) coloured(46,139,87)
else
drawtext("■",startbar+bearbar,(lrange+hrange)/2,Dialog,Bold,10) coloured(255,0,0)
drawtext(" #voltot#",startbar+bearbar,(lrange+hrange)/2,Dialog,Bold,10) coloured(255,0,0)
endif
if i=0 then
VolBar0=voltot
PriceBar0=pricelevel
endif
if i=1 then
VolBar1=voltot
PriceBar1=pricelevel
endif
if i=2 then
VolBar2=voltot
PriceBar2=pricelevel
endif
if i=3 then
VolBar3=voltot
PriceBar3=pricelevel
endif
if i=4 then
VolBar4=voltot
PriceBar4=pricelevel
endif
if i=5 then
VolBar5=voltot
PriceBar5=pricelevel
endif
if i=6 then
VolBar6=voltot
PriceBar6=pricelevel
endif
if i=7 then
VolBar7=voltot
PriceBar7=pricelevel
endif
if i=8 then
VolBar8=voltot
PriceBar8=pricelevel
endif
if i=9 then
VolBar9=voltot
PriceBar9=pricelevel
endif
if i=10 then
VolBar10=voltot
PriceBar10=pricelevel
endif
//VPOC
if(voltot>maxbar) then
vpoclevel = (lrange+hrange)/2
maxbar=voltot
if bullbar>bearbar then
RPoc=46
GPoc=139
BPoc=87
else
RPoc=255
GPoc=0
BPoc=0
endif
ValH=vpoclevel
ValL=vpoclevel
VPocNBar=i
vPocVol=voltot
endif
i=i+1
wend
///if intradaybarindex=1 then
yesterdayVPOC=vpoclevel
drawtext(" ------------------------------ #DayStop#/ #MonthStop# VPOC [#yesterdayVPOC#] [#VolSum#]----------------------------------------------",BarIndex,vpoclevel,dialog,bold,15) coloured(RPoc,GPoc,BPoc)
//endif
tmpVolSum70=vpocvol
i=0
while i<NbrBars do
tmpValHNBar=VPocNBar+(i+1)
tmpValLNBar=VPocNBar-(i+1)
tmpPriceValH=0
tmpVolH=0
tmpPriceValL=0
tmpVolL=0
if tmpValHNBar>NbrBars-1 and tmpValLNbar<0 or tmpVolSum70>VolSum70 then
break
endif
if tmpValHNBar=0 then
tmpPriceValH=PriceBar0
tmpVolH=Volbar0
endif
if tmpValHNBar=1 then
tmpPriceValH=PriceBar1
tmpVolH=Volbar1
endif
if tmpValHNBar=2 then
tmpPriceValH=PriceBar2
tmpVolH=Volbar2
endif
if tmpValHNBar=3 then
tmpPriceValH=PriceBar3
tmpVolH=Volbar3
endif
if tmpValHNBar=4 then
tmpPriceValH=PriceBar4
tmpVolH=Volbar4
endif
if tmpValHNBar=5 then
tmpPriceValH=PriceBar5
tmpVolH=Volbar5
endif
if tmpValHNBar=6 then
tmpPriceValH=PriceBar6
tmpVolH=Volbar6
endif
if tmpValHNBar=7 then
tmpPriceValH=PriceBar7
tmpVolH=Volbar7
endif
if tmpValHNBar=8 then
tmpPriceValH=PriceBar8
tmpVolH=Volbar8
endif
if tmpValHNBar=9 then
tmpPriceValH=PriceBar9
tmpVolH=Volbar9
endif
if tmpValHNBar=10 then
tmpPriceValH=PriceBar10
tmpVolH=Volbar10
endif
if tmpValLNBar=0 then
tmpPriceValL=PriceBar0
tmpVolL=Volbar0
endif
if tmpValLNBar=1 then
tmpPriceValL=PriceBar1
tmpVolL=Volbar1
endif
if tmpValLNBar=2 then
tmpPriceValL=PriceBar2
tmpVolL=Volbar2
endif
if tmpValLNBar=3 then
tmpPriceValL=PriceBar3
tmpVolL=Volbar3
endif
if tmpValLNBar=4 then
tmpPriceValL=PriceBar4
tmpVolL=Volbar4
endif
if tmpValLNBar=5 then
tmpPriceValL=PriceBar5
tmpVolL=Volbar5
endif
if tmpValLNBar=6 then
tmpPriceValL=PriceBar6
tmpVolL=Volbar6
endif
if tmpValLNBar=7 then
tmpPriceValL=PriceBar7
tmpVolL=Volbar7
endif
if tmpValLNBar=8 then
tmpPriceValL=PriceBar8
tmpVolL=Volbar8
endif
if tmpValLNBar=9 then
tmpPriceValL=PriceBar9
tmpVolL=Volbar9
endif
if tmpValLNBar=10 then
tmpPriceValL=PriceBar10
tmpVolL=Volbar10
endif
if tmpValHNBar>NbrBars-1 then
tmpPriceValH=0
tmpVolH=0
endif
if tmpValLNBar<0 then
tmpPriceValL=0
tmpVolL=0
endif
//ValL=tmpPriceValL
if tmpVolH>0 or tmpVolL>0 then
if tmpVolH>tmpVolL then
//if tmpVolSum70<VolSum70 then
ValH=tmpPriceValH
tmpVolSum70=tmpVolSum70+tmpVolH
//endif
else
//if tmpVolSum70<VolSum70 then
//if tmpPriceValL>0 then
//ValL=3006
tmpVolSum70=tmpVolSum70+tmpVolL
//endif
//endif
ValL=tmpPriceValL
endif
endif
i=i+1
wend
DRAWSEGMENT(LastStartBarIndex-2, ValH,barindex , ValH) Coloured(255,215,0)
DRAWSEGMENT(LastStartBarIndex-2, ValL,barindex , ValL) Coloured(0,139,139)
DRAWTEXT("VAH #ValH# ", barindex, ValH+(2*pipsize)) Coloured(255,215,0)
DRAWTEXT("VAL #ValL# ", barindex, ValL+(2*pipsize)) Coloured(0,139,139)
If PrezzoApertura>LastPrezzoHigh and Close>LastPrezzoHigh or PrezzoApertura<LastPrezzoLow and Close<LastPrezzoHigh then
DRAWTEXT(" Reduced Size Day", LastStartBarIndex, highest[StopLookback](High)+(5*pipsize), Dialog, Standard, 18) COLOURED(0,255,10)
endif
if LastBarOnChart then
//DRAWLINE(LastStartBarIndex, LastPrezzoChiusura, barindex, LastPrezzoChiusura) Coloured(255,0,0)
else
DRAWSEGMENT(LastStartBarIndex-4, LastPrezzoChiusura,barindex , LastPrezzoChiusura) Coloured(255,0,0)
DRAWVLINE(Barindex[Conteggio]) Coloured(255,0,0)
ColoreSfondo=1
LastStopBarIndex=barindex
SelEnd=1
SelStart=0
endif
//DisegnaLariga
endif //Fine arra chiusura eo corrente
if ColoreSfondo=1 then
BACKGROUNDCOLOR(255,0,0,5)
endif
dataTemp=date[Conteggio]
//text color
// white = 255,255,255 ; black = 0,0,0
r = 255
g = 0
b = 255
atr = averagetruerange[10](close)*0.5
StatoPattern=0
DojiSize = 0.05
data=(abs(open - close) <= (high - low) * DojiSize)
if Doppio=1 or Doppio[1]=1 then
if data then
//DRAWTEXT("Doji", barindex, high+atr, Dialog, Standard, 12) COLOURED(R,G,B)
endif
data2=(close[2] > open[2] and min(open[1], close[1]) > close[2] and open < min(open[1], close[1]) and close < open )
if data2 then
DRAWTEXT("Evening Star", barindex, high[1]+atr*1.5, Dialog, Standard, 12) COLOURED(255,0,10)
DRAWARROWDOWN(barindex-1,high[1]) COLOURED(255,0,10)
endif
data3=(close[2] < open[2] and max(open[1], close[1]) < close[2] and open > max(open[1], close[1]) and close > open )
if data3 then
DRAWTEXT("Morning Star", barindex, low[1]-atr*1.5, Dialog, Standard, 12) COLOURED(0,255,10)
DRAWARROWUP(barindex-1,low[1]) COLOURED(0,255,10)
endif
data4=(open[1] < close[1] and open > close[1] and high - max(open, close) >= abs(open - close) * 3 and min(close, open) - low <= abs(open - close))
if data4 then
DRAWTEXT("Shooting Star", barindex, high+atr*1.5, Dialog, Standard, 12) COLOURED(255,0,10)
DRAWARROWDOWN(barindex,high) COLOURED(255,0,10)
endif
data5=(((high - low)>3*(open -close)) and ((close - low)/(.001 + high - low) > 0.6) and ((open - low)/(.001 + high - low) > 0.6))
if data5 then
//DRAWTEXT("Hammer", barindex, high+atr, Dialog, Standard, 12) COLOURED(R,G,B)
endif
data5b=(((high - low)>3*(open -close)) and ((high - close)/(.001 + high - low) > 0.6) and ((high - open)/(.001 + high - low) > 0.6))
if data5b then
//DRAWTEXT("Inverted Hammer", barindex, high+atr, Dialog, Standard, 12) COLOURED(R,G,B)
endif
data6=(close[1] > open[1] and open > close and open <= close[1] and open[1] <= close and open - close < close[1] - open[1] )
if data6 then
//DRAWTEXT("Bearish Harami", barindex, high+atr*1.5, Dialog, Standard, 12) COLOURED(255,0,10)
//DRAWARROWDOWN(barindex,high) COLOURED(255,0,10)
endif
data7=(open[1] > close[1] and close > open and close <= open[1] and close[1] <= open and close - open < open[1] - close[1] )
if data7 then
//DRAWTEXT("Bullish Harami", barindex, low-atr*1.5, Dialog, Standard, 12) COLOURED(0,255,10)
//DRAWARROWUP(barindex,low) COLOURED(0,255,10)
endif
data8=(close[1] > open[1] and open > close and open >= close[1] and open[1] >= close and open - close > close[1] - open[1] )
if data8 then
if Doppio=1 or Doppio[1]=1 then
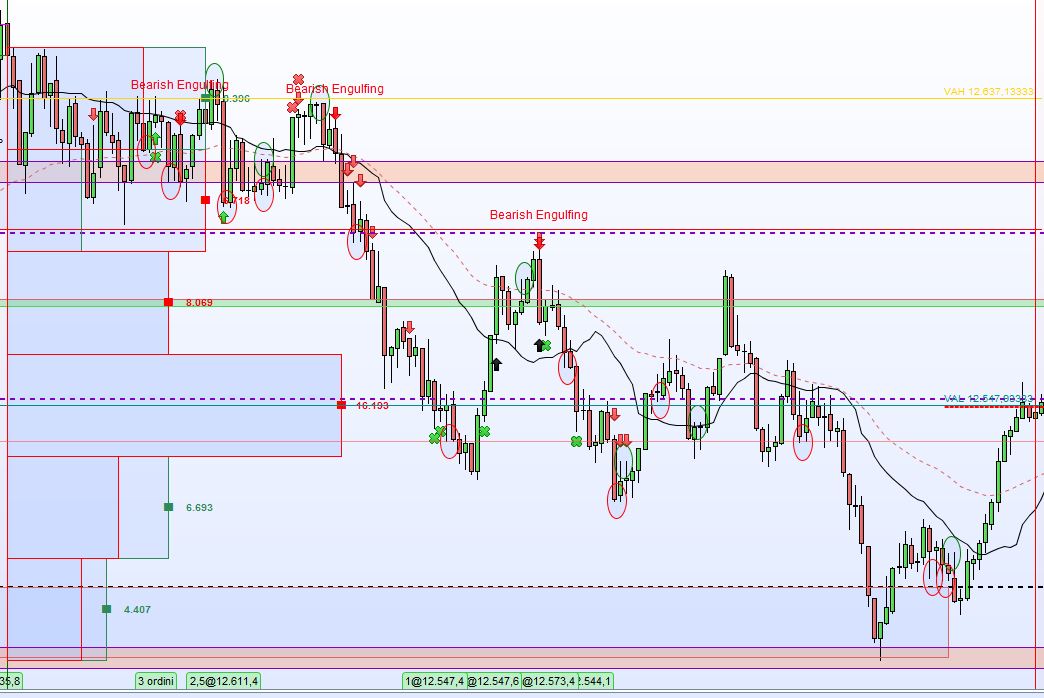
DRAWTEXT("Bearish Engulfing", barindex, high+atr*1.5, Dialog, Standard, 12) COLOURED(255,0,10)
DRAWARROWDOWN(barindex,high) COLOURED(255,0,10)
StatoPattern=-1
endif
endif
data9=(open[1] > close[1] and close > open and close >= open[1] and close[1] >= open and close - open > open[1] - close[1] )
if data9 then
if Doppio=1 or Doppio[1]=1 then
DRAWTEXT("Bullish Engulfing", barindex, low-atr*1.5, Dialog, Standard, 12) COLOURED(0,255,10)
DRAWARROWUP(barindex,low) COLOURED(0,255,10)
StatoPattern=1
endif
endif
data10=(close[1] < open[1] and open < low[1] and close > close[1] + ((open[1] - close[1])/2) and close < open[1])
if data10 then
DRAWTEXT("Piercing Line", barindex, low-atr*1.5, Dialog, Standard, 12) COLOURED(0,255,10)
DRAWARROWUP(barindex,low) COLOURED(0,255,10)
StatoPattern=1
endif
data14=(((high-low>4*(open-close))and((close-low)/(.001+high-low)>=0.75)and((open-low)/(.001+high-low)>=0.75)) and high[1] < open and high[2] < open)
if data14 then
DRAWTEXT("Hanging Man", barindex, high+atr*1.5, Dialog, Standard, 12) COLOURED(255,0,10)
DRAWARROWDOWN(barindex,high) COLOURED(255,0,10)
StatoPattern=-1
endif
data15=((close[1]>open[1])and(((close[1]+open[1])/2)>close)and(open>close)and(open>close[1])and(close>open[1])and((open-close)/(.001+(high-low))>0.6))
if data15 then
DRAWTEXT("Dark Cloud Cover", barindex, high+atr*1.5, Dialog, Standard, 12) COLOURED(255,0,10)
DRAWARROWDOWN(barindex,high) COLOURED(255,0,10)
StatoPattern=-1
endif
endif
//wend
return StatoPattern as "StatoPattern" //tmpValLNbar coloured(139,0,139) as "volbar1"