**VenturerVolHour v1.0**
Ciao ho creato questo nuovo indicatore per visualizzare la distribuzione dei volumi su base oraria.
Deve essere utilizzato su timeframe bassi (x)ticks, 1 minuto, 5 minuti
Per la configurazione ci sono 4 parametri:
SelStart= Orario inizio sessione (es 9)
SelStop=Orario fine sessione (es 22)
BarColor=1,2,3 tre tipologie di colori
BarOpacity=0/100
Spero possa essere utile, accetto volentieri suggerimenti.
//VenturerVolHour v1.0


HourStart=SesStart //15
HourStop=SesStop //23


once SelEnd=0
once SelStart=0
once SesStart=0
once ConteggioVol=0

if BarColor<2 or BarColor>3 then
gr=0
gg=255
gb=0

rr=255
rg=0
rb=0
endif

if BarColor=2 then
gr=0
gg=100
gb=200

rr=150
rg=0
rb=255
endif

if BarColor=3 then
gr=0
gg=100
gb=200

rr=0
rg=100
rb=200
endif

OraBarra=openhour[0]

if OraBarra=HourStart and SelStart=0 then //Inizio sessione
SelStart=1
SelEnd=0
SesStart=1
ConteggioVol=1
endif

if OraBarra=HourStop and SelEnd=0  then
SelStart=0
SelEnd=1
endif


volp=volume

if SelStart=1 and SesStart=1 then

startbar=barindex
hh=high
ll=low
SesStart=0

PrevHour=openhour[0]
endif

if openhour[0]<>PrevHour and SelStart=1 then
startbar=barindex
hh=high
ll=low
ConteggioVol=1
PrevHour=openhour[0]
endif

if high>hh then
hh = high
endif

if low<ll or ll=0 then
ll = low
endif

div = (hh-ll)/20
i=0

if SelStart=1 then
ConteggioVol=ConteggioVol+1
if ConteggioVol>300 then
ConteggioVol=300
endif
volsum=summation[ConteggioVol](volp)
while i<20 do
lrange=ll+div*i
hrange=lrange+div
volbull=0
for j = 1 to ConteggioVol do
if close[j]>=lrange and close[j]<=hrange then
if close[j]>open[j] then
volbull=volbull+volp[j]
r=gr
g=gg
b=gb
else
volbull=volbull+volp[j]
r=rr
g=rg
b=rb
endif
endif
next

bullbar = round((volbull*ConteggioVol)/volsum)*2

drawrectangle(startbar,(hrange+lrange)/2,startbar+bullbar,(hrange+lrange)/2) coloured(r,g,b,BarOpacity)

i=i+1
wend
endif

return
**VenturerVolHour v1.1**
Piccolo aggiornamento ho aggiunto 2 parametri per settare il numero di barre, e la lunghezza
//VenturerVolHour v1.1


HourStart=SesStart //15
HourStop=SesStop //23


once SelEnd=0
once SelStart=0
once SesStart=0
once ConteggioVol=0

if BarColor<2 or BarColor>3 then
gr=0
gg=255
gb=0

rr=255
rg=0
rb=0
endif

if BarColor=2 then
gr=0
gg=100
gb=200

rr=150
rg=0
rb=255
endif

if BarColor=3 then
gr=0
gg=100
gb=200

rr=0
rg=100
rb=200
endif

OraBarra=openhour[0]

if OraBarra=HourStart and SelStart=0 then //Inizio sessione
SelStart=1
SelEnd=0
SesStart=1
ConteggioVol=1
endif

if OraBarra=HourStop and SelEnd=0  then
SelStart=0
SelEnd=1
endif


volp=volume

if SelStart=1 and SesStart=1 then

startbar=barindex
hh=high
ll=low
SesStart=0

PrevHour=openhour[0]
endif

if openhour[0]<>PrevHour and SelStart=1 then
startbar=barindex
hh=high
ll=low
ConteggioVol=1
PrevHour=openhour[0]
endif

if high>hh then
hh = high
endif

if low<ll or ll=0 then
ll = low
endif

div = (hh-ll)/BarNumbers
i=0

if SelStart=1 then
ConteggioVol=ConteggioVol+1
if ConteggioVol>300 then
ConteggioVol=300
endif
volsum=summation[ConteggioVol](volp)
while i<BarNumbers do
lrange=ll+div*i
hrange=lrange+div
volbull=0
for j = 1 to ConteggioVol do
if close[j]>=lrange and close[j]<=hrange then
if close[j]>open[j] then
volbull=volbull+volp[j]
r=gr
g=gg
b=gb
else
volbull=volbull+volp[j]
r=rr
g=rg
b=rb
endif
endif
next

bullbar = round((volbull*ConteggioVol)/volsum)*BarLength

drawrectangle(startbar,(hrange+lrange)/2,startbar+bullbar,(hrange+lrange)/2) coloured(r,g,b,BarOpacity)

i=i+1
wend
endif

return
**VenturerVolHour v1.2**
Altro aggiornamento ho aggiunto l’opzione HalfTime per visualizzare il grafico ogni mezz’ora
//VenturerVolHour v1.2


HourStart=SesStart //15
HourStop=SesStop //23


once SelEnd=0
once SelStart=0
once SesStart=0
once ConteggioVol=0

if BarColor<2 or BarColor>3 then
gr=0
gg=255
gb=0

rr=255
rg=0
rb=0
endif

if BarColor=2 then
gr=0
gg=100
gb=200

rr=150
rg=0
rb=255
endif

if BarColor=3 then
gr=0
gg=100
gb=200

rr=0
rg=100
rb=200
endif

OraBarra=openhour[0]

if OraBarra=HourStart and SelStart=0 then //Inizio sessione
SelStart=1
SelEnd=0
SesStart=1
ConteggioVol=1
endif

if OraBarra=HourStop and SelEnd=0  then
SelStart=0
SelEnd=1
endif


volp=volume

if SelStart=1 and SesStart=1  then

startbar=barindex
hh=high
ll=low
SesStart=0

PrevHour=openhour[0]
PrevMinute=0
endif

if openhour[0]<>PrevHour and SelStart=1 then
startbar=barindex
hh=high
ll=low
ConteggioVol=1
PrevHour=openhour[0]
PrevMinute=1
endif

if openminute[0]>=30 and SelStart=1 and PrevMinute=1 and HalfTime=1 then
startbar=barindex
hh=high
ll=low
ConteggioVol=1
PrevMinute=0
endif

if high>hh then
hh = high
endif

if low<ll or ll=0 then
ll = low
endif

div = (hh-ll)/BarNumbers
i=0

if SelStart=1 then
ConteggioVol=ConteggioVol+1
if ConteggioVol>300 then
ConteggioVol=300
endif
volsum=summation[ConteggioVol](volp)
while i<BarNumbers do
lrange=ll+div*i
hrange=lrange+div
volbull=0
for j = 1 to ConteggioVol do
if close[j]>=lrange and close[j]<=hrange then
if close[j]>open[j] then
volbull=volbull+volp[j]
r=gr
g=gg
b=gb
else
volbull=volbull+volp[j]
r=rr
g=rg
b=rb
endif
endif
next

bullbar = round((volbull*ConteggioVol)/volsum)*BarLength

drawrectangle(startbar,(hrange+lrange)/2,startbar+bullbar,(hrange+lrange)/2) coloured(r,g,b,BarOpacity)

i=i+1
wend
endif

return
Grazie mille per il tuo tempo e impegno e per aver condiviso questo simpatico indicatore!
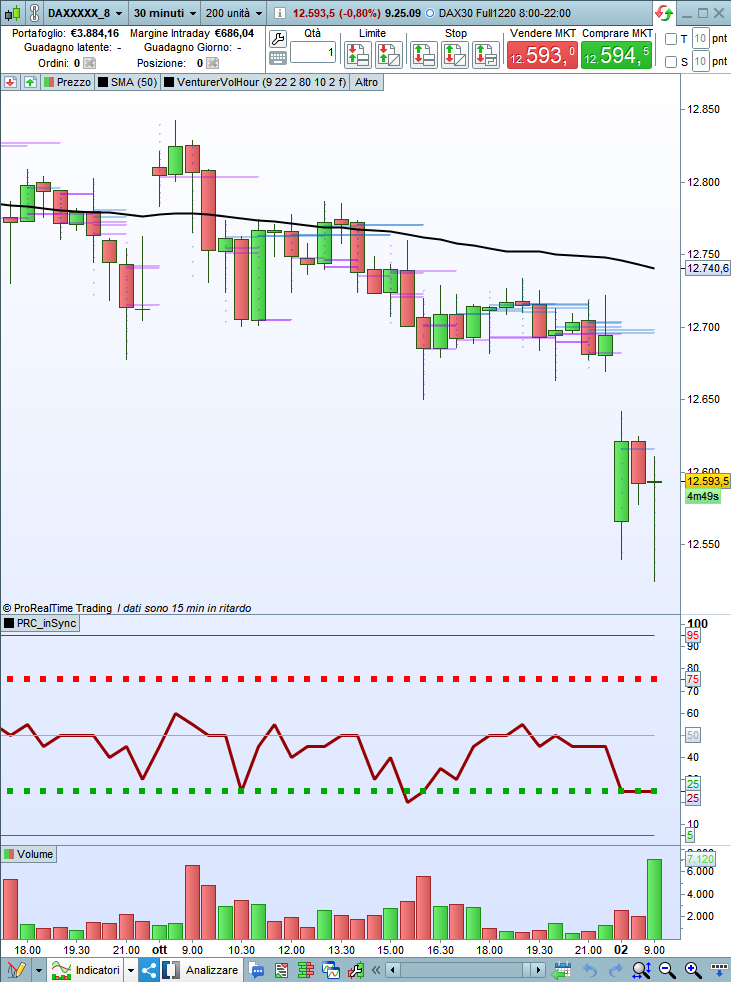
Mi potresti spiegare più dettagliatamente quando l’indicatore disegna le linee violetto e celeste? Allego foto del Dax dell 9.30, grazie
Ciao le linee (nel tuo caso viola e celesti, ma se scegli l ‘opzione 1 sono verdi e rosse) vengono incrementate in base ai volumi scambiati su quel livello di prezzo. Partendo dall’inizio dell ora si incrementano, poi si resetta il calcolo nell’ora successiva ( o mezz’ora in base all’opzione selezionata)
il tf che hai selezionato è troppo alto , per avere una lettura migliore ti consiglio sotto i 5 minuti.
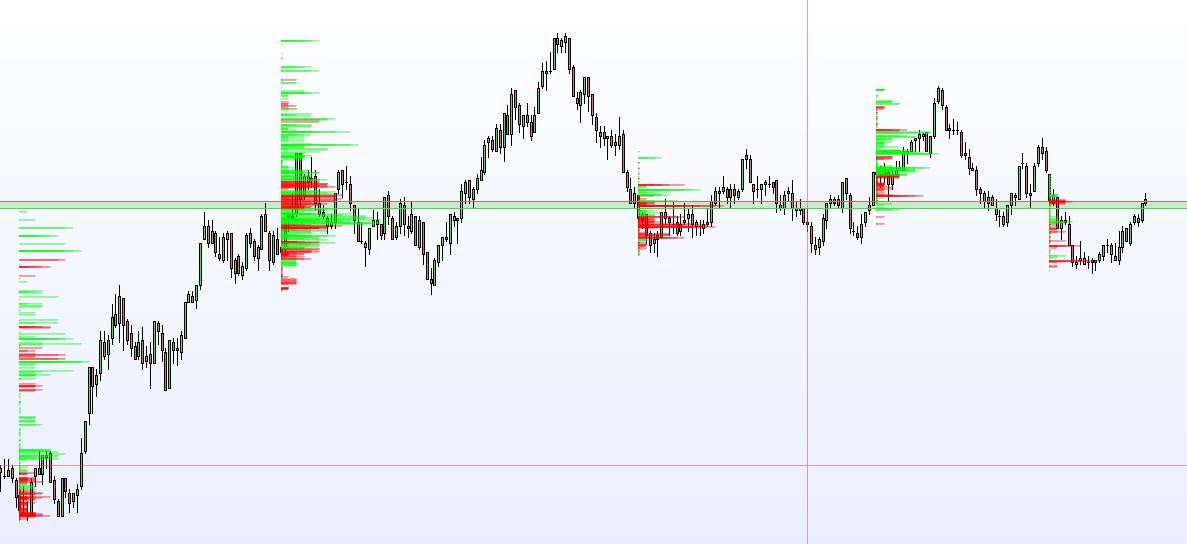
Con questo indicatore si notano bene i cambiamenti senza volume, e molto spesso i punti di interesse di prezzo che vengono ritestati.
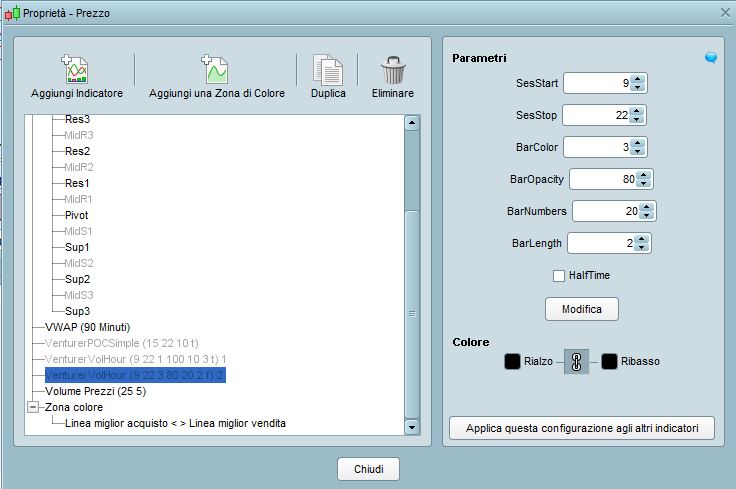
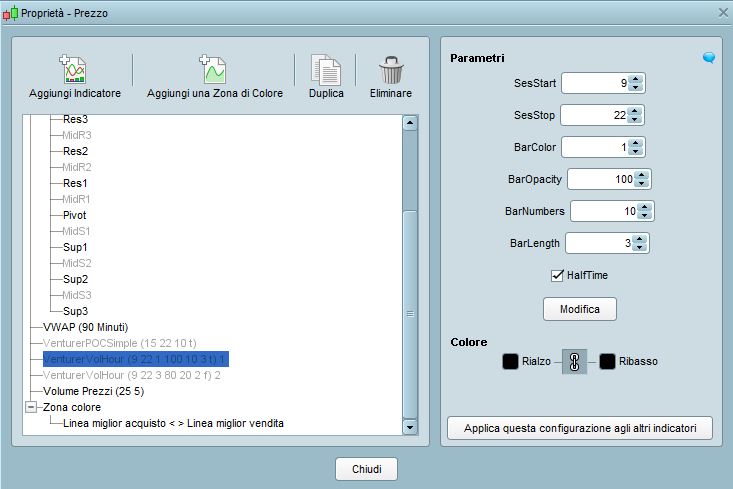
Io ne ho messo 2 uno soltanto orario con opzione colore 3 (solo blu) e 20 barre, e uno con opzione colore 1, con 10 barre a mezz’ora.
Insieme a questo utilizzo l’altro indicatore che avevo pubblicato (VenturerPOCSimple) per la visualizzazione del POC
Non ho idea ancora di come utilizzarlo, ma sto notando delle informazioni che possono essere interessanti, ma è ancora in valutazione.
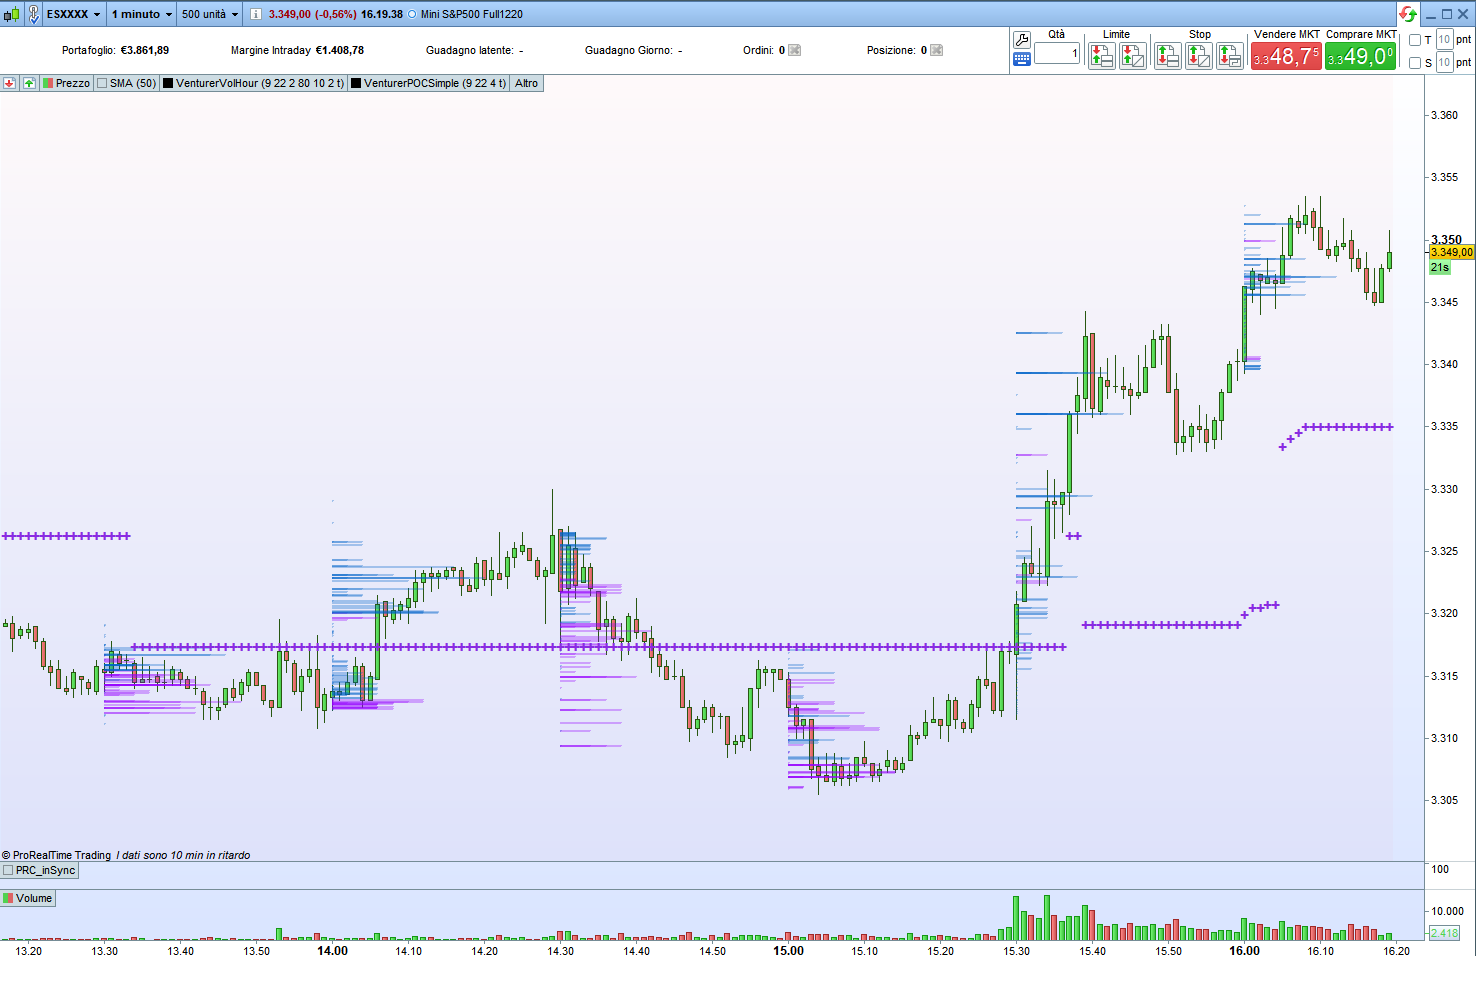
Ad esempio nell’ s&p di oggi (vedi immagine allegata) vedo 2 punti a 3.353 e 3.362 che mi interessa tenere sotto controllo, voglio vedere se torna li (sul dax dovrebbe corrispondere a 12.672)
Altre cose che ho notato, che i buchi di volume vengono recuperati velocemente, e che quando le linee cominciano a dilatarsi si inverte i trend
Io, di solito, utilizzo time frame più alti per il mio stile di trading. Grazie per la spiegazione che mi servirà per studiare i due indicatori da te gentilmente condivisi, nei modi e tempi che hai consigliato.
Figurati è un piacere, anche io utilizzo tf più alti, ma per la programmazione prt non si riesce a leggere il volume in dettaglio su tf alti.
Hai notato come ha reagito il dax al prezzo che avevo indicato?
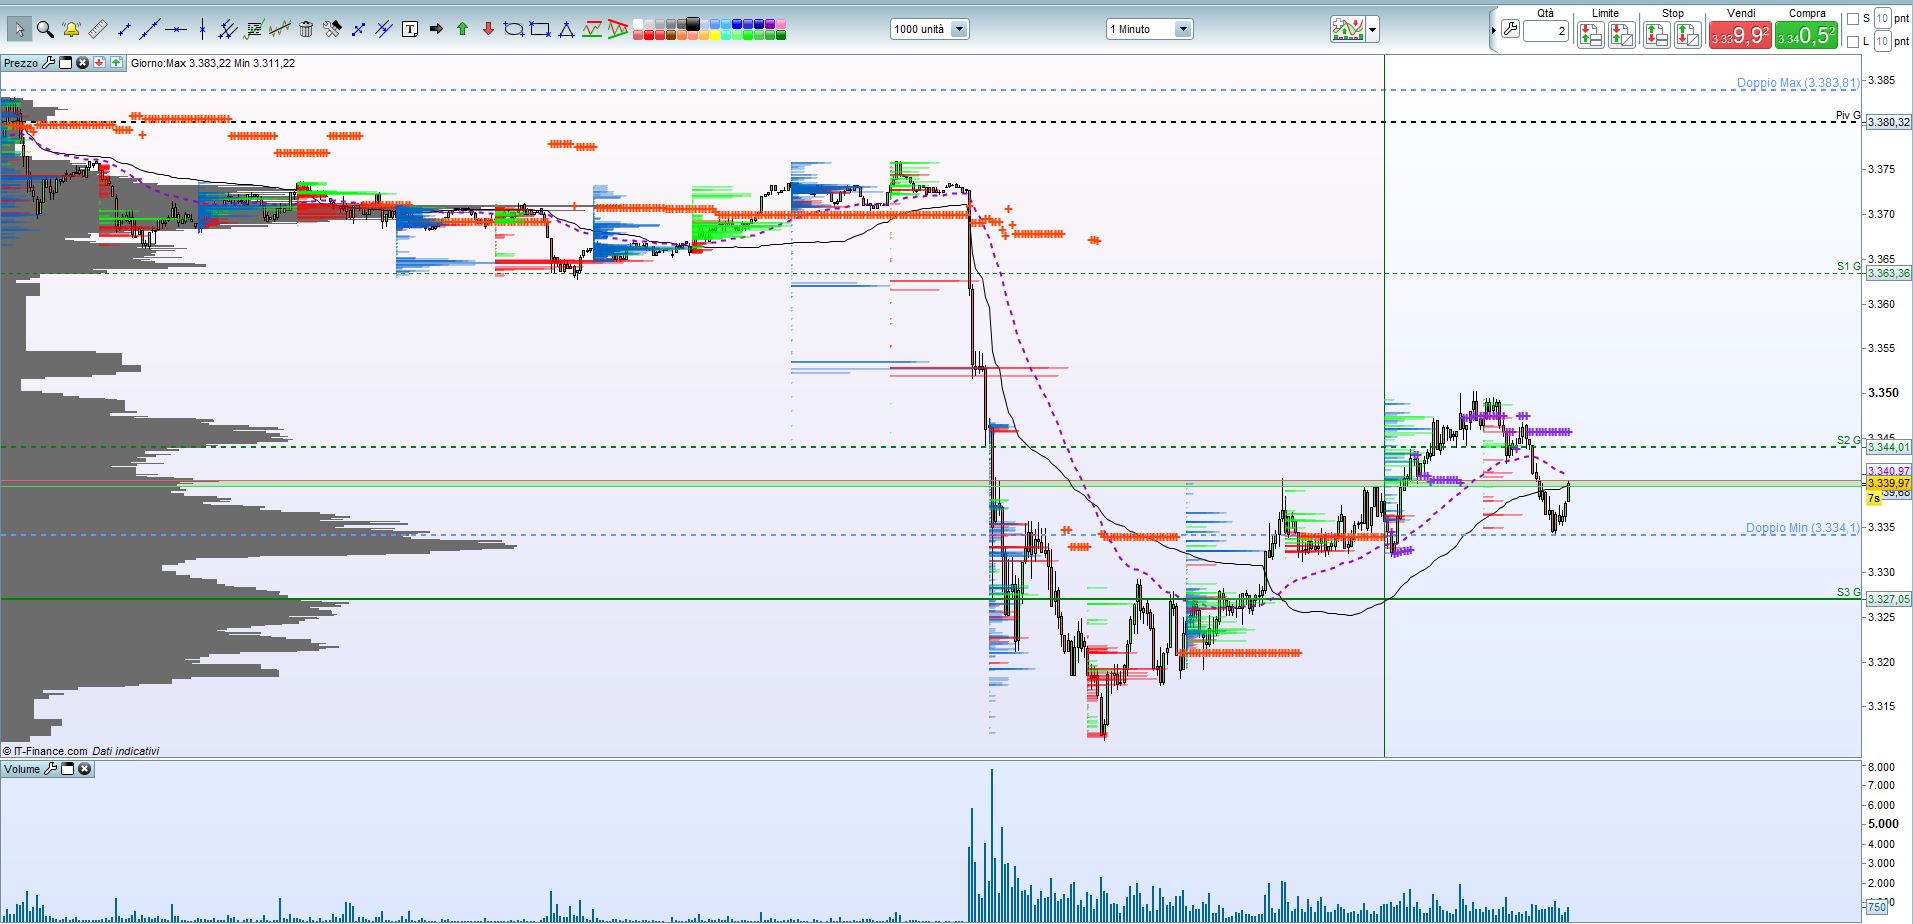
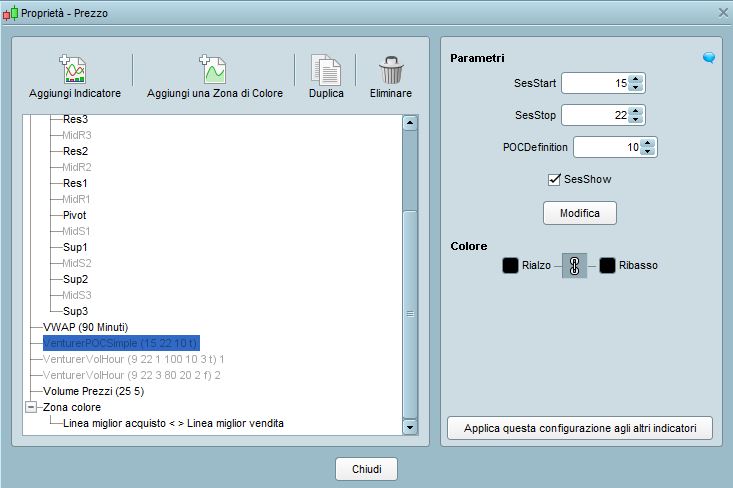
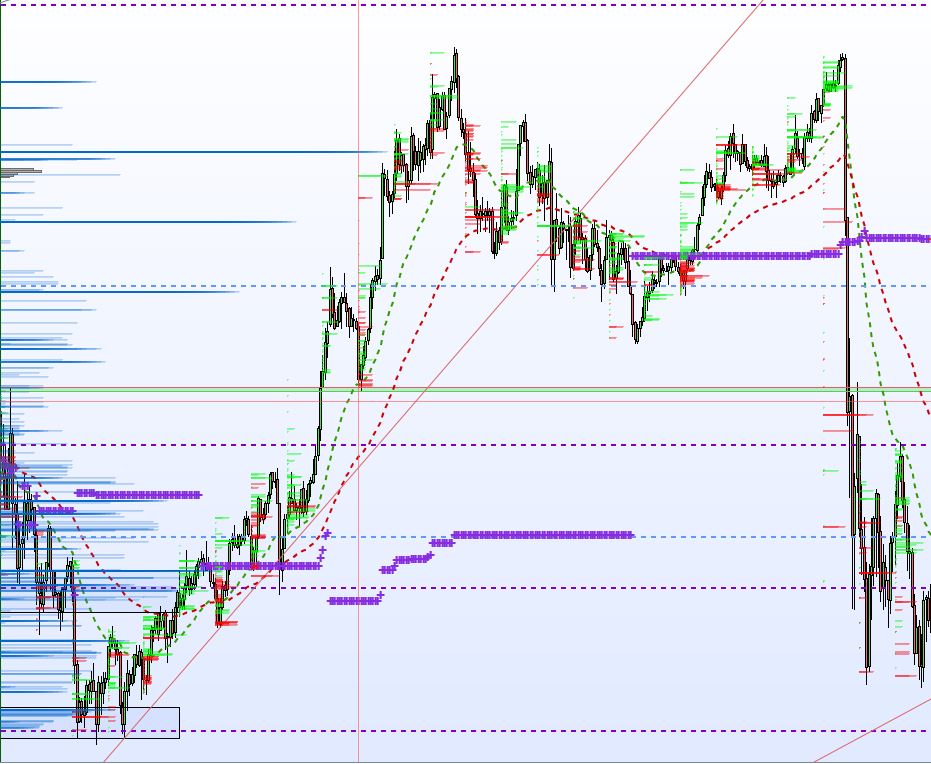
Ciao, scusa ancora se chiedo lumi! Allego la foto di quello che sono riuscito a mettere insieme dei 2 indicatori (ho dubbi sui settaggi, quindi se riesci a indicarmi quelli di default e quelli che usi tu faccio dei confronti). Inoltre sugli indici europei non si riesce ad avere l’indicatore orario a video. Grazie comunque e complimenti per il tuo lavoro
Ciao mi fa piacere che lo stai testando magari esce fuori qualche idea interessante.
Ti allego 3 immagini
in una c’è la configurazione del poc per sesisone s&p (15/22), nel caso del dax utilizzo 9/18 con la visualizzazione delle fasce per identificare eth/rth (sfondo bianco e sfondo rosa)
Per il numero di barre del POC sono indeciso tra 10 e 4
nelle altre 2 ci sono le 2 configurazioni che utilizzo contemporaneamente su questo nuovo indicatore (quella ad un’ora, e quella separata per le mezz’ore)
Invece per il problema degli indici europei faccio un test, non sono riuscito a replicare l’errore, potresti scrivere il nome dell indice (ho cercato esxxxx ma non ho trovato)
Anche s&p a 3.363 ha reagito…mi piace interessante!!
**VenturerVolHour v1.3**
Altro aggiornamento, ho tolto la configurazione della sessione, non penso sia utile, cosi il calcolo viene eseguito ogni ora ( o mezz’ora sempre in base all’opzione selezionata)
//VenturerVolHour v1.3


once SelStart=0
once ConteggioVol=0
once PrevHour=openhour[0]

if BarColor<2 or BarColor>3 then
gr=0
gg=255
gb=0

rr=255
rg=0
rb=0
endif

if BarColor=2 then
gr=0
gg=100
gb=200

rr=150
rg=0
rb=255
endif

if BarColor=3 then
gr=0
gg=100
gb=200

rr=0
rg=100
rb=200
endif


volp=volume

if openhour[0]<>PrevHour  then
startbar=barindex
hh=high
ll=low
ConteggioVol=1
PrevHour=openhour[0]
PrevMinute=1
SelStart=1
endif

if openminute[0]>=30 and SelStart=1 and PrevMinute=1 and HalfTime=1 then
startbar=barindex
hh=high
ll=low
ConteggioVol=1
PrevMinute=0
endif

if high>hh then
hh = high
endif

if low<ll or ll=0 then
ll = low
endif

div = (hh-ll)/BarNumbers
i=0

if SelStart=1 then
ConteggioVol=ConteggioVol+1
if ConteggioVol>300 then
ConteggioVol=300
endif
volsum=summation[ConteggioVol](volp)
while i<BarNumbers do
lrange=ll+div*i
hrange=lrange+div
volbull=0
for j = 1 to ConteggioVol do
if close[j]>=lrange and close[j]<=hrange then
if close[j]>open[j] then
volbull=volbull+volp[j]
r=gr
g=gg
b=gb
else
volbull=volbull+volp[j]
r=rr
g=rg
b=rb
endif
endif
next

bullbar = round((volbull*ConteggioVol)/volsum)*BarLength

drawrectangle(startbar,(hrange+lrange)/2,startbar+bullbar,(hrange+lrange)/2) coloured(r,g,b,BarOpacity)

i=i+1
wend
endif

return
Grazie, lo provo e ti saprò dire. Oggi la giornata corre veloce e ho tempi stretti, a presto
** VenturerVolSes v1.0**
Dal precedente indicatore ho fatto anche questo soltanto per le sessioni , quindi calcola i volumi su eth ed rth configurabile.
Quindi con questo si ha una visione più d’insieme.
//VenturerVolSes v1


HourStart=SesStart //15
HourStop=SesStop //23


once SelEnd=0
once SelStart=0
//once SesStart=0
once ConteggioVol=0

if BarColor<2 or BarColor>3 then
gr=0
gg=255
gb=0

rr=255
rg=0
rb=0
endif

if BarColor=2 then
gr=0
gg=100
gb=200

rr=150
rg=0
rb=255
endif

if BarColor=3 then
gr=0
gg=100
gb=200

rr=0
rg=100
rb=200
endif

OraBarra=openhour[0]


if OraBarra=HourStart and SelStart=0 then //Inizio sessione
SelStart=1
SelEnd=0
//SesStart=1
ConteggioVol=1

startbar=barindex
hh=high
ll=low
endif

if OraBarra=HourStop and SelEnd=0  then
SelStart=0
SelEnd=1

ConteggioVol=1

startbar=barindex
hh=high
ll=low
endif


volp=volume


if high>hh then
hh = high
endif

if low<ll or ll=0 then
ll = low
endif

div = (hh-ll)/BarNumbers
i=0

if SelStart=1 or SelEnd=1 then
ConteggioVol=ConteggioVol+1
if ConteggioVol>300 then
ConteggioVol=300
endif
volsum=summation[ConteggioVol](volp)
while i<BarNumbers do
lrange=ll+div*i
hrange=lrange+div
volbull=0
for j = 1 to ConteggioVol do
if close[j]>=lrange and close[j]<=hrange then
if close[j]>open[j] then
volbull=volbull+volp[j]
r=gr
g=gg
b=gb
else
volbull=volbull+volp[j]
r=rr
g=rg
b=rb
endif
endif
next

bullbar = round((volbull*ConteggioVol)/volsum)*BarLength

drawrectangle(startbar,(hrange+lrange)/2,startbar+bullbar,(hrange+lrange)/2) coloured(r,g,b,BarOpacity)

i=i+1
wend
endif

return