Indicatore stagionalità

Viewing 6 posts - 16 through 21 (of 21 total)
  • Author
    Posts
  • #68538 quote
    abd78abd78
    Participant
    Veteran

    mmmh credo sia più una cosa così, ovviamente non so come programmarla variabili: barrefuture,history1,history2,history3,prezzo tf possibile: giornaliero,4h,1h barrefuture = 100 // possibilità di cambiare il valore history1 = 1 // possibilità di cambiare il valore history2 = 2 // possibilità di cambiare il valore history 3= 3 // possibilità di cambiare il valore if history1 = 0 then “non disegnare nulla” else if media degli ultimi x anni // mediamobile da aggiungere poi e applicarla alla history1 if history2 = 0 then “non disegnare nulla” else if media degli ultimi x anni // mediamobile da aggiungere poi e applicarla alla history2 if history3 = 0 then “non disegnare nulla” else if media degli ultimi x anni // mediamobile da aggiungere poi e applicarla alla history3 prezzo = linea con le chiusure del prezzo

    #69553 quote
    abd78abd78
    Participant
    Veteran

    novità nicolas?

    #71287 quote
    abd78abd78
    Participant
    Veteran

    qualcuno?

    #71861 quote
    abd78abd78
    Participant
    Veteran

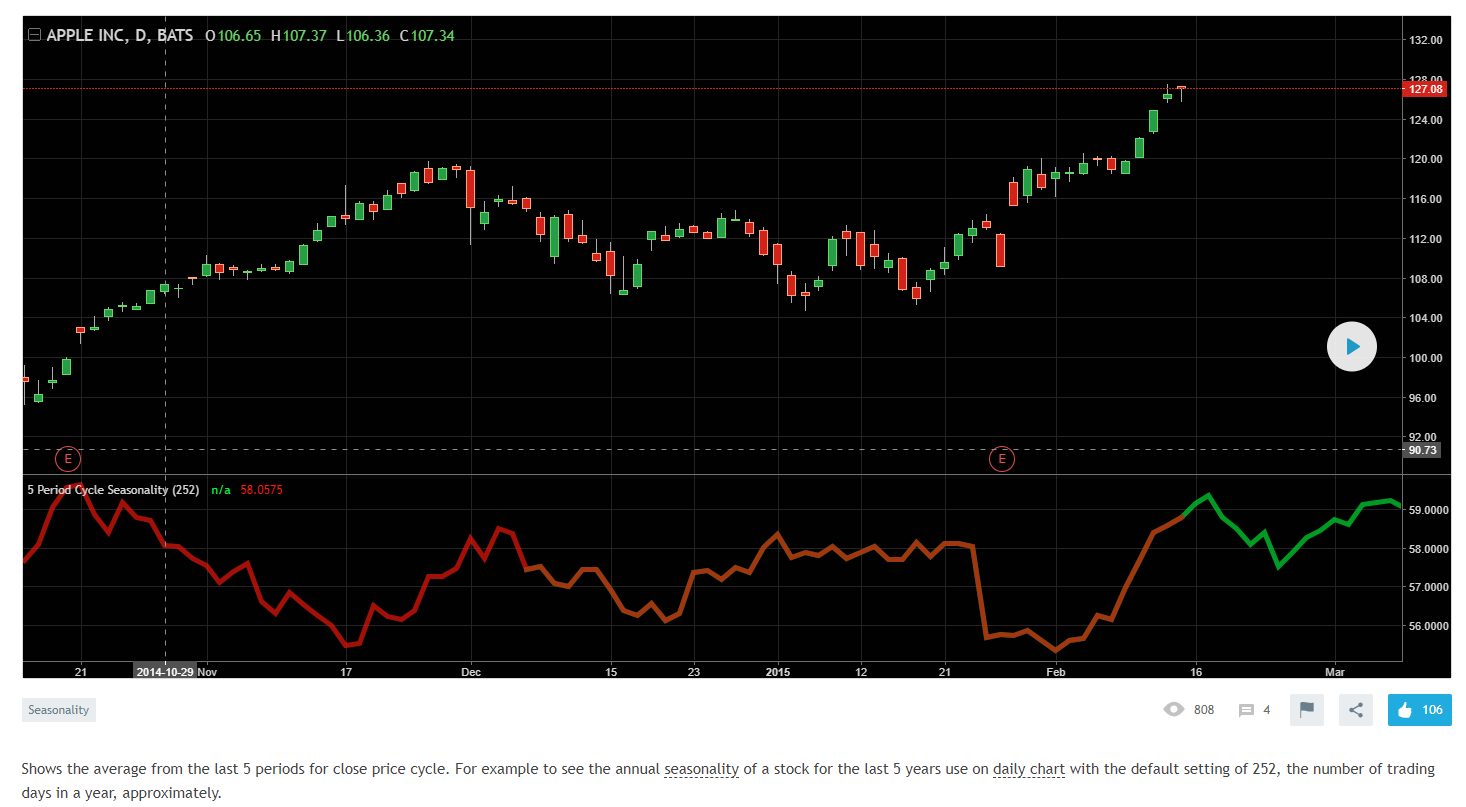
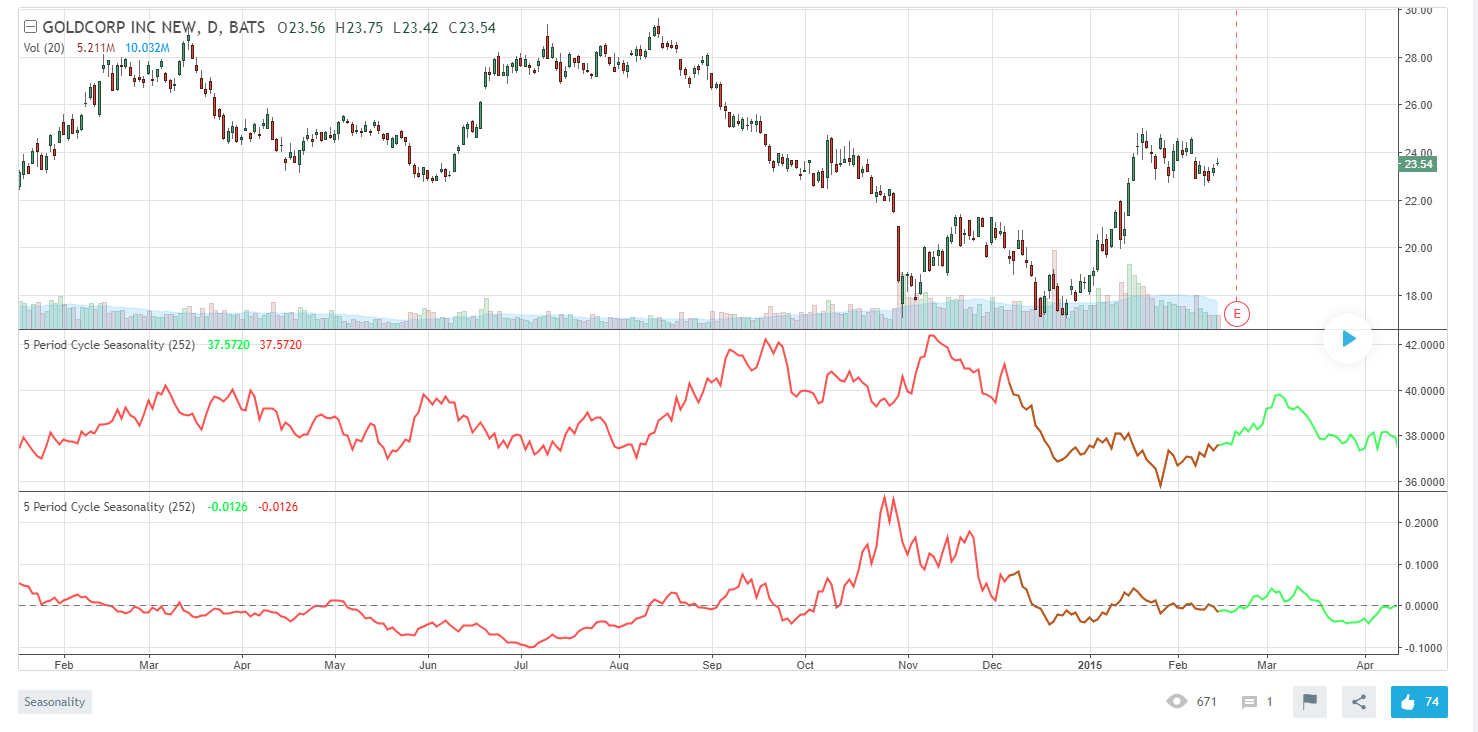
    ho trovato questo non so se è utile:

    study("5 Period Cycle Seasonality")
    
    Period = input(title="Period Cycle", type=integer , defval=252)
    
    LastYear = close[Period]
    TwoYearsAgo = close [2 * Period]
    ThreeYearsAgo = close [3 * Period]
    FourYearsAgo = close [4 *Period]
    FiveYearsAgo = close [5 * Period]
    
    Offset = Period
    LastYearE = close[Period - Offset]
    TwoYearsAgoE = close [2 * Period - Offset]
    ThreeYearsAgoE = close [3 * Period - Offset]
    FourYearsAgoE = close [4 *Period - Offset]
    FiveYearsAgoE = close [5 * Period - Offset]
    
    plot((LastYearE + TwoYearsAgoE + ThreeYearsAgoE + FourYearsAgoE + FiveYearsAgoE) / 5, color = #00ff00, linewidth = 5, offset =  Offset)
    
    plot((LastYear + TwoYearsAgo + ThreeYearsAgo + FourYearsAgo + FiveYearsAgo) / 5, color = #ff0000, linewidth = 5)
    study("5 Period Cycle Seasonality - %")
    
    Period = input(title="Period Cycle", type=integer , defval=252)
    
    LastYear = (close[Period]-close[2 * Period])/close[2 * Period]
    TwoYearsAgo = (close [2 * Period]-close[3 * Period])/close[3 * Period]
    ThreeYearsAgo = (close [3 * Period]-close[4 * Period])/close[4 * Period]
    FourYearsAgo = (close [4 *Period]-close[5 * Period])/close[5 * Period]
    FiveYearsAgo = (close [5 * Period]-close[6 * Period])/close[6 * Period]
    
    Offset = Period
    LastYearE = (close[Period - Offset]-close [2 * Period - Offset])/close [2 * Period - Offset]
    TwoYearsAgoE = (close [2 * Period - Offset]-close [3 * Period - Offset])/close [3 * Period - Offset]
    ThreeYearsAgoE = (close [3 * Period - Offset]-close [4 * Period - Offset])/close [4 * Period - Offset]
    FourYearsAgoE = (close [4 *Period - Offset]-close [5 * Period - Offset])/close [5 * Period - Offset]
    FiveYearsAgoE = (close [5 * Period - Offset]-close [6 * Period - Offset])/close [6 * Period - Offset]
    
    plot((LastYearE + TwoYearsAgoE + ThreeYearsAgoE + FourYearsAgoE + FiveYearsAgoE) / 5, color = #00ff00, linewidth = 2, offset =  Offset)
    plot((LastYear + TwoYearsAgo + ThreeYearsAgo + FourYearsAgo + FiveYearsAgo) / 5, color = #ff0000, linewidth = 2)
    hline(0)
    app.png app.png app2.png app2.png
    #71869 quote
    robertogozzirobertogozzi
    Moderator
    Legend

    Non è in linguaggio PRT, forse MT4?

    Nocolas potrebbe sapere se può tradurlo.

    #82248 quote
    NicolasNicolas
    Keymaster
    Legend

    Il codice sotto è la conversione dal codice di tradingview (versione in percentuale).

    Period = 252
    
    LastYear = (close[Period]-close[2 * Period])/close[2 * Period]
    TwoYearsAgo = (close [2 * Period]-close[3 * Period])/close[3 * Period]
    ThreeYearsAgo = (close [3 * Period]-close[4 * Period])/close[4 * Period]
    FourYearsAgo = (close [4 *Period]-close[5 * Period])/close[5 * Period]
    FiveYearsAgo = (close [5 * Period]-close[6 * Period])/close[6 * Period]
    
    result = (LastYear + TwoYearsAgo + ThreeYearsAgo + FourYearsAgo + FiveYearsAgo) / 5
    
    Offset = Period
    LastYearE = (close[Period - Offset]-close [2 * Period - Offset])/close [2 * Period - Offset]
    TwoYearsAgoE = (close [2 * Period - Offset]-close [3 * Period - Offset])/close [3 * Period - Offset]
    ThreeYearsAgoE = (close [3 * Period - Offset]-close [4 * Period - Offset])/close [4 * Period - Offset]
    FourYearsAgoE = (close [4 *Period - Offset]-close [5 * Period - Offset])/close [5 * Period - Offset]
    FiveYearsAgoE = (close [5 * Period - Offset]-close [6 * Period - Offset])/close [6 * Period - Offset]
    
    //drawvline(barindex[period])
    offsetresult = (LastYearE + TwoYearsAgoE + ThreeYearsAgoE + FourYearsAgoE + FiveYearsAgoE) / 5
    
    return result, offsetresult coloured(255,0,0)
Viewing 6 posts - 16 through 21 (of 21 total)
  • You must be logged in to reply to this topic.

ProRealAI ProRealAI New

Stuck on this ProBuilder code?

Describe what this topic is trying to build, in plain English, and ProRealAI writes the ProRealTime™ indicator, screener or system for you.

Available in 7 languages
Try ProRealAI

Indicatore stagionalità


ProBuilder: Indicatori & Strumenti Personalizzati

New Reply
Author
author-avatar
abd78 @fede9483 Participant
Summary

This topic contains 20 replies,
has 5 voices, and was last updated by NicolasNicolas

7 years, 11 months ago.

Topic Details
Forum: ProBuilder: Indicatori & Strumenti Personalizzati
Language: Italian
Started: 03/17/2018
Status: Active
Attachments: 18 files
ProRealCode ProRealCode
Loading...