Indicatore Livelli Volume

Viewing 5 posts - 1 through 5 (of 5 total)
  • Author
    Posts
  • #125213 quote
    GianlucaGianluca
    Participant
    Master

    Ciao vorrei creare un indicatore che riporti i livelli dove c’e’ stato maggior volume nell’ultima settimana, sarebbe possibile?

    #125217 quote
    robertogozzirobertogozzi
    Moderator
    Legend

    Come calcolare i levelli?

    Dove li vuoi vedere?

    #125297 quote
    GianlucaGianluca
    Participant
    Master

    per esempio, prendiamo il dax, vorrei che sul grafico uscissero i livelli di prezzo che abbiano avuto i livelli di volume + alti dell’ultima settimana o anche nella giornata sottoforma di rette orizzontali

    #125348 quote
    robertogozzirobertogozzi
    Moderator
    Legend

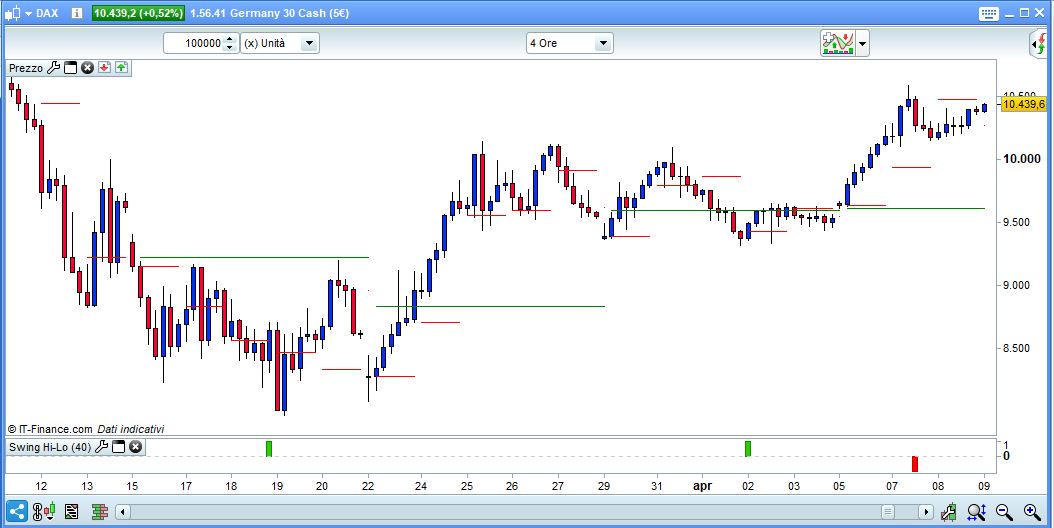
    Questa versione stampa i segmenti (Verde=settimana prec.,  Rosso=giorno prec.), come da foto X.jpg allegata (togliendo i commenti alla riga 1 stamperà solo le ultime due linee settimanale e giornaliera):

    //DEFPARAM DrawOnLastBarOnly = true
    ONCE MaxSettimana        = 0
    ONCE MaxGiorno           = 0
    ONCE PrezzoSettimana     = 0
    ONCE PrezzoSettimanaPrec = 0
    // Volumi settimanali
    IF OpenDayOfWeek = 1 AND (OpenDayOfWeek[1] <> OpenDayOfWeek) THEN
       PrezzoSettimanaPrec = PrezzoSettimana
       PrezzoSettimana     = close
       MaxSettimana        = Volume
       BarraSettimana      = BarIndex
    ENDIF
    MaxSettimana           = max(Volume,MaxSettimana)
    IF MaxSettimana <> MaxSettimana[1] THEN
       PrezzoSettimana     = close
    ENDIF
    // Volumi giornalieri
    IF IntraDayBarIndex = 0 THEN
       PrezzoGiornoPrec = PrezzoGiorno
       PrezzoGiorno     = close
       MaxGiorno        = Volume
       BarraGiorno      = BarIndex
    ENDIF
    MaxGiorno           = max(Volume,MaxGiorno)
    IF MaxGiorno <> MaxGiorno[1] THEN
       PrezzoGiorno     = close
    ENDIF
    //
    DRAWSEGMENT(BarraSettimana,PrezzoSettimanaPrec,BarIndex,PrezzoSettimanaPrec) coloured(0,128,0,255)
    DRAWSEGMENT(BarraGiorno ,PrezzoGiornoPrec ,BarIndex,PrezzoGiornoPrec) coloured(255,0,0,255)
    RETURN

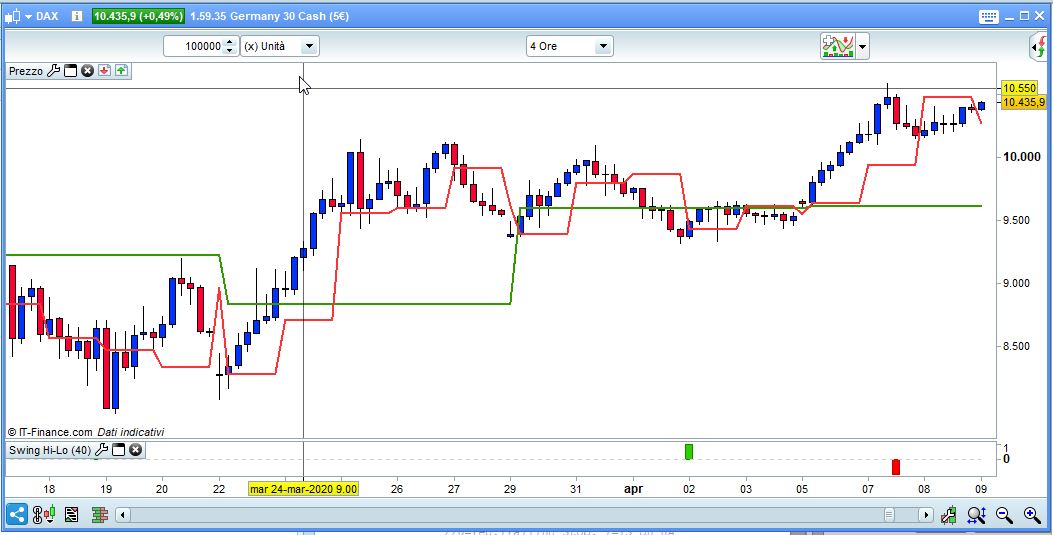
    Questa versione stampa linee continue a scalini (Verde=settimana prec.,  Rosso=giorno prec.), come da foto Y.jpg allegata:

    ONCE MaxSettimana        = 0
    ONCE MaxGiorno           = 0
    ONCE PrezzoSettimana     = 0
    ONCE PrezzoSettimanaPrec = 0
    // Volumi settimanali
    IF OpenDayOfWeek = 1 AND (OpenDayOfWeek[1] <> OpenDayOfWeek) THEN
       PrezzoSettimanaPrec = PrezzoSettimana
       PrezzoSettimana     = close
       MaxSettimana        = Volume
    ENDIF
    MaxSettimana = max(Volume,MaxSettimana)
    IF MaxSettimana <> MaxSettimana[1] THEN
        PrezzoSettimana    = close
    ENDIF
    // Volumi giornalieri
    IF IntraDayBarIndex = 0 THEN
    PrezzoGiornoPrec = PrezzoGiorno
    PrezzoGiorno     = close
    MaxGiorno        = Volume
    ENDIF
    MaxGiorno        = max(Volume,MaxGiorno)
    IF MaxGiorno <> MaxGiorno[1] THEN
       PrezzoGiorno  = close
    ENDIF
    //
    RETURN PrezzoSettimanaPrec coloured(0,128,0,255) AS "Prezzo Settimana precedente",PrezzoGiornoPrec coloured(255,0,0,255) AS "Prezzo Giorno precedente"
    x-8.jpg x-8.jpg y.jpg y.jpg
    #125440 quote
    GianlucaGianluca
    Participant
    Master

    GRAZIE MILLE penso possa essere molto utile

Viewing 5 posts - 1 through 5 (of 5 total)
  • You must be logged in to reply to this topic.

ProRealAI ProRealAI New

Stuck on this ProBuilder code?

Describe what this topic is trying to build, in plain English, and ProRealAI writes the ProRealTime™ indicator, screener or system for you.

Available in 7 languages
Try ProRealAI

Indicatore Livelli Volume


ProBuilder: Indicatori & Strumenti Personalizzati

New Reply
Author
author-avatar
Gianluca @altares Participant
Summary

This topic contains 4 replies,
has 2 voices, and was last updated by GianlucaGianluca

6 years, 6 months ago.

Topic Details
Forum: ProBuilder: Indicatori & Strumenti Personalizzati
Language: Italian
Started: 04/08/2020
Status: Active
Attachments: 2 files
ProRealCode ProRealCode
Loading...