Buongiorno,
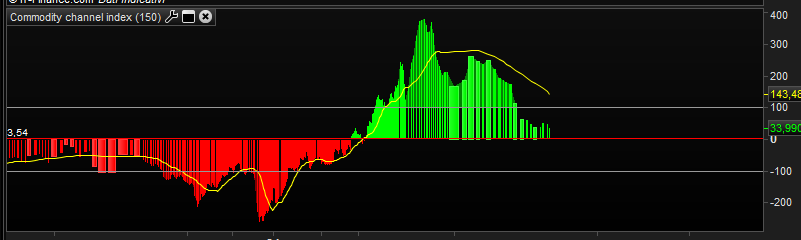
volevo realizzare un indicatore Commodity Channel Index a 150 periodi con media mobile semplice a 21 periodi come in foto in allegato, aggiungendo in indicatore ZIG ZAG che disegni i segmenti tenendo conto dei valori espressi dall’indicatore
negli ultimi 20 istogrammi. Naturalmente dovrà disegnare un segmento anche tra l’ultimo punto di svolta e l’ultimo istogramma .
Saluti
Grazie
Argomento spostato al forum italiano dal forum inglese. Si prega di provare a postare nel forum corretto.
Questo è il CCI modificato con l’aggiunta della media:
cciP = 150
maP  = 21
MyCCI = CCI[cciP](typicalPrice)
MyAvg = average[maP,maT](MyCCI)
RETURN MyCCI AS "Cci",100 AS "100",-100 AS "-100",MyAvg AS "MA"
dalle proprietà deciderai come visualizzare il CCI o la media, se con istogramma o linea e quali colori usare.
Non ho, invece, capito dove vuoi mettere lo ZigZag e su cosa lo vuoi calcolare.
Se possibile inserire un indicatore ZIG ZAG che con i valori del CCI tenga conto dei punti di inversione, ad esempio come il fractal ZIG ZAG sul prezzo presente nel forums oppure se impossibile inserirne uno che tenga conto dei prezzi.
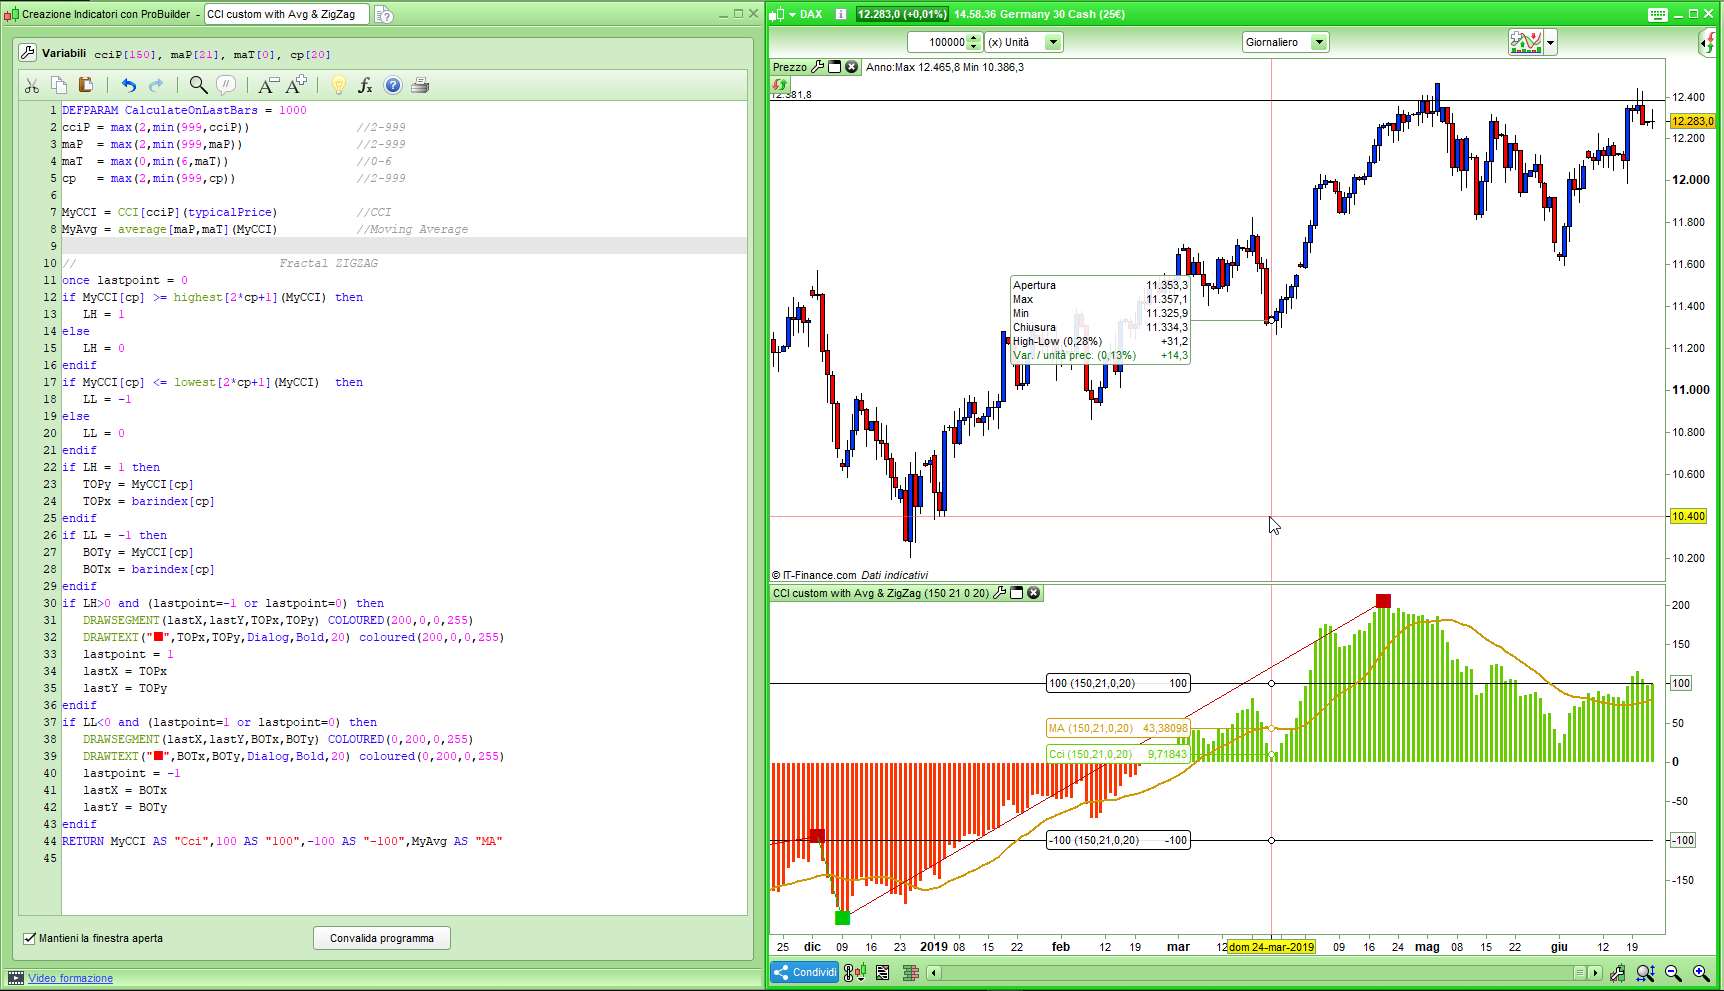
Ho preso pari pari il Fractal ZigZag e l’ho adattato al CCI, prova se ti va bene:
DEFPARAM CalculateOnLastBars = 1000
cciP = max(2,min(999,cciP))               //2-999
maP  = max(2,min(999,maP))                //2-999
maT  = max(0,min(6,maT))                  //0-6
cp   = max(2,min(999,cp))                 //2-999

MyCCI = CCI[cciP](typicalPrice)           //CCI
MyAvg = average[maP,maT](MyCCI)           //Moving Average

//                             Fractal ZIGZAG
once lastpoint = 0
if MyCCI[cp] >= highest[2*cp+1](MyCCI) then
   LH = 1
else
   LH = 0
endif
if MyCCI[cp] <= lowest[2*cp+1](MyCCI)  then
   LL = -1
else
   LL = 0
endif
if LH = 1 then
   TOPy = MyCCI[cp]
   TOPx = barindex[cp]
endif
if LL = -1 then
   BOTy = MyCCI[cp]
   BOTx = barindex[cp]
endif
if LH>0 and (lastpoint=-1 or lastpoint=0) then
   DRAWSEGMENT(lastX,lastY,TOPx,TOPy) COLOURED(200,0,0,255)
   DRAWTEXT("■",TOPx,TOPy,Dialog,Bold,20) coloured(200,0,0,255)
   lastpoint = 1
   lastX = TOPx
   lastY = TOPy
endif
if LL<0 and (lastpoint=1 or lastpoint=0) then
   DRAWSEGMENT(lastX,lastY,BOTx,BOTy) COLOURED(0,200,0,255)
   DRAWTEXT("■",BOTx,BOTy,Dialog,Bold,20) coloured(0,200,0,255)
   lastpoint = -1
   lastX = BOTx
   lastY = BOTy
endif
RETURN MyCCI AS "Cci",100 AS "100",-100 AS "-100",MyAvg AS "MA"
Perfetto unica cosa se puoi aggiungere anche l’ultimo segmento che unisce l’ultimo punto di inversione con l’ultimo istogramma (o prezzo) come mi era stato fatto per lo zig zag sul prezzo da Nicolas che ti metto in copia:
defparam drawonlastbaronly=true

//—external parameters

cp = 20

once lastpoint = 0

if high[cp] >= highest[2*cp+1](high) then
LH = 1
else
LH = 0
endif

if low[cp] <= lowest[2*cp+1](low) then
LL = -1
else
LL = 0
endif

if LH = 1 then
TOPy = high[cp]
TOPx = barindex[cp]
endif

if LL = -1 then
BOTy = low[cp]
BOTx = barindex[cp]
endif

if LH>0 and (lastpoint=-1 or lastpoint=0) then
DrawSegment(lastX,lastY,TOPx,TOPy) coloured(255,255,0)
lastpoint = 1
lastX = TOPx
lastY = TOPy
endif

if LL<0 and (lastpoint=1 or lastpoint=0) then
DrawSegment(lastX,lastY,BOTx,BOTy) coloured(255,255,0)
lastpoint = -1
lastX = BOTx
lastY = BOTy
endif

if lastpoint>0 then
DrawSegment(lastX,lastY,barindex,low) coloured(255,255,0)
elsif lastpoint<0 then
DrawSegment(lastX,lastY,barindex,high) coloured(255,255,0)
endif

return
Inoltre se possibile senza i quadrati rossi e verdi basta un segmento in giallo.
Grazie Roberto
Per scrivere il codice , utilizza il pulsante <> “insert PRT code”. GRAZIE.
Questo è quello modificato con il codice che mi hai detto tu, ma non mi sembra sia quello che desideri:
DEFPARAM CalculateOnLastBars = 1000
cciP = max(2,min(999,cciP))               //2-999
maP  = max(2,min(999,maP))                //2-999
maT  = max(0,min(6,maT))                  //0-6
cp   = max(2,min(999,cp))                 //2-999

MyCCI = CCI[cciP](typicalPrice)           //CCI
MyAvg = average[maP,maT](MyCCI)           //Moving Average

//                             Fractal ZIGZAG
once lastpoint = 0
if MyCCI[cp] >= highest[2*cp+1](MyCCI) then
LH = 1
else
LH = 0
endif
if MyCCI[cp] <= lowest[2*cp+1](MyCCI) then
LL = -1
else
LL = 0
endif
if LH = 1 then
TOPy = MyCCI[cp]
TOPx = barindex[cp]
endif
if LL = -1 then
BOTy = MyCCI[cp]
BOTx = barindex[cp]
endif
if LH>0 and (lastpoint=-1 or lastpoint=0) then
DrawSegment(lastX,lastY,TOPx,TOPy) coloured(255,255,0)
lastpoint = 1
lastX = TOPx
lastY = TOPy
endif
if LL<0 and (lastpoint=1 or lastpoint=0) then
DrawSegment(lastX,lastY,BOTx,BOTy) coloured(255,255,0)
lastpoint = -1
lastX = BOTx
lastY = BOTy
endif
if lastpoint>0 then
DrawSegment(lastX,lastY,barindex,MyCCI) coloured(255,255,0)
elsif lastpoint<0 then
DrawSegment(lastX,lastY,barindex,MyCCI) coloured(255,255,0)
endif
//
RETURN MyCCI AS "Cci",100 AS "100",-100 AS "-100",MyAvg AS "MA"
Ciao Roberto,
infatti non va bene il tuo primo codice andava bene dovevi solo aggiungere un segmento che dall’ultimo punto dello zig zag vada ad unire l’attuale prezzo nell’ultimo istogramma del CCI, (che si muova con l’indicatore per intenderci).
Saluti
Per ottenere il risultato che desideri devi usare due indicatori qusi identici:
Primo: quello del mio primo post, commentando le linee 32 e 39, quello che non stampa l’ultimo segmento.
Secondo: devi aggiungere all’indicatore di cui sopra quest’altro indictore che stampa SOLO l’ultimo segmento:
DEFPARAM CalculateOnLastBars = 1000
DEFPARAM DrawOnLastBarOnly   = TRUE
cciP = 150
cp   = 20
MyCCI = CCI[cciP](typicalPrice)           //CCI
//                             Fractal ZIGZAG
once lastpoint = 0
if MyCCI[cp] >= highest[2*cp+1](MyCCI) then
LH = 1
else
LH = 0
endif
if MyCCI[cp] <= lowest[2*cp+1](MyCCI) then
LL = -1
else
LL = 0
endif
if LH = 1 then
TOPy = MyCCI[cp]
TOPx = barindex[cp]
endif
if LL = -1 then
BOTy = MyCCI[cp]
BOTx = barindex[cp]
endif
if LH>0 and (lastpoint=-1 or lastpoint=0) then
//DrawSegment(lastX,lastY,TOPx,TOPy) coloured(255,255,0)
lastpoint = 1
lastX = TOPx
lastY = TOPy
endif
if LL<0 and (lastpoint=1 or lastpoint=0) then
//DrawSegment(lastX,lastY,BOTx,BOTy) coloured(255,255,0)
lastpoint = -1
lastX = BOTx
lastY = BOTy
endif
if lastpoint>0 then
DrawSegment(lastX,lastY,barindex,MyCCI) coloured(205,205,0,255)
elsif lastpoint<0 then
DrawSegment(lastX,lastY,barindex,MyCCI) coloured(205,205,0,255)
endif
RETURN
Grazie Roberto !!!!!!!!!!! Magnifico 😉