INDICATOR QQE MOD

Viewing 3 posts - 1 through 3 (of 3 total)
  • Author
    Posts
  • #231151 quote
    ARLEQUIN49ARLEQUIN49
    Participant
    Veteran

    Hello Ivan,
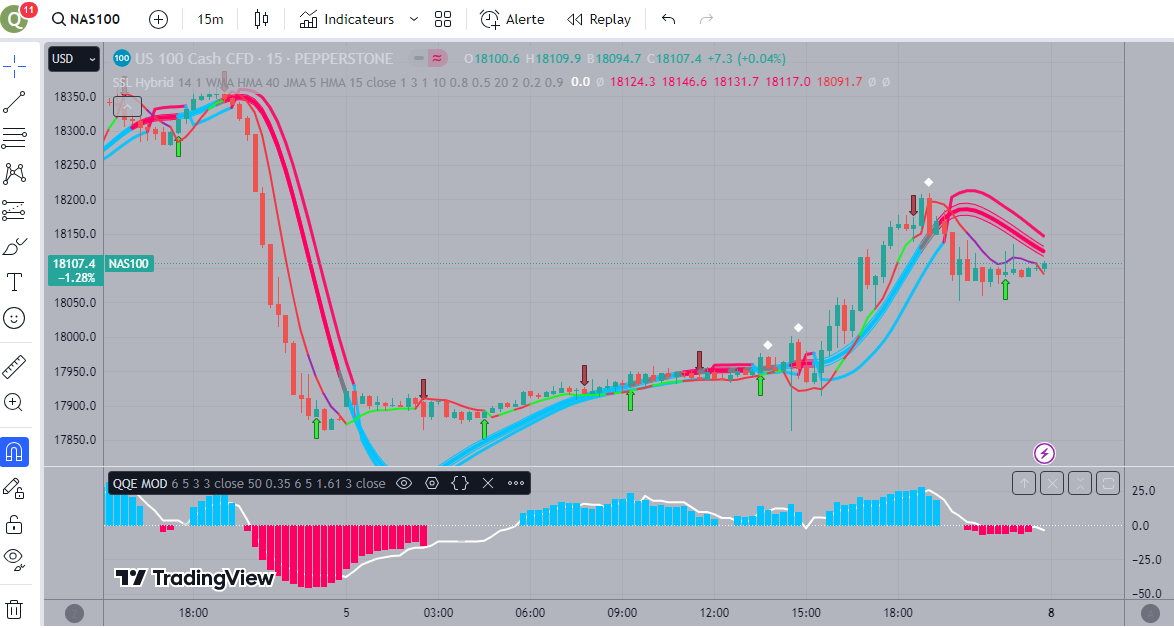
    Would it be possible to convert the code of this QQE MOD indicator which accompanies SSL HYBRID?

    Here is the code:

    //@version=4
    //By Glaz, Modified
    //
    study(“QQE MOD”)
    RSI_Period = input(6, title=’RSI Length’)
    SF = input(5, title=’RSI Smoothing’)
    QQE = input(3, title=’Fast QQE Factor’)
    ThreshHold = input(3, title=”Thresh-hold”)
    //

    src = input(close, title=”RSI Source”)
    //

    //
    Wilders_Period = RSI_Period * 2 – 1

    Rsi = rsi(src, RSI_Period)
    RsiMa = ema(Rsi, SF)
    AtrRsi = abs(RsiMa[1] – RsiMa)
    MaAtrRsi = ema(AtrRsi, Wilders_Period)
    dar = ema(MaAtrRsi, Wilders_Period) * QQE

    longband = 0.0
    shortband = 0.0
    trend = 0

    DeltaFastAtrRsi = dar
    RSIndex = RsiMa
    newshortband = RSIndex + DeltaFastAtrRsi
    newlongband = RSIndex – DeltaFastAtrRsi
    longband := RSIndex[1] > longband[1] and RSIndex > longband[1] ?
    max(longband[1], newlongband) : newlongband
    shortband := RSIndex[1] < shortband[1] and RSIndex upper ? #00c3ff : RsiMa – 50 = 50 ? QQEzlong + 1 : 0
    QQEzshort := RSIndex longband2[1] and RSIndex2 > longband2[1] ?
    max(longband2[1], newlongband2) : newlongband2
    shortband2 := RSIndex2[1] < shortband2[1] and RSIndex2 = 50 ? QQE2zlong + 1 : 0
    QQE2zshort := RSIndex2 ThreshHold2 ? color.silver :
    RsiMa2 – 50 ThreshHold2
    Greenbar2 = RsiMa – 50 > upper

    Redbar1 = RsiMa2 – 50 < 0 – ThreshHold2
    Redbar2 = RsiMa – 50 < lower
    plot(Greenbar1 and Greenbar2 == 1 ? RsiMa2 – 50 : na, title=”QQE Up”, style=plot.style_columns, color=#00c3ff, transp=0)
    plot(Redbar1 and Redbar2 == 1 ? RsiMa2 – 50 : na, title=”QQE Down”, style=plot.style_columns, color=#ff0062, transp=0)

    QQE-MOD.png QQE-MOD.png
    #231232 quote
    Iván GonzálezIván González
    Moderator
    Legend

    Ici

    //PRC_QQE MOD
    //version = 0
    //08.04.24
    //Iván González @ www.prorealcode.com
    //Sharing ProRealTime knowledge
    //-----Inputs-----------------------------------------------//
    rsiPeriod=6//RSI Length
    SF=5//RSI Smoothing
    QQE=3//Fast QQE Factor
    ThreshHold=3//Thresh-hold
    src=close
    
    length=50//Bollinger Length
    mult=0.35//BB Multiplier
    
    rsiPeriod2=6//RSI Length
    SF2=5//RSI Smoothing
    QQE2=1.61//Fast QQE Factor
    ThreshHold2=3//Thresh-hold
    src2=close
    //----------------------------------------------------------//
    //-----RSI1 calculations and trend definition---------------//
    WildersPeriod = rsiPeriod*2-1
    
    myrsi=rsi[rsiPeriod](src)
    rsiMA=average[SF,1](myrsi)
    atrRSI=abs(rsiMA[1]-rsiMA)
    MAatrRSI=average[WildersPeriod,1](atrRSI)
    dar = average[WildersPeriod,1](MAatrRSI)*QQE
    
    longband=0
    shortband=0
    trend=0
    
    DeltaFastAtrRsi = dar
    RSIndex = rsiMA
    newshortband = RSIndex + DeltaFastAtrRsi
    newlongband = RSIndex - DeltaFastAtrRsi
    if RSIndex[1] > longband[1] and RSIndex > longband[1] then
    longband=max(longband[1],newlongband)
    else
    longband=newlongband
    endif
    if RSIndex[1] < shortband[1] and RSIndex < shortband[1] then
    shortband=min(shortband[1], newshortband)
    else
    shortband=newshortband
    endif
    
    cross1 = longband[1] crosses over RSIndex or longband[1] crosses under RSIndex
    if shortband[1] crosses over RSIndex or shortband[1] crosses under RSIndex then
    trend=1
    FastAtrRsiTL=longband
    elsif cross1 then
    trend=-1
    FastAtrRsiTL=shortband
    else
    trend=trend[1]
    endif
    //----------------------------------------------------------//
    //-----Bollinger Bands--------------------------------------//
    basis=average[length,0](FastAtrRsiTL-50)
    dev=mult*std[length](FastAtrRsiTL-50)
    upper=basis+dev
    lower=basis-dev
    //----------------------------------------------------------//
    //-----RSI2 calculations and trend definition---------------//
    WildersPeriod2 = rsiPeriod2*2-1
    
    myrsi2=rsi[rsiPeriod2](src2)
    rsiMA2=average[SF2,1](myrsi2)
    atrRSI2=abs(rsiMA2[1]-rsiMA2)
    MAatrRSI2=average[WildersPeriod2,1](atrRSI2)
    dar2 = average[WildersPeriod2,1](MAatrRSI2)*QQE2
    
    longband2=0
    shortband2=0
    trend2=0
    
    DeltaFastAtrRsi2 = dar2
    RSIndex2 = rsiMA2
    newshortband2 = RSIndex2 + DeltaFastAtrRsi2
    newlongband2 = RSIndex2 - DeltaFastAtrRsi2
    if RSIndex2[1] > longband2[1] and RSIndex2 > longband2[1] then
    longband2=max(longband2[1],newlongband2)
    else
    longband2=newlongband2
    endif
    if RSIndex2[1] < shortband2[1] and RSIndex2 < shortband2[1] then
    shortband2=min(shortband2[1], newshortband2)
    else
    shortband2=newshortband2
    endif
    
    cross2 = longband2[1] crosses over RSIndex2 or longband2[1] crosses under RSIndex2
    if shortband2[1] crosses over RSIndex2 or shortband2[1] crosses under RSIndex2 then
    trend2=1
    FastAtrRsiTL2=longband2
    elsif cross2 then
    trend2=-1
    FastAtrRsiTL2=shortband2
    else
    trend2=trend2[1]
    endif
    //----------------------------------------------------------//
    //-----Color definition------------------------------------//
    if rsiMA2-50>ThreshHold2 then
    r=178
    g=181
    b=190
    a=100
    elsif rsiMA2-50<0-ThreshHold2 then
    r=178
    g=181
    b=190
    a=100
    else
    r=178
    g=181
    b=190
    a=0
    endif
    //----------------------------------------------------------//
    //-----Checkings and colors---------------------------------//
    greenbar1=rsiMA2-50>ThreshHold2
    greenbar2=rsiMA-50>upper
    redbar1=RsiMa2-50<0-ThreshHold2
    Redbar2 =RsiMa-50<lower
    
    if greenbar1 and greenbar2 then
    qqe=rsiMA2-50
    rb=0
    gb=195
    bb=255
    elsif redbar1 and redbar2 then
    qqe=rsiMA2-50
    rb=255
    gb=0
    bb=98
    else
    qqe=0
    rb=120
    gb=123
    bb=134
    endif
    //----------------------------------------------------------//
    zero=0
    return qqe as "QQE" coloured(rb,gb,bb)style(histogram),FastAtrRsiTL2-50 as "QQE Line"coloured("Black")style(line,2),rsiMA2-50 as"Histo2"coloured(r,g,b,a)style(histogram) ,zero as "Zero" coloured("white")style(dottedline)
    
    Msport71 thanked this post
    #231248 quote
    ARLEQUIN49ARLEQUIN49
    Participant
    Veteran

    Super merci beaucoup

Viewing 3 posts - 1 through 3 (of 3 total)

  • You must be logged in to reply to this topic.

ProRealAI ProRealAI New

Stuck on this ProBuilder code?

Describe what this topic is trying to build, in plain English, and ProRealAI writes the ProRealTime™ indicator, screener or system for you.

Available in 7 languages
Try ProRealAI

INDICATOR QQE MOD


ProBuilder : Indicateurs & Outils Personnalisés

New Reply
Author
author-avatar
ARLEQUIN49 @arlequin49 Participant
Summary

This topic contains 2 replies,
has 2 voices, and was last updated by ARLEQUIN49ARLEQUIN49
2 years, 5 months ago.

Topic Details
Forum: ProBuilder : Indicateurs & Outils Personnalisés
Language: French
Started: 04/06/2024
Status: Active
Attachments: 1 files
ProRealCode ProRealCode
Loading...