Bonjour,
J’ai trouvé une version du TD sequential qui me semble plus adaptée par rapport à mon besoin par contre il faudrait le convertir en fichier ITF pour que je puisse l’importer dans prorealtime et je connais rien en langage informatique. Quelqu’un pourrait me dire comment procéder si c’est pas trop compliqué svp ? Merci par avance
Voici le script :
study(“Number Indicator / Thomas DeMark Sequential”,overlay=true)
transp=input(0)
Numbers=input(true)
SR=input(true)
Barcolor=input(true)
TD = close > close[4] ?nz(TD[1])+1:0
TS = close < close[4] ?nz(TS[1])+1:0TDUp = TD – valuewhen(TD < TD[1], TD , 1 )
TDDn = TS – valuewhen(TS < TS[1], TS , 1 )
plotshape(Numbers?(TDUp==1?true:na):na,style=shape.triangledown,text=”1″,color=green,location=location.abovebar,transp=transp)
plotshape(Numbers?(TDUp==2?true:na):na,style=shape.triangledown,text=”2″,color=green,location=location.abovebar,transp=transp)
plotshape(Numbers?(TDUp==3?true:na):na,style=shape.triangledown,text=”3″,color=green,location=location.abovebar,transp=transp)
plotshape(Numbers?(TDUp==4?true:na):na,style=shape.triangledown,text=”4″,color=green,location=location.abovebar,transp=transp)
plotshape(Numbers?(TDUp==5?true:na):na,style=shape.triangledown,text=”5″,color=green,location=location.abovebar,transp=transp)
plotshape(Numbers?(TDUp==6?true:na):na,style=shape.triangledown,text=”6″,color=green,location=location.abovebar,transp=transp)
plotshape(Numbers?(TDUp==7?true:na):na,style=shape.triangledown,text=”7″,color=green,location=location.abovebar,transp=transp)
plotshape(Numbers?(TDUp==8?true:na):na,style=shape.triangledown,text=”8″,color=green,location=location.abovebar,transp=transp)
plotshape(Numbers?(TDUp==9?true:na):na,style=shape.triangledown,text=”9″,color=green,location=location.abovebar,transp=transp)plotshape(Numbers?(TDDn==1?true:na):na,style=shape.triangleup,text=”1″,color=red,location=location.belowbar,transp=transp)
plotshape(Numbers?(TDDn==2?true:na):na,style=shape.triangleup,text=”2″,color=red,location=location.belowbar,transp=transp)
plotshape(Numbers?(TDDn==3?true:na):na,style=shape.triangleup,text=”3″,color=red,location=location.belowbar,transp=transp)
plotshape(Numbers?(TDDn==4?true:na):na,style=shape.triangleup,text=”4″,color=red,location=location.belowbar,transp=transp)
plotshape(Numbers?(TDDn==5?true:na):na,style=shape.triangleup,text=”5″,color=red,location=location.belowbar,transp=transp)
plotshape(Numbers?(TDDn==6?true:na):na,style=shape.triangleup,text=”6″,color=red,location=location.belowbar,transp=transp)
plotshape(Numbers?(TDDn==7?true:na):na,style=shape.triangleup,text=”7″,color=red,location=location.belowbar,transp=transp)
plotshape(Numbers?(TDDn==8?true:na):na,style=shape.triangleup,text=”8″,color=red,location=location.belowbar,transp=transp)
plotshape(Numbers?(TDDn==9?true:na):na,style=shape.triangleup,text=”9″,color=red,location=location.belowbar,transp=transp)
//————//
// Sell Setup //
//————//
priceflip = barssince(close<close[4])
sellsetup = close>close[4] and priceflip
sell = sellsetup and barssince(priceflip!=9)
sellovershoot = sellsetup and barssince(priceflip!=13)
sellovershoot1 = sellsetup and barssince(priceflip!=14)
sellovershoot2 = sellsetup and barssince(priceflip!=15)
sellovershoot3 = sellsetup and barssince(priceflip!=16)//———-//
// Buy setup//
//———-//
priceflip1 = barssince(close>close[4])
buysetup = close<close[4] and priceflip1
buy = buysetup and barssince(priceflip1!=9)
buyovershoot = barssince(priceflip1!=13) and buysetup
buyovershoot1 = barssince(priceflip1!=14) and buysetup
buyovershoot2 = barssince(priceflip1!=15) and buysetup
buyovershoot3 = barssince(priceflip1!=16) and buysetup//———-//
// TD lines //
//———-//
TDbuyh = valuewhen(buy,high,0)
TDbuyl = valuewhen(buy,low,0)
TDsellh = valuewhen(sell,high,0)
TDselll = valuewhen(sell,low,0)//———-//
// Plots //
//———-//plot(SR?(TDbuyh ? TDbuyl: na):na,style=circles, linewidth=1, color=red)
plot(SR?(TDselll ? TDsellh : na):na,style=circles, linewidth=1, color=lime)
barcolor(Barcolor?(sell? #FF0000 : buy? #00FF00 : sellovershoot? #FF66A3 : sellovershoot1? #FF3385 : sellovershoot2? #FF0066 : sellovershoot3? #CC0052 : buyovershoot? #D6FF5C : buyovershoot1? #D1FF47 : buyovershoot2? #B8E62E : buyovershoot3? #8FB224 : na):na)
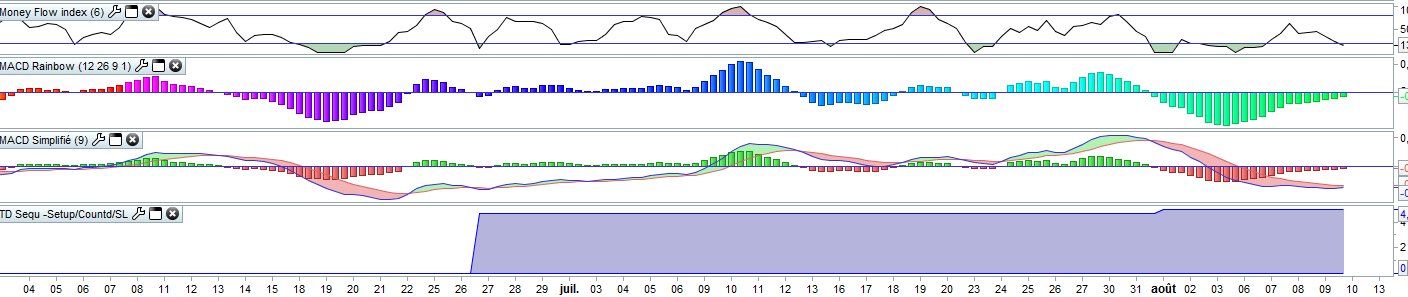
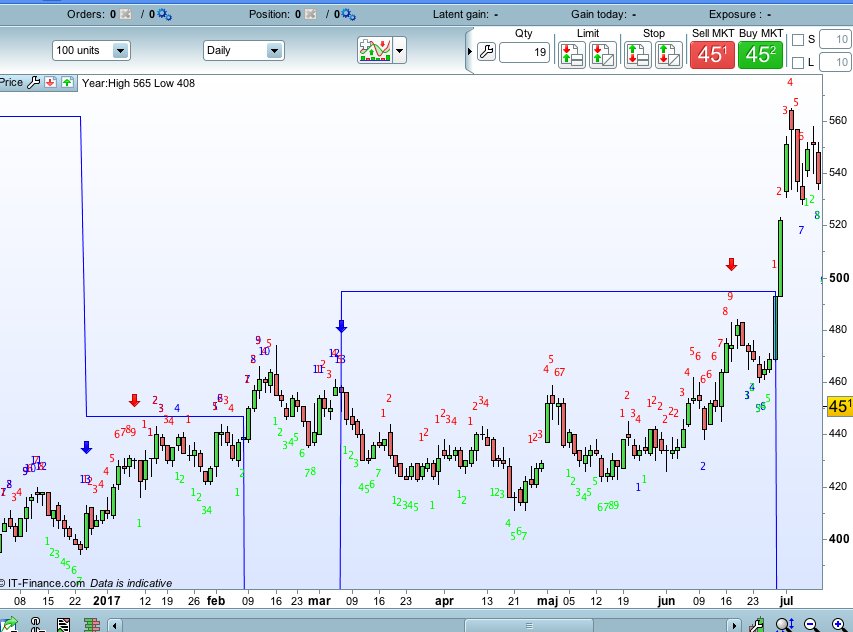
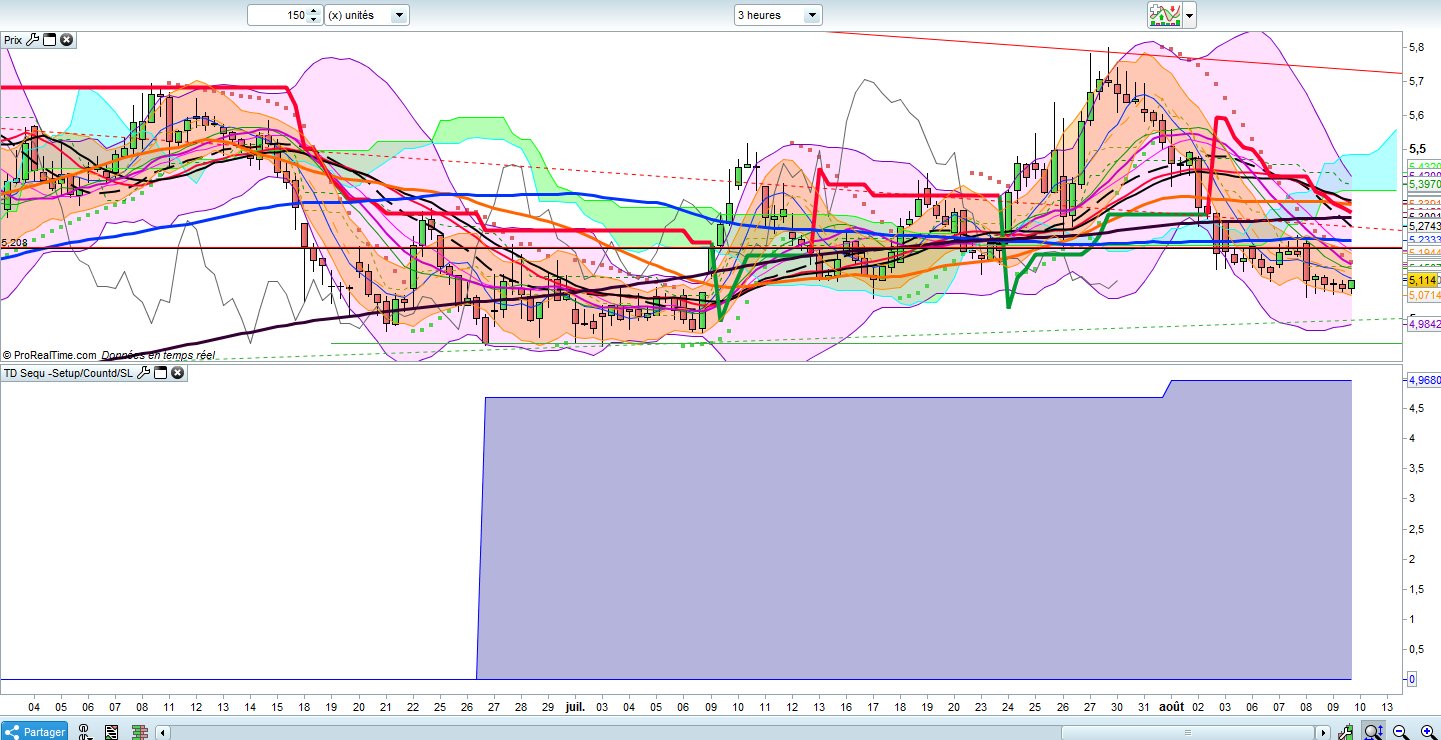
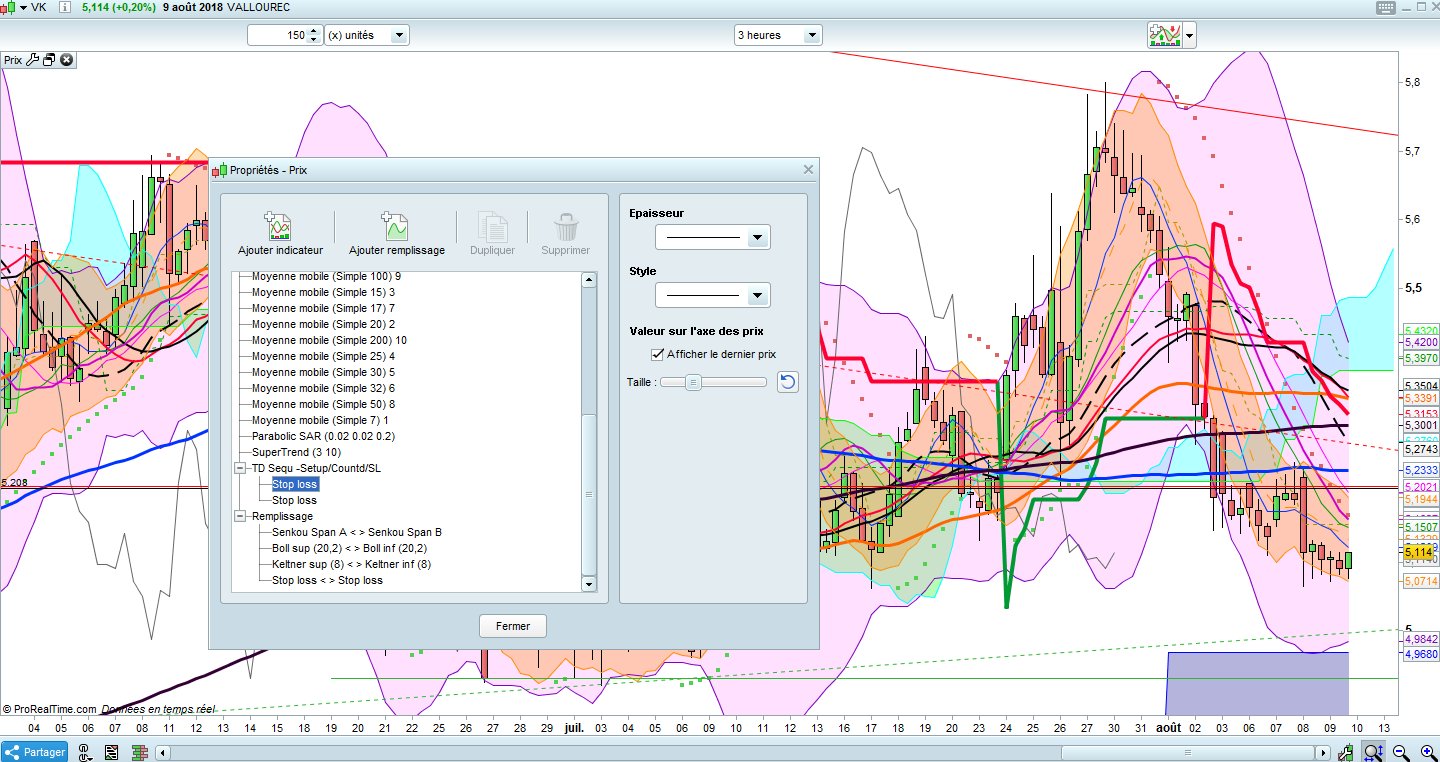
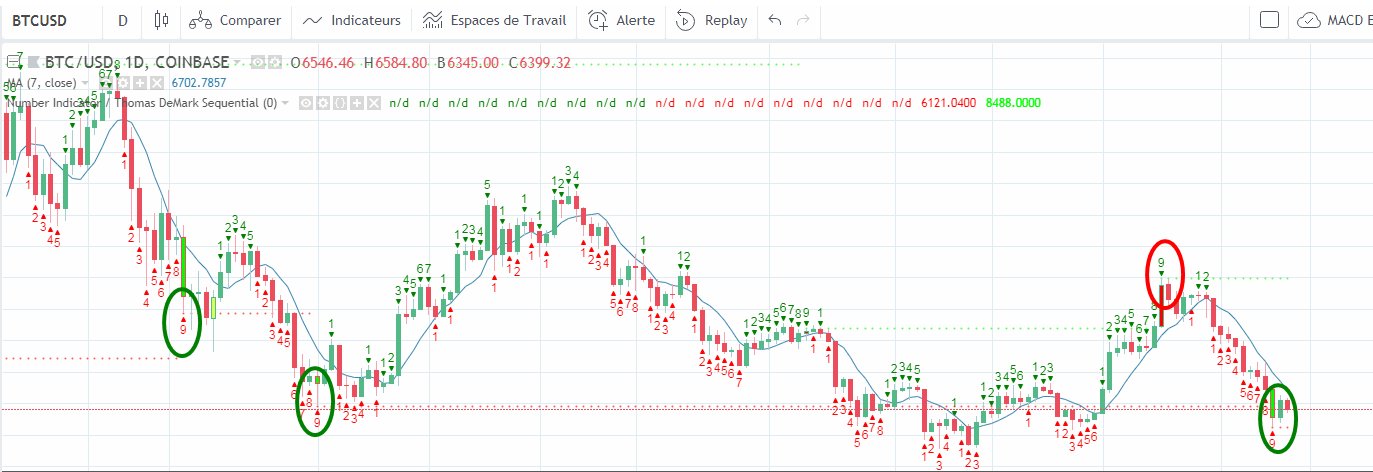
Voila ce que cela donne sur tradingwiew avec un editeur PINE (voir capture écran)