I’ve been testing various demo strategies with PRT on my IG Demo account since mid January but I noticed today that things do not seem to be adding up the same on my ‘My IG’ page compared to the PRT results. So I exported all the trades into Excel and checked it out .
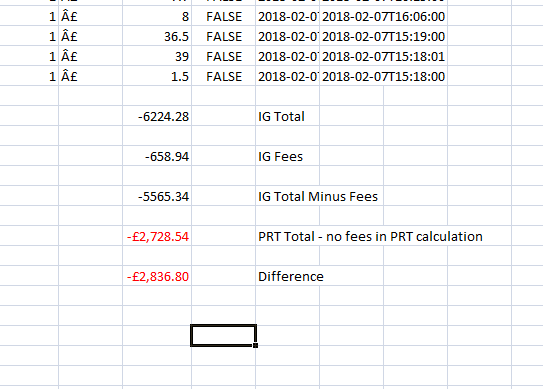
I subtracted all the overnight fees and interest from the IG total so it should be the same as the total shown on the PRT ‘Detailed Report’ but it was miles out.
[attachment file=68744]
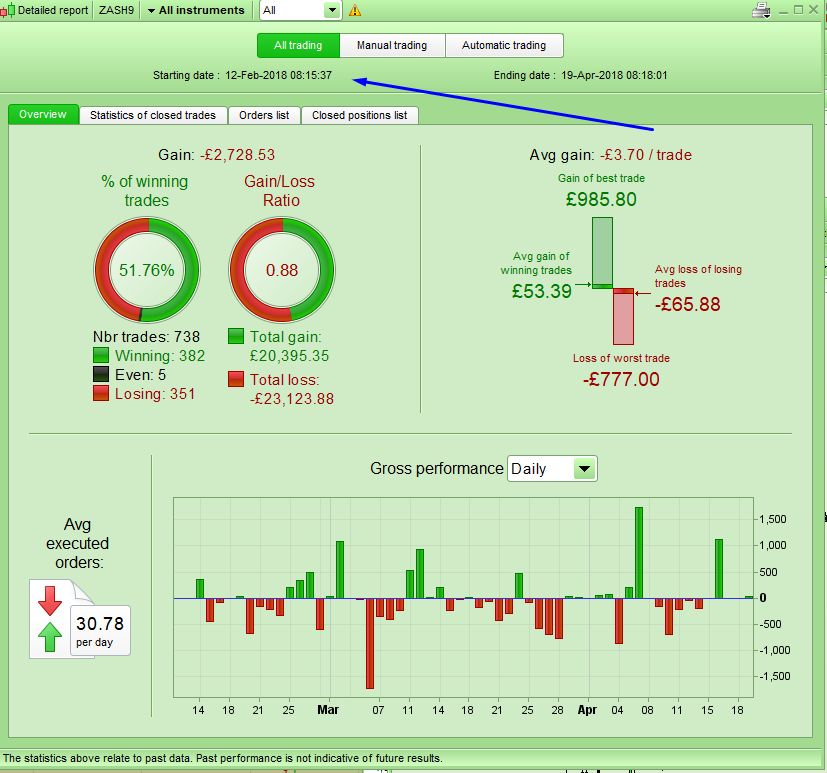
I then noticed that the PRT ‘Detailed Report’ only showed trades from 12/2/2018 whereas IG showed trades from 07/02/2018.
[attachment file=68746]
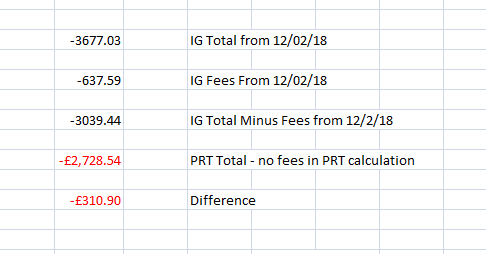
So I reworked the calculations removing the extra data and there was still a difference – much smaller at just £310 but still a difference.
[attachment file=68745]
So first of all I don’t understand why the PRT and IG totals do not add up the same and secondly I don’t understand why the PRT ‘Detailed Report’ misses off the first week of trading? It is not a very detailed report if a whole week of trading is missing from the results!
Can others please check their accounts and see if the start date on the PRT ‘Detailed Report’ is the same as the start date for the first trade in their IG demo trading account?
These sort of errors make analysing strategy and portfolio performance quite difficult.
Can others please check their accounts and see if the start date on the PRT ‘Detailed Report’ is the same as the start date for the first trade in their IG demo trading account?
What do you mean by IG demo trading account ??
Do I need to have IG + direct PRT and also IG + sponsored PRT to do as you request above?
As far as I know there is no difference.
For IG info:
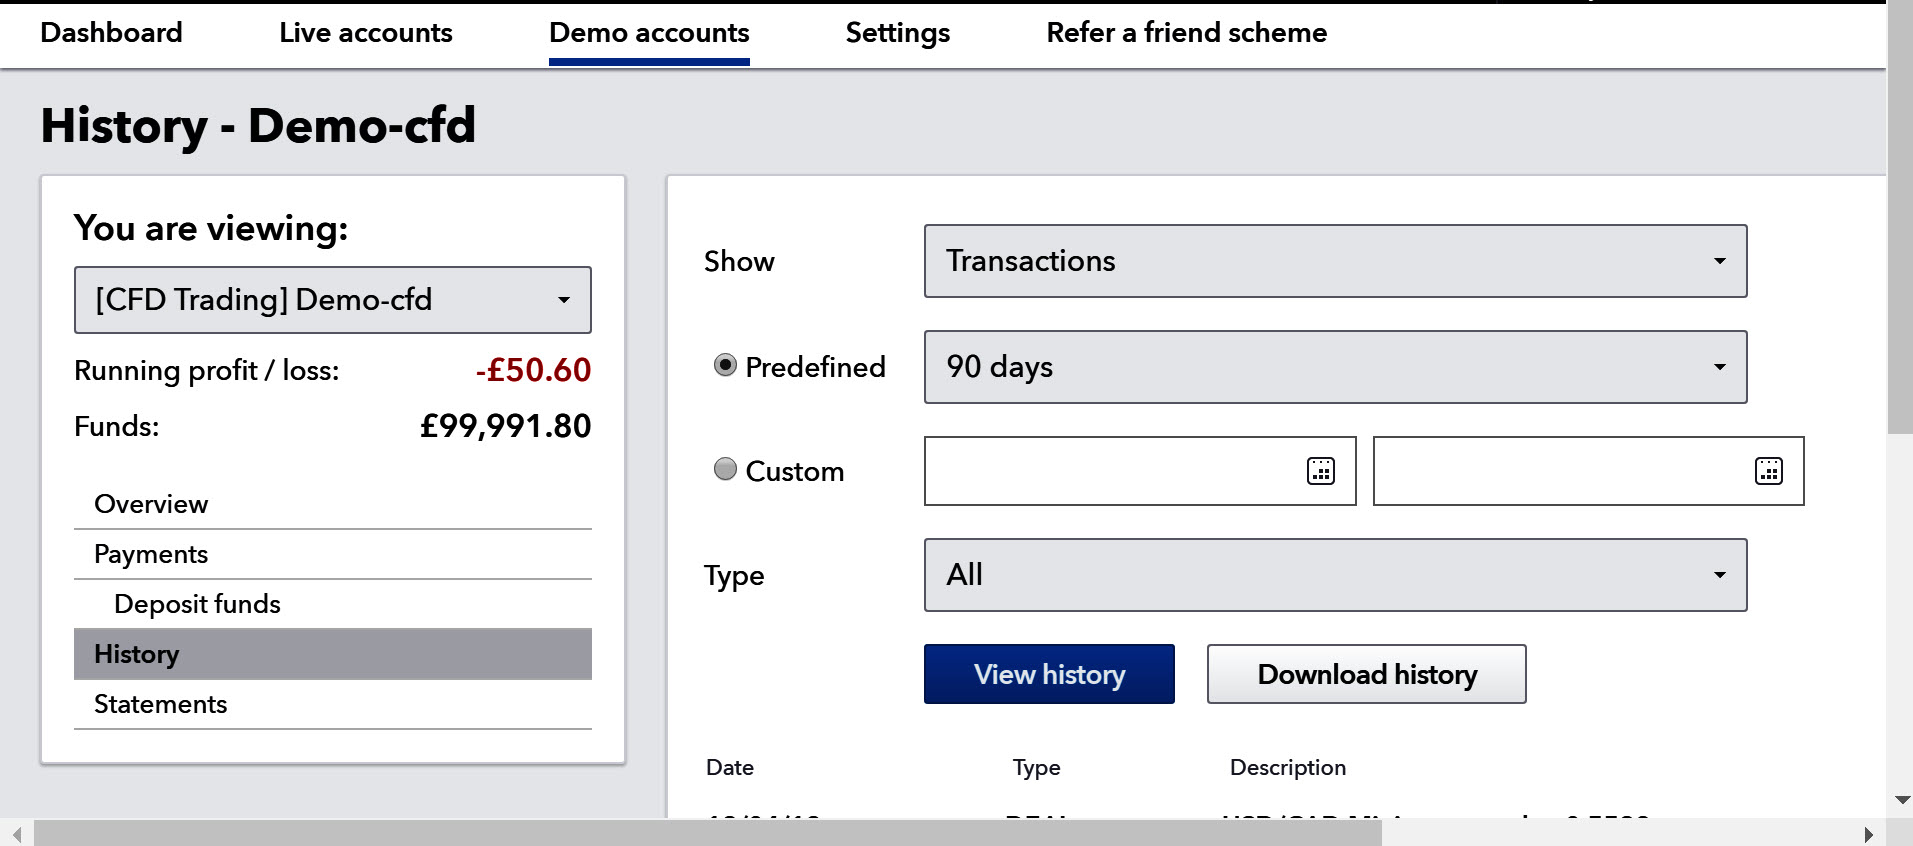
Log into your IG account and make sure that you are in ‘My IG’ rather than the platform by clicking on the drop down arrow by your name on the top right and selecting ‘My IG’. Click on ‘Demo accounts’ and then select the correct account for viewing. Then click on ‘See more’ and then the highest numbered page shown at bottom right. This page will have your first trades on it.
You can also download your trade history from here to an Excel spread sheet.
I had the same experience.
The P&L amounts from IG differs from PRT.
According to PRT reports I should have earned £120 more than according to IG reports.
These were on live account!
I queried this difference of £120 some months ago with IG. Small differences on every trade that one’s eye will not catch immediately but they are there and they all add up.
The amounts a queried was on CFD on Indices and did not include any dividend or interest etc. Purely the amount stated as profit or loss.
The replies I got from IG ranged anything from the difference in time zones to that their systems is not on the same platform to some other lame excuses which was laughable.
My other post on the same topic.
IG vs PRT – Differences in Profit/Loss
Is attached what you mean? I learnt something new as I don’t think I can’t recall using that method of viewing account history etc … very useful!
90 days max available on my IG Direct CFD Demo Account.
Yes those reports from IG.
Compare entry for entry with PRT. It’s a bit of a mission to compare in spreasdsheet but it might just be worth it.
90 days max available on my IG Direct CFD Demo Account.
Click on Custom button or date box to get everything.
I have just wasted an hour of my life that I will never get back comparing trade for trade the results from IG and PRT in Excel and I think I have a conclusion of sorts.
I found six trades in my IG report that were not in my PRT report.
When you use the PRT ‘Detailed Report’ I think that it initially lists the transactions in Date of Entry but I changed this to Date of Exit so as to more closely match the IG report before dragging them into Excel. I think then what happens is that trades that were opened before the period being checked are not shown because of their entry date. PRT just reorganises the trades in the display but if they were never there because the entry date was too early then it does not show them despite the exit date being in range. So I had six winners that made my IG report look great but were missing from the PRT report so it looked terrible.
I guess this still all comes down to the missing first week of data from the PRT (not so) Detailed Report. Is the amount of history shown limited and maybe I am just seeing the first week being dropped off the display? This is a new account to me – can someone check their longer running account and see how far back the history goes in the closed positions list of their ‘Detailed Report’ please?
I then noticed that the PRT ‘Detailed Report’ only showed trades from 12/2/2018 whereas IG showed trades from 07/02/2018.
I think the reason that this happened is because of the 1500 max individual trade limitation in the detailed report (the yellow triangle box on the top suggests that this is the case ?). I know that strictly speaking you’re 12 short of the 750 buy+sell trades but it’s never exact (I just checked my history and it limits it also to 740 odd round trip trades on certain instruments.), This has always been the case with the detailed report – the history goes back 1500 trades max or the earliest date of the first trade if <1500. That doesn’t solve the discrepancy in P&L but it looks like you’ve figured it out. Was going to suggest if any of the instruments have dividend adjustments perhaps ?
Thanks for your reply Manel. I extracted all the dividends and overnight interest fees before doing the comparison.
Thanks for pointing out the little triangle – I had not spotted that. Strangely I have just gone back into the ‘Detailed Report’ and it is not there now!
Does this 1500 limit also effect the overall figures on the ‘Overview’ tab as well or is that every trade that has ever been placed. If it is not then it makes the ‘Detailed Report’ just a ‘Bit Of Recent History Report’.
I guess I will just have to keep the ‘My IG’ page open if I want to get accurate figures as it seems that the PRT reports have to be questioned for their accuracy and as to whether they are actually telling you what they suggest they are telling you before you can use any of the information.
What with my ProOrder AutoTrading window showing incorrect balances and my Detailed Report window cutting the history off I’m beginning to question what the point of using these windows is. Pen and paper and a calculator would be more accurate than what I have on PRT!
Yes, unfortunately, the 1500 limit also applies to the overview tab, it does NOT show every trade that’s been placed (unless it totals <1500). Basically each instrument is limited to 1500 including if you select “All Instruments” (this is also classified as an “instrument”) so in this case it also counts back to the last 1500 trades (across everything) and displays them. Therefore, I find it more useful to select an individual instrument to view the results as that will always have more history going back further than “All instruments” will ever display.
Eg. if in your account you have 1000 trades in the DAX and 1000 on the DOW you will only see the last 1500 trades across both if you select “All Instruments” but if you select DAX or DOW individually you will see the entire history from the first trade to the last.
But this also means, as you rightly point out, that the overview tab becomes less and less useful as it doesn’t give you a full picture of your trading on a portfolio basis. Why PRT don’t lift this restriction is beyond me because as we can clearly see they have all the trade data already to hand ! Seems like a pretty simple software coding fix which requires minimal work but could provide PRT users with potentially a lot of useful info, no brainer really.
So basically once you have hit 1500 trades (and that is only 750 in reality as opening and closing a position counts as two trades) in any instrument or in total trades the PRT Detailed Report becomes a worthless bit of information and you are better just to check on your ‘My IG’ history to see how things truly are.
I guess this 1500 restriction also applies to each strategy running live so you are better to drag the results into Excel before 750 trades is reached and stop, delete and re-start the strategy to zero the count. Jeez what a lot of fart-arsing and fannying about when as you say Manel all the info is already there and available.
Yep, spot on. Ironically, the more you trade the less useful the report becomes ! I’d love for someone from PRT to explain the business logic of this…..:-)
So if you conduct a handful of trades a week, you’ll never even notice this restriction. But if you run scalping strategies or ones where you scale into and out of positions in small increments, this report becomes useless quite rapidly.
Actually that’s a good point, I’ve not noticed the 1500 limit if you access the history from the ProOrder Autotrading module for each strategy as I don’t yet have any strategy that has racked up that many trades. But I think your assumption is probably correct. What a farce.
It’s as if PRT have the Demo Platforms as exactly that … Demonstration … and not an essential tool (that needs to work 100%) to carry out Forward Testing in a live environment of beta AutoSystems?
That ProOrder AutoTrading Window drives me insane with all it’s foibles and it’s next to useless anyway even after all the faffing we have to do to use it!? I’ll put money on it that it has hardly changed since it’s first inception ***? years ago??
@ Grahal. If only that were the case ! I know this thread started talking about the demo platform but whatever we’ve talked about above is also applicable to the Live platform, same drawbacks/issues.
Demo platforms having reduced functionality (and as we can all verify, they do) we can live with somewhat, although not ideal. But the Live platform also having those same problems ? Well….. that’s pretty much unacceptable in my view.
A topic for another thread, but in my view a Demo platform should be an EXACT copy of the Live minus the plug-ins that execute live trades, connects to the dealers/exchanges and moves actual cash around. Otherwise what’s the point of a demo if it doesn’t resemble live ? When you test drive a car from a dealer and like it and want to purchase, the dealer then doesn’t go “that’s great, we’ll give you the exact same car but it’ll not have a steering wheel, stereo or lights but the bulk of the car (95%+) will be present, so you should have the same experience…..” 🙂
Appreciate I’m being oversimplistic perhaps and there is more coding between the two platforms than we realise but the principle is valid.