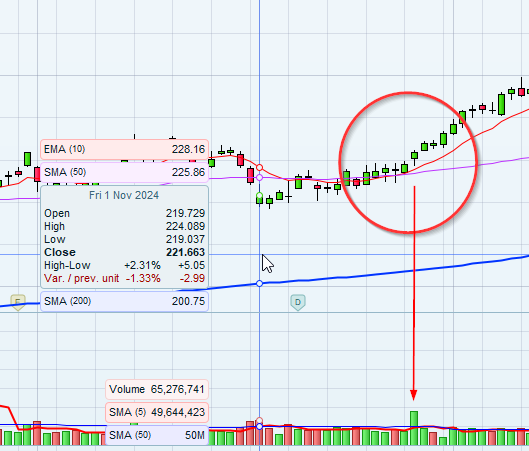
After a period of moving averages (EMA10 and EMA50) intertwining, the price begins to start up. One can see the volume increases unnormally.
There you go:
P            = 10   //periods over which to scan for multiple crossovers
N            = 2    //number of crossovers occurred with the last P bars to
//                    tell the two EMAs were intertwining
Ema10        = average[10,1](close)
Ema50        = average[50,1](close)
BullishCROSS = Ema10 CROSSES OVER  Ema50
BearishCROSS = Ema10 CROSSES UNDER Ema50
Crossovers   = BullishCROSS OR BearishCROSS
// check if there were too many crossovers within P periods
c1a          = (summation[P](Crossovers) < N)
c1b          = (summation[P](Crossovers) >= N)
c1           = c1a AND c1b[1]
// check if the distance between the two EMAs is > than its average
EmaGap       = abs(Ema10 - Ema50)
GapAverage   = average[P](EmaGap)
c2           = EmaGap > GapAverage
// check that the GAP betweemn the two EMAs is increasing, using a
// 1-bar comparison, or a comparison over multiple periods using
// SUMMATION
c3           = EmaGap > EmaGap[1]// or (summation[2](EmaGap > EmaGap[1]) = 2)
Cond         = c1 AND c2 AND c3
Screener[Cond AND (high <> low)]
Hi Roberto,
Thanks for the code first. In order to better understand your code, I test your code piece for piece. First I do as follow:
P            = 10   //periods over which to scan for multiple crossovers
N            = 2    //number of crossovers occurred with the last P bars to
//                    tell the two EMAs were intertwining
Ema10        = average[10,1](close)
Ema50        = average[50,1](close)
BullishCROSS = Ema10 CROSSES OVER  Ema50
BearishCROSS = Ema10 CROSSES UNDER Ema50
Crossovers   = BullishCROSS OR BearishCROSS
// check if there were too many crossovers within P periods
c1b          = (summation[P](Crossovers) >= N)

Cond         = c1b

Screener[Cond]
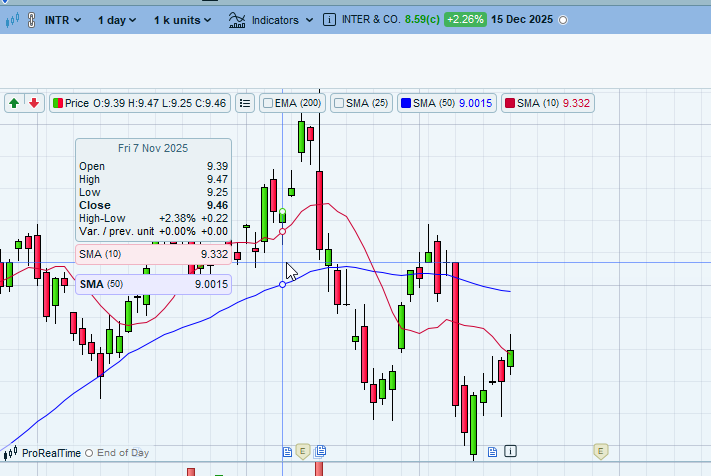
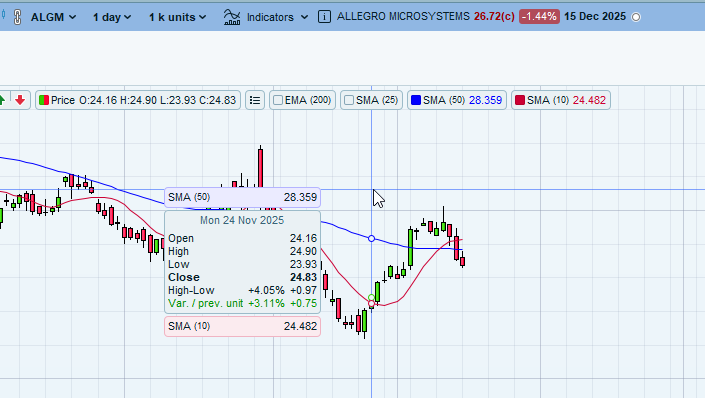
This will scann out the stocks, which SMA[10] and SMA[50] have at least 2 times cross over or cross under. But the result seems not fulfilled as the screener wants. Attached are two result examples.
Besides, what does average[10,1](close) mean? I can’t find this syntax in the tutorial. Is it the same as average[10](close)[1]?
Your line
c1b = (summation[P](Crossovers) >= N)
retrieves all instruments where in the last 10 periods there were 2+ crossovers. In my tests it works like a charm.
It must be due to the fact that you used SMAs on your chart, while in your post you asked for EMAs, which is what the line
Ema10 = average[10,1](close)
means (I named it EMA because it’s not an SMA). You can find details on the page https://www.prorealcode.com/documentation/average/.
Hi Boberto,
to the code
c1a = (summation[P](Crossovers) < N)
This means there could be no any cross over or cross under, right? And further:
c1 = c1a AND c1b[1]
What does the c1b[1] mean? What’s the sense to use the AND?
And to the code at the end:
(high <> low)
Do you think there would be the moment where high = low?
c1a = (summation[P](Crossovers) < N)
means that less than N crossovers should have occurred in the last P periods.
c1 = c1a AND c1b[1]
C1 is true when both the current C1a is true AND the previous C1b is true. This is because C1a and C1b are each the opposite of each other, so when the current condition is true, on the previous bar the other one should have been true, to be able to spot a change.
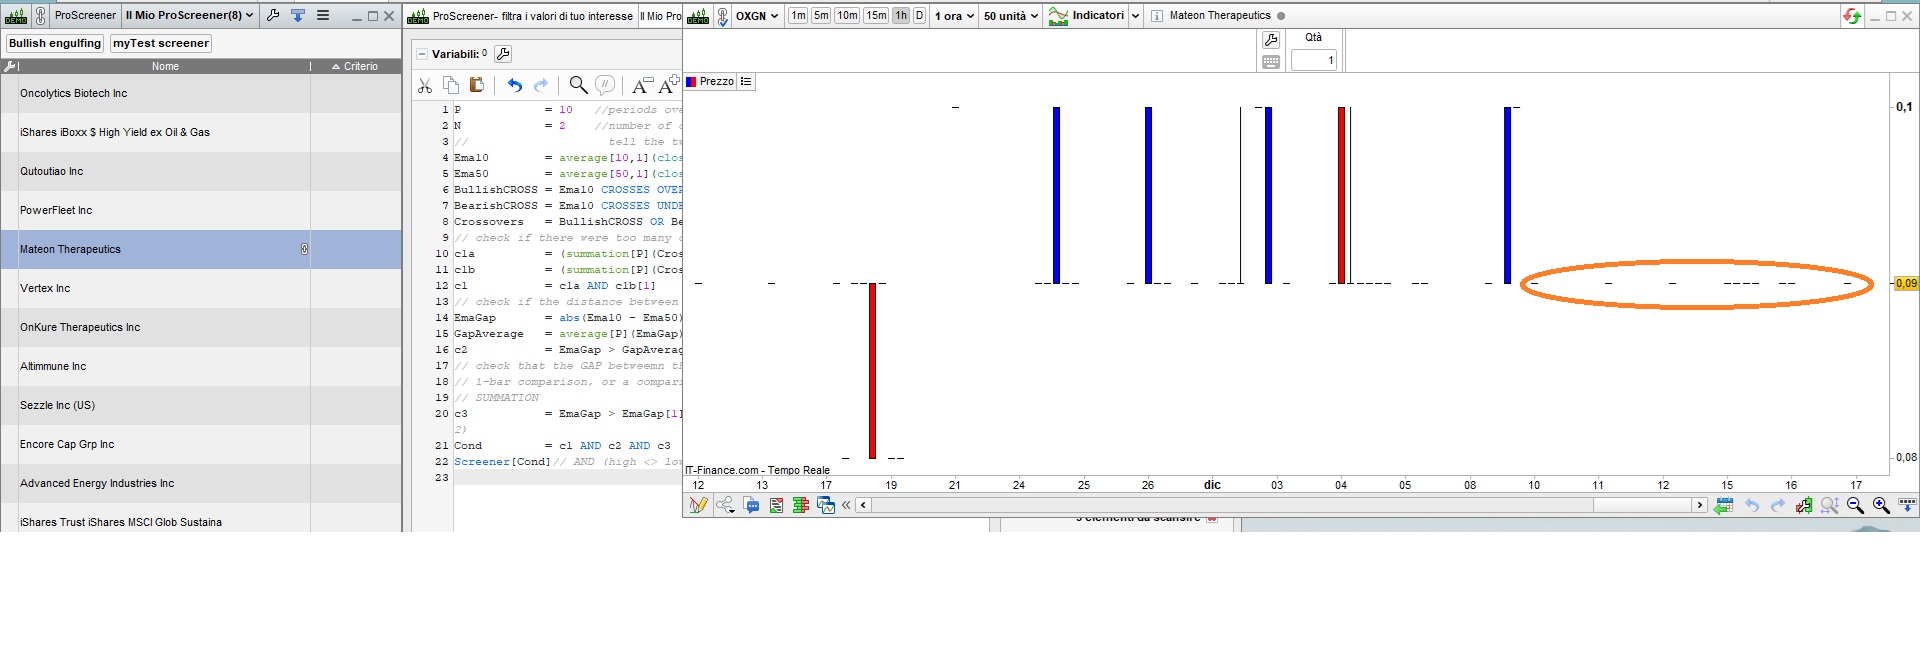
(high <> low)
is to get rid of fake results, which sometimes are returned, when there hasn’t been any trade (see the attached pic).
Many thanks. It seems I should better use the (high <> low) in every screener.
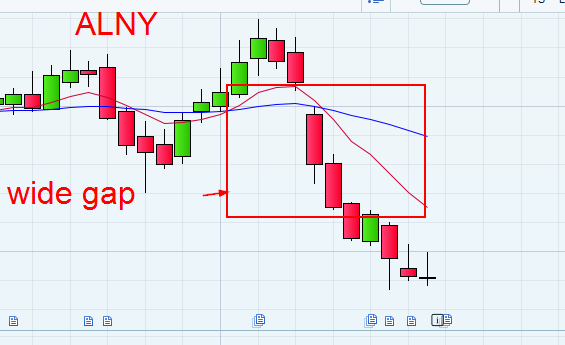
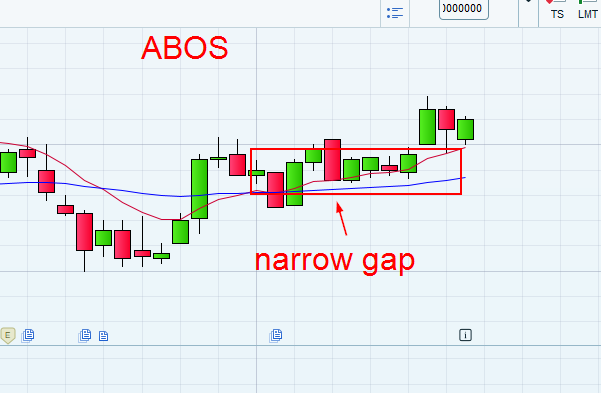
Another point: one can see, some stocks screened out are not so ideal for enter since the EMA-Gap too wide, as shown by ALNY. Is it possible to add more conditon to restrict the EMA-Gap channel more narrow as shown by ABOS? I’ve changed the second EMA’s period from 50 to 30. It helps a little. But maybe there is another better way?
I added condition C4, to check that the GAP is less that the AverageGAP * X, where X is a multiplier of your choice. I used 2.5 time its average, but it can also be greater or lower (no less than 1.0, otherwise it’s the opposite of condition C2, so no result will be shown):
P            = 10   //periods over which to scan for multiple crossovers
N            = 2    //number of crossovers occurred with the last P bars to
MaxGap       = 2.5  //2.5 times its average
//                    tell the two EMAs were intertwining
Ema10        = average[10,1](close)
Ema50        = average[50,1](close)
BullishCROSS = Ema10 CROSSES OVER  Ema50
BearishCROSS = Ema10 CROSSES UNDER Ema50
Crossovers   = BullishCROSS OR BearishCROSS
// check if there were too many crossovers within P periods
c1a          = (summation[P](Crossovers) < N)
c1b          = (summation[P](Crossovers) >= N)
c1           = c1a AND c1b[1]
// check if the distance between the two EMAs is > than its average
EmaGap       = abs(Ema10 - Ema50)
GapAverage   = average[P](EmaGap)
c2           = EmaGap > GapAverage
// check that the GAP betweemn the two EMAs is increasing, using a
// 1-bar comparison, or a comparison over multiple periods using
// SUMMATION
c3           = EmaGap > EmaGap[1]// or (summation[2](EmaGap > EmaGap[1]) = 2)
c4           = EmaGap <= (GapAverage * MaxGap)
Cond         = c1 AND c2 AND c3 AND c4
Screener[Cond AND (high <> low)]