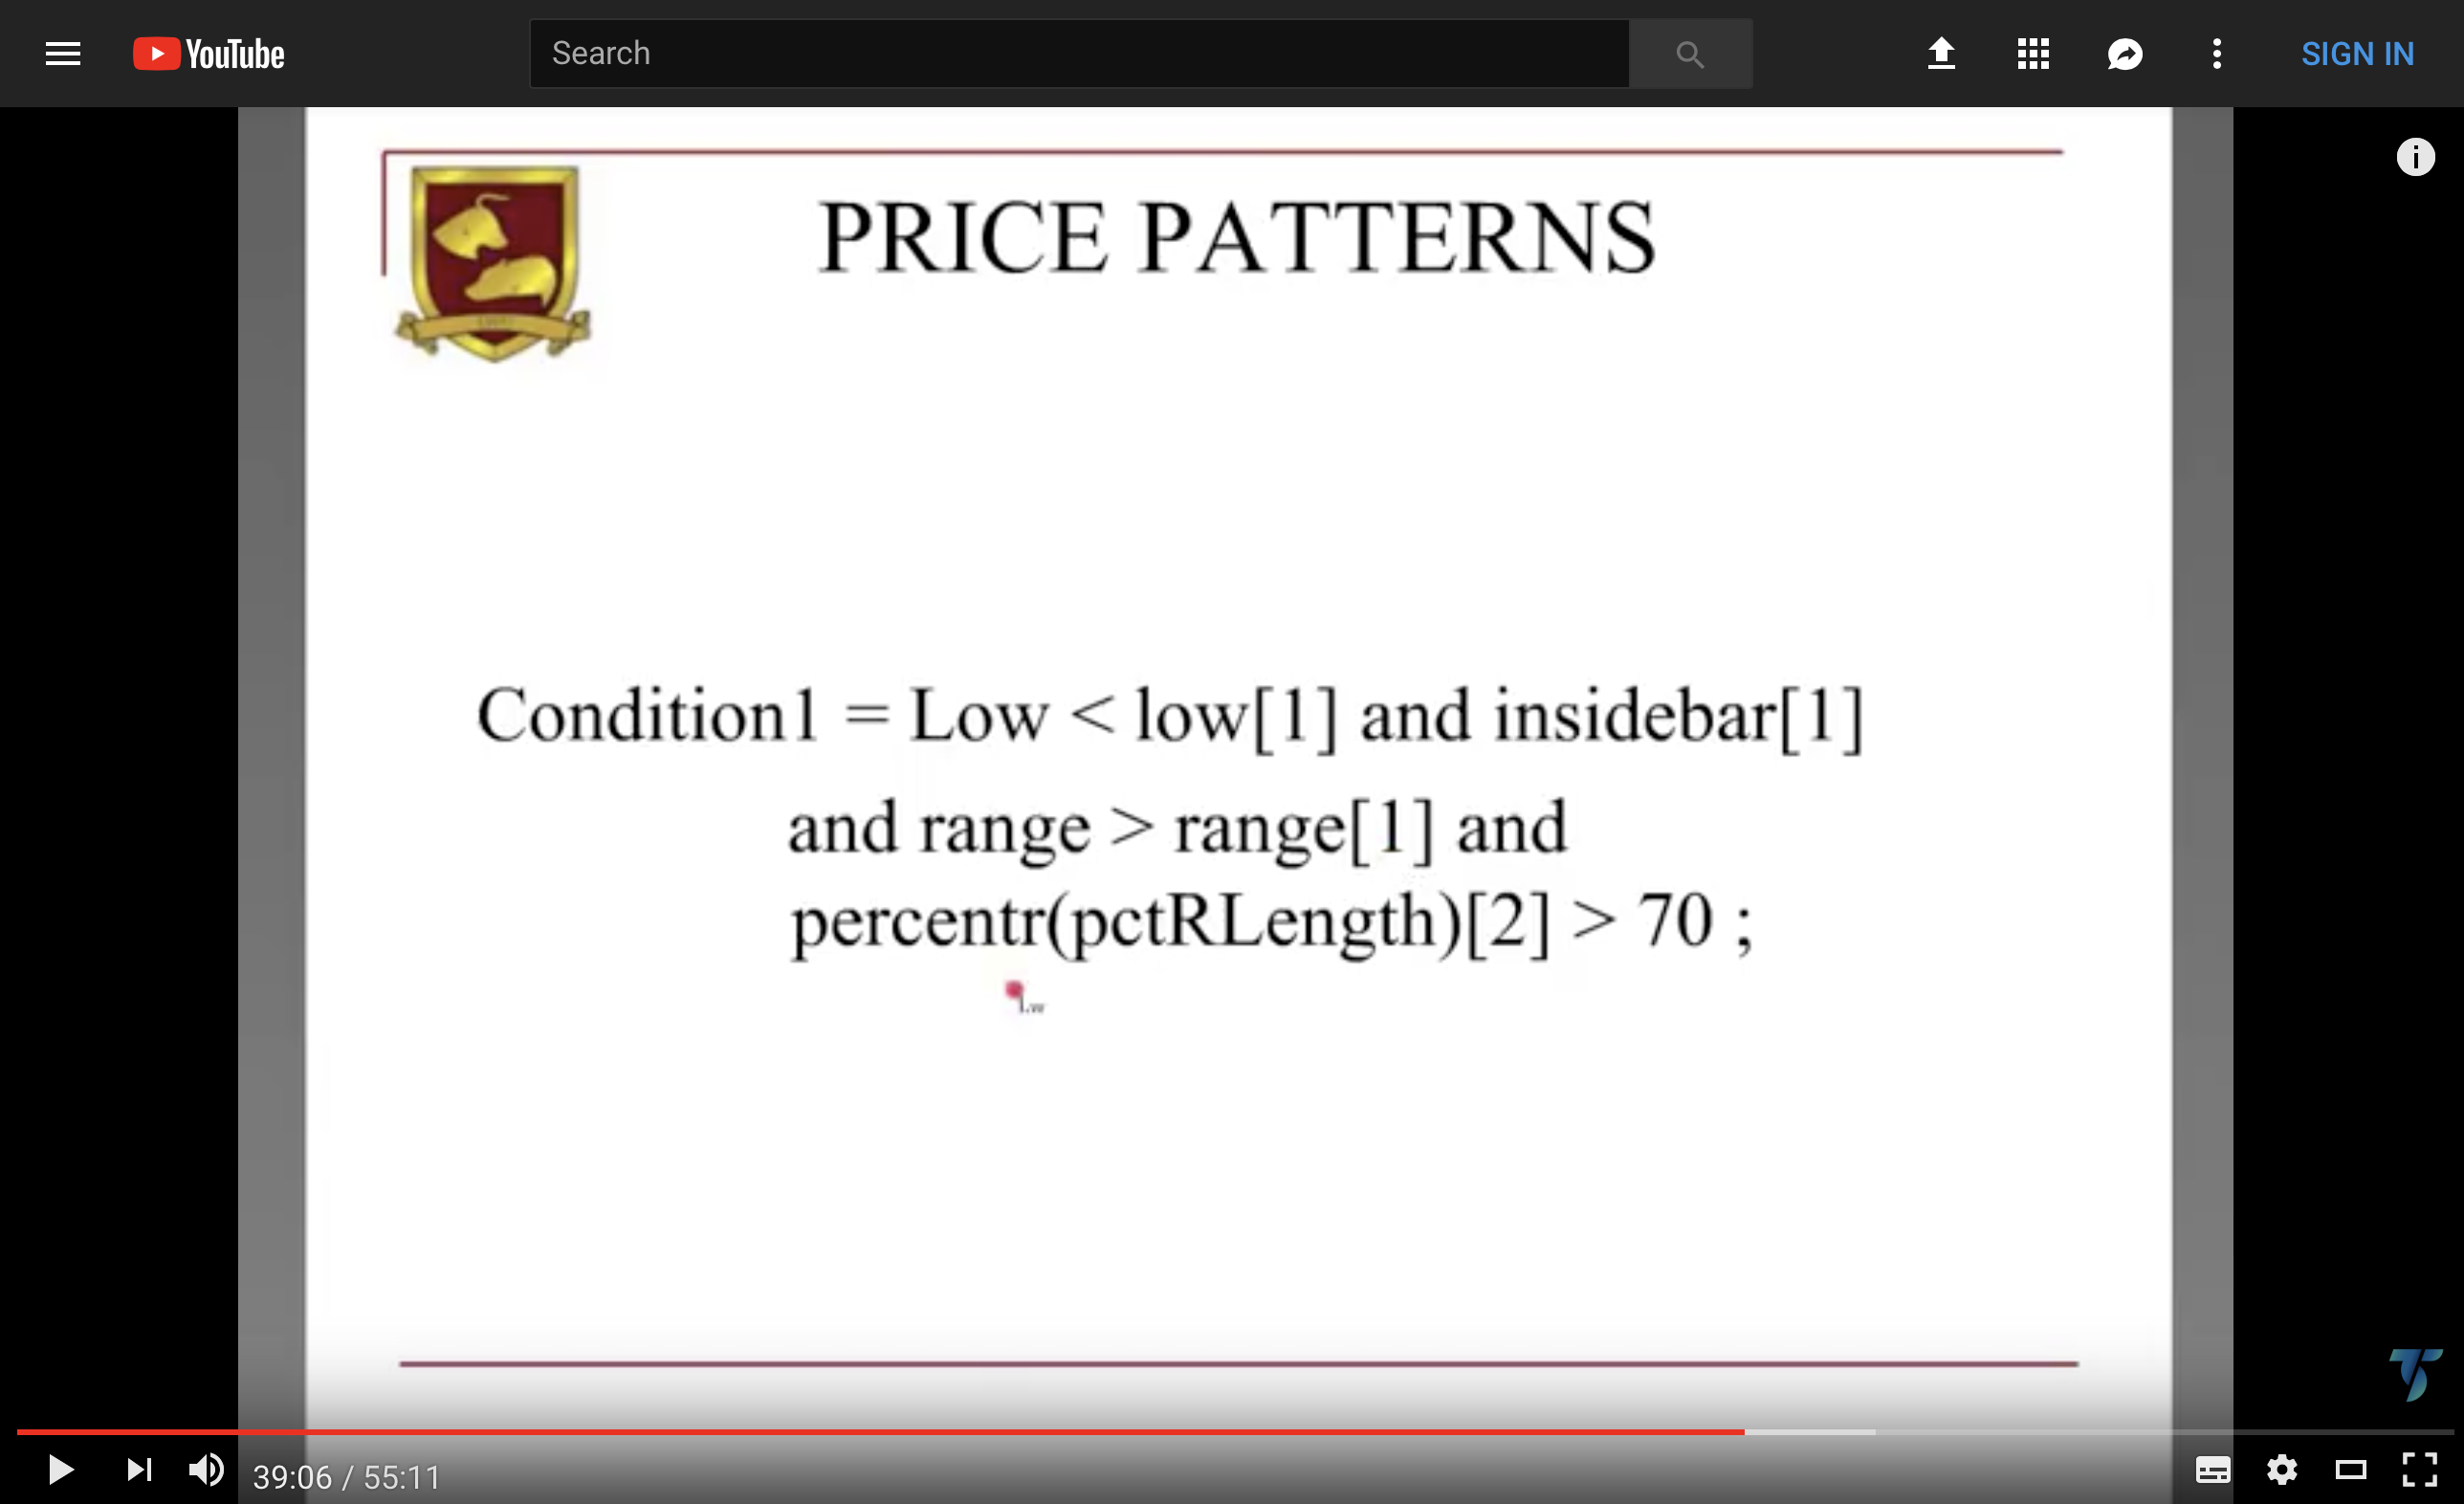
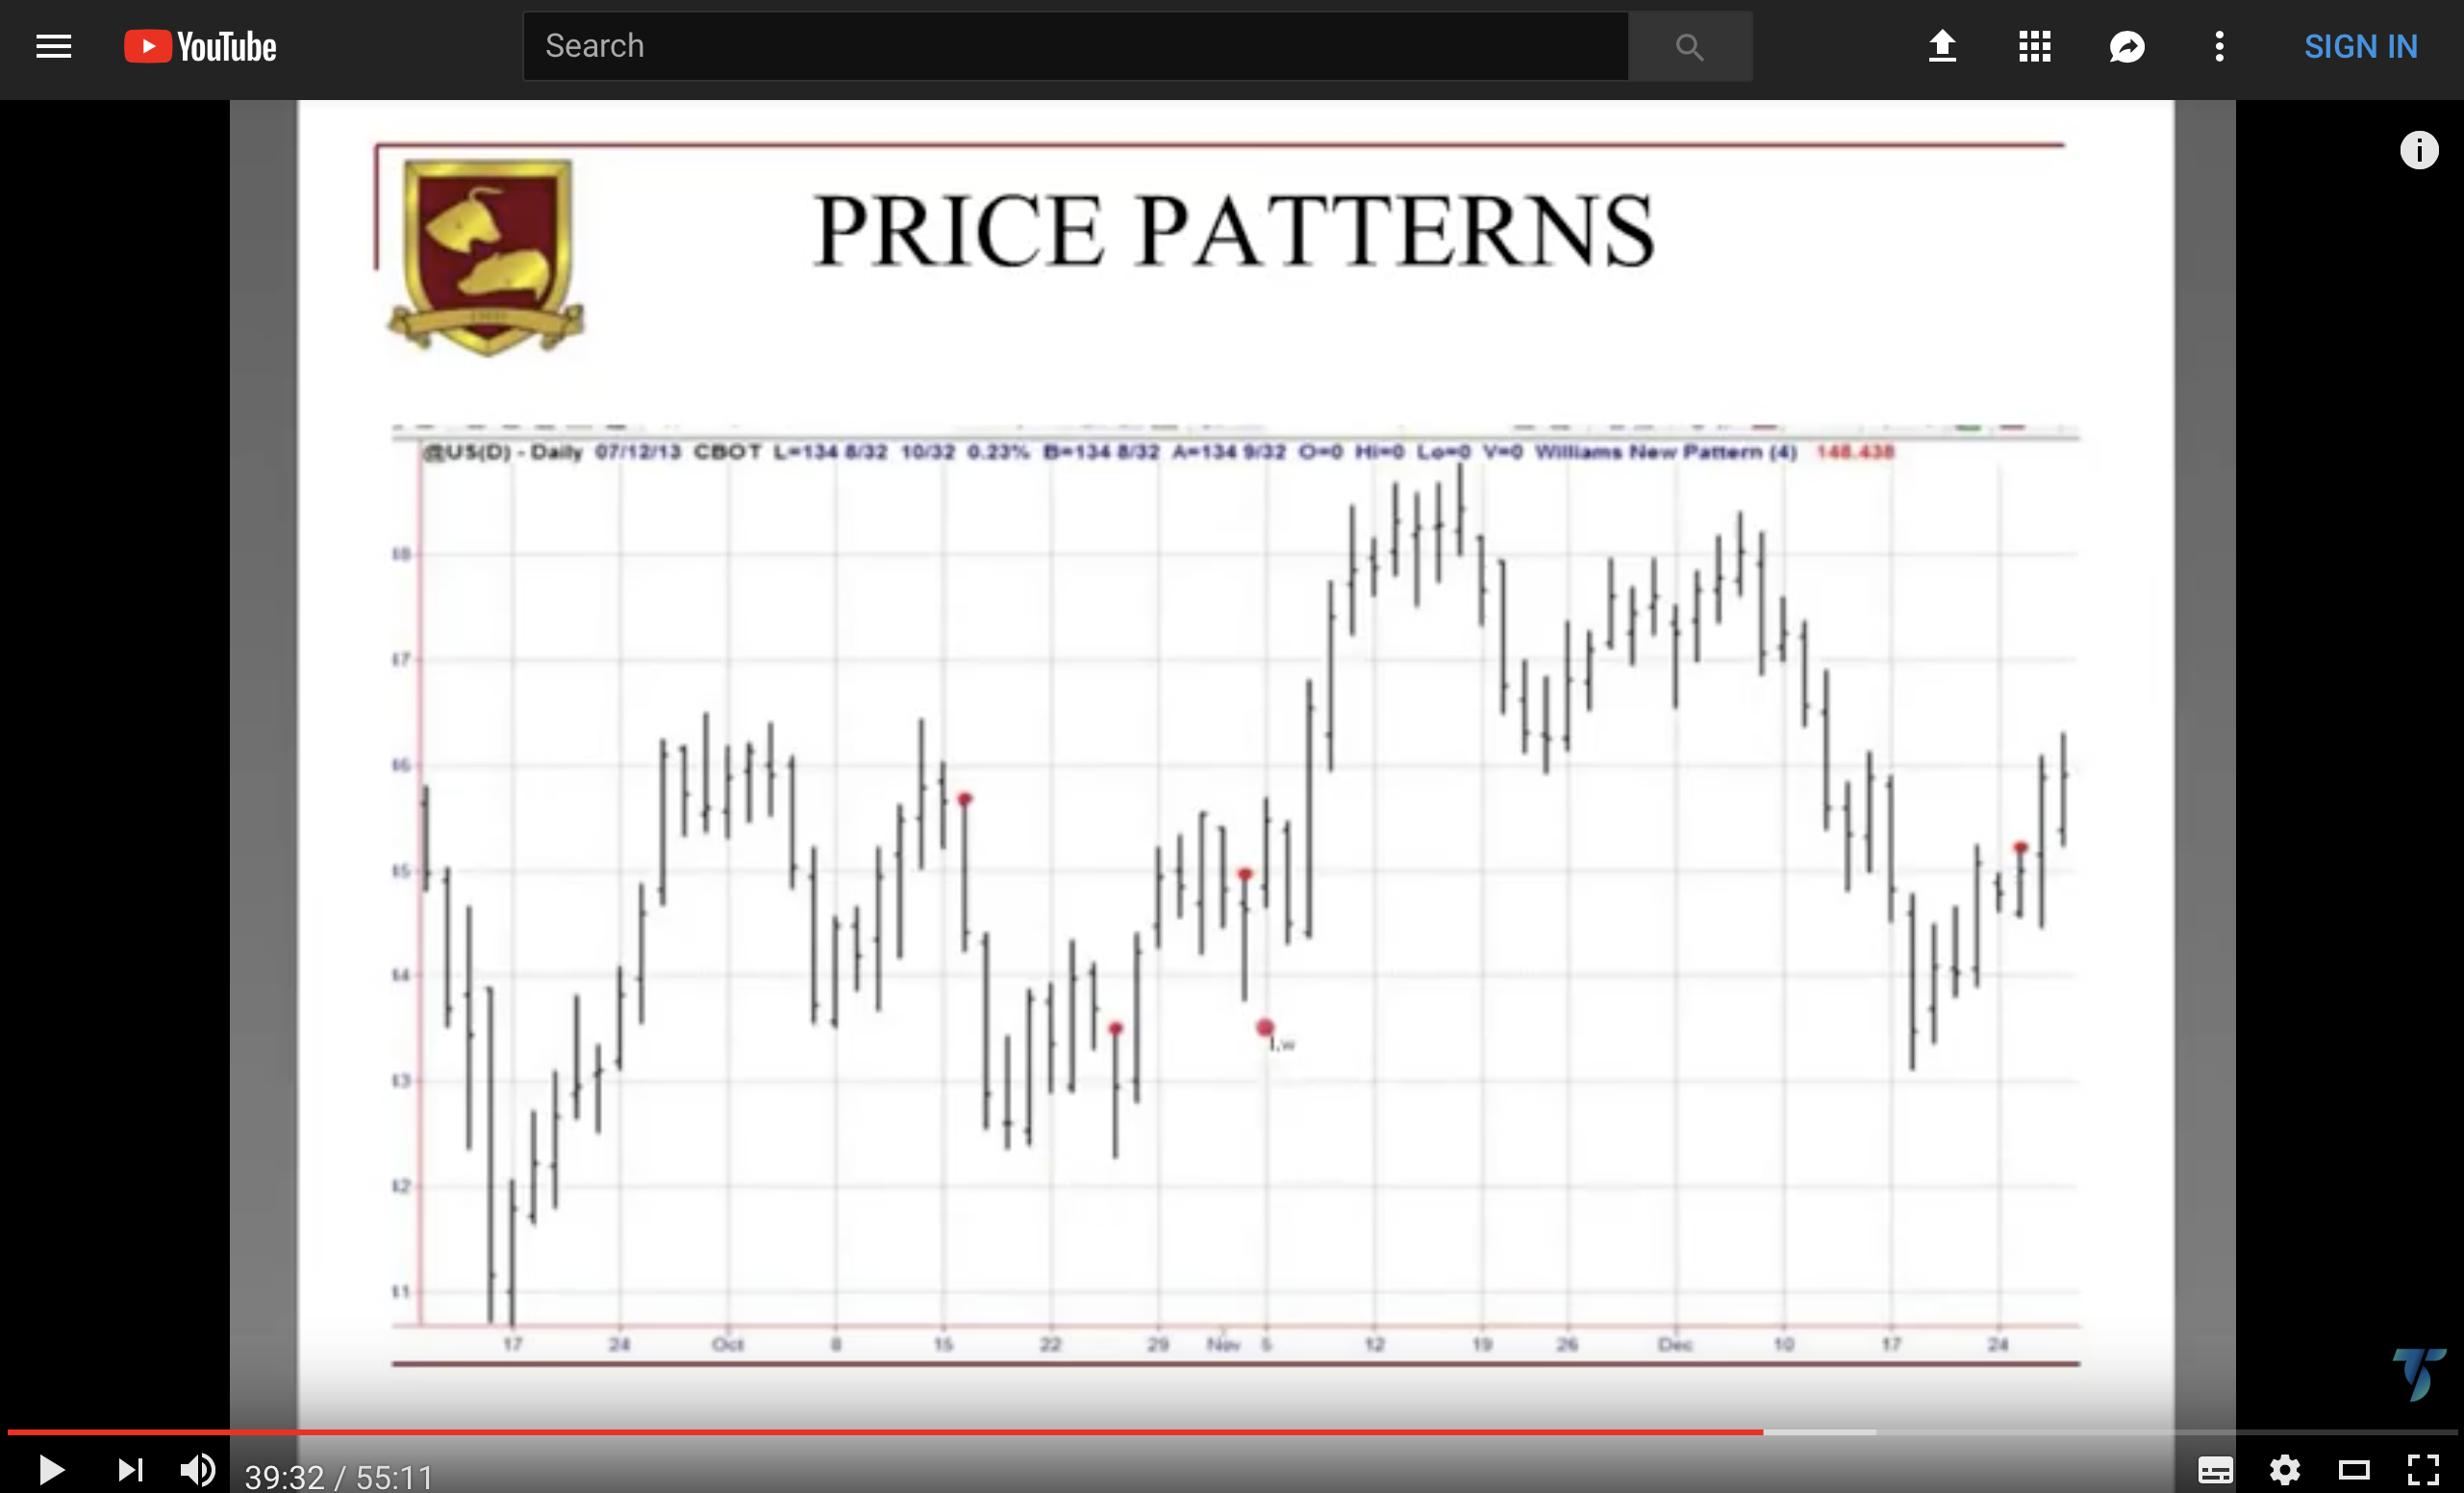
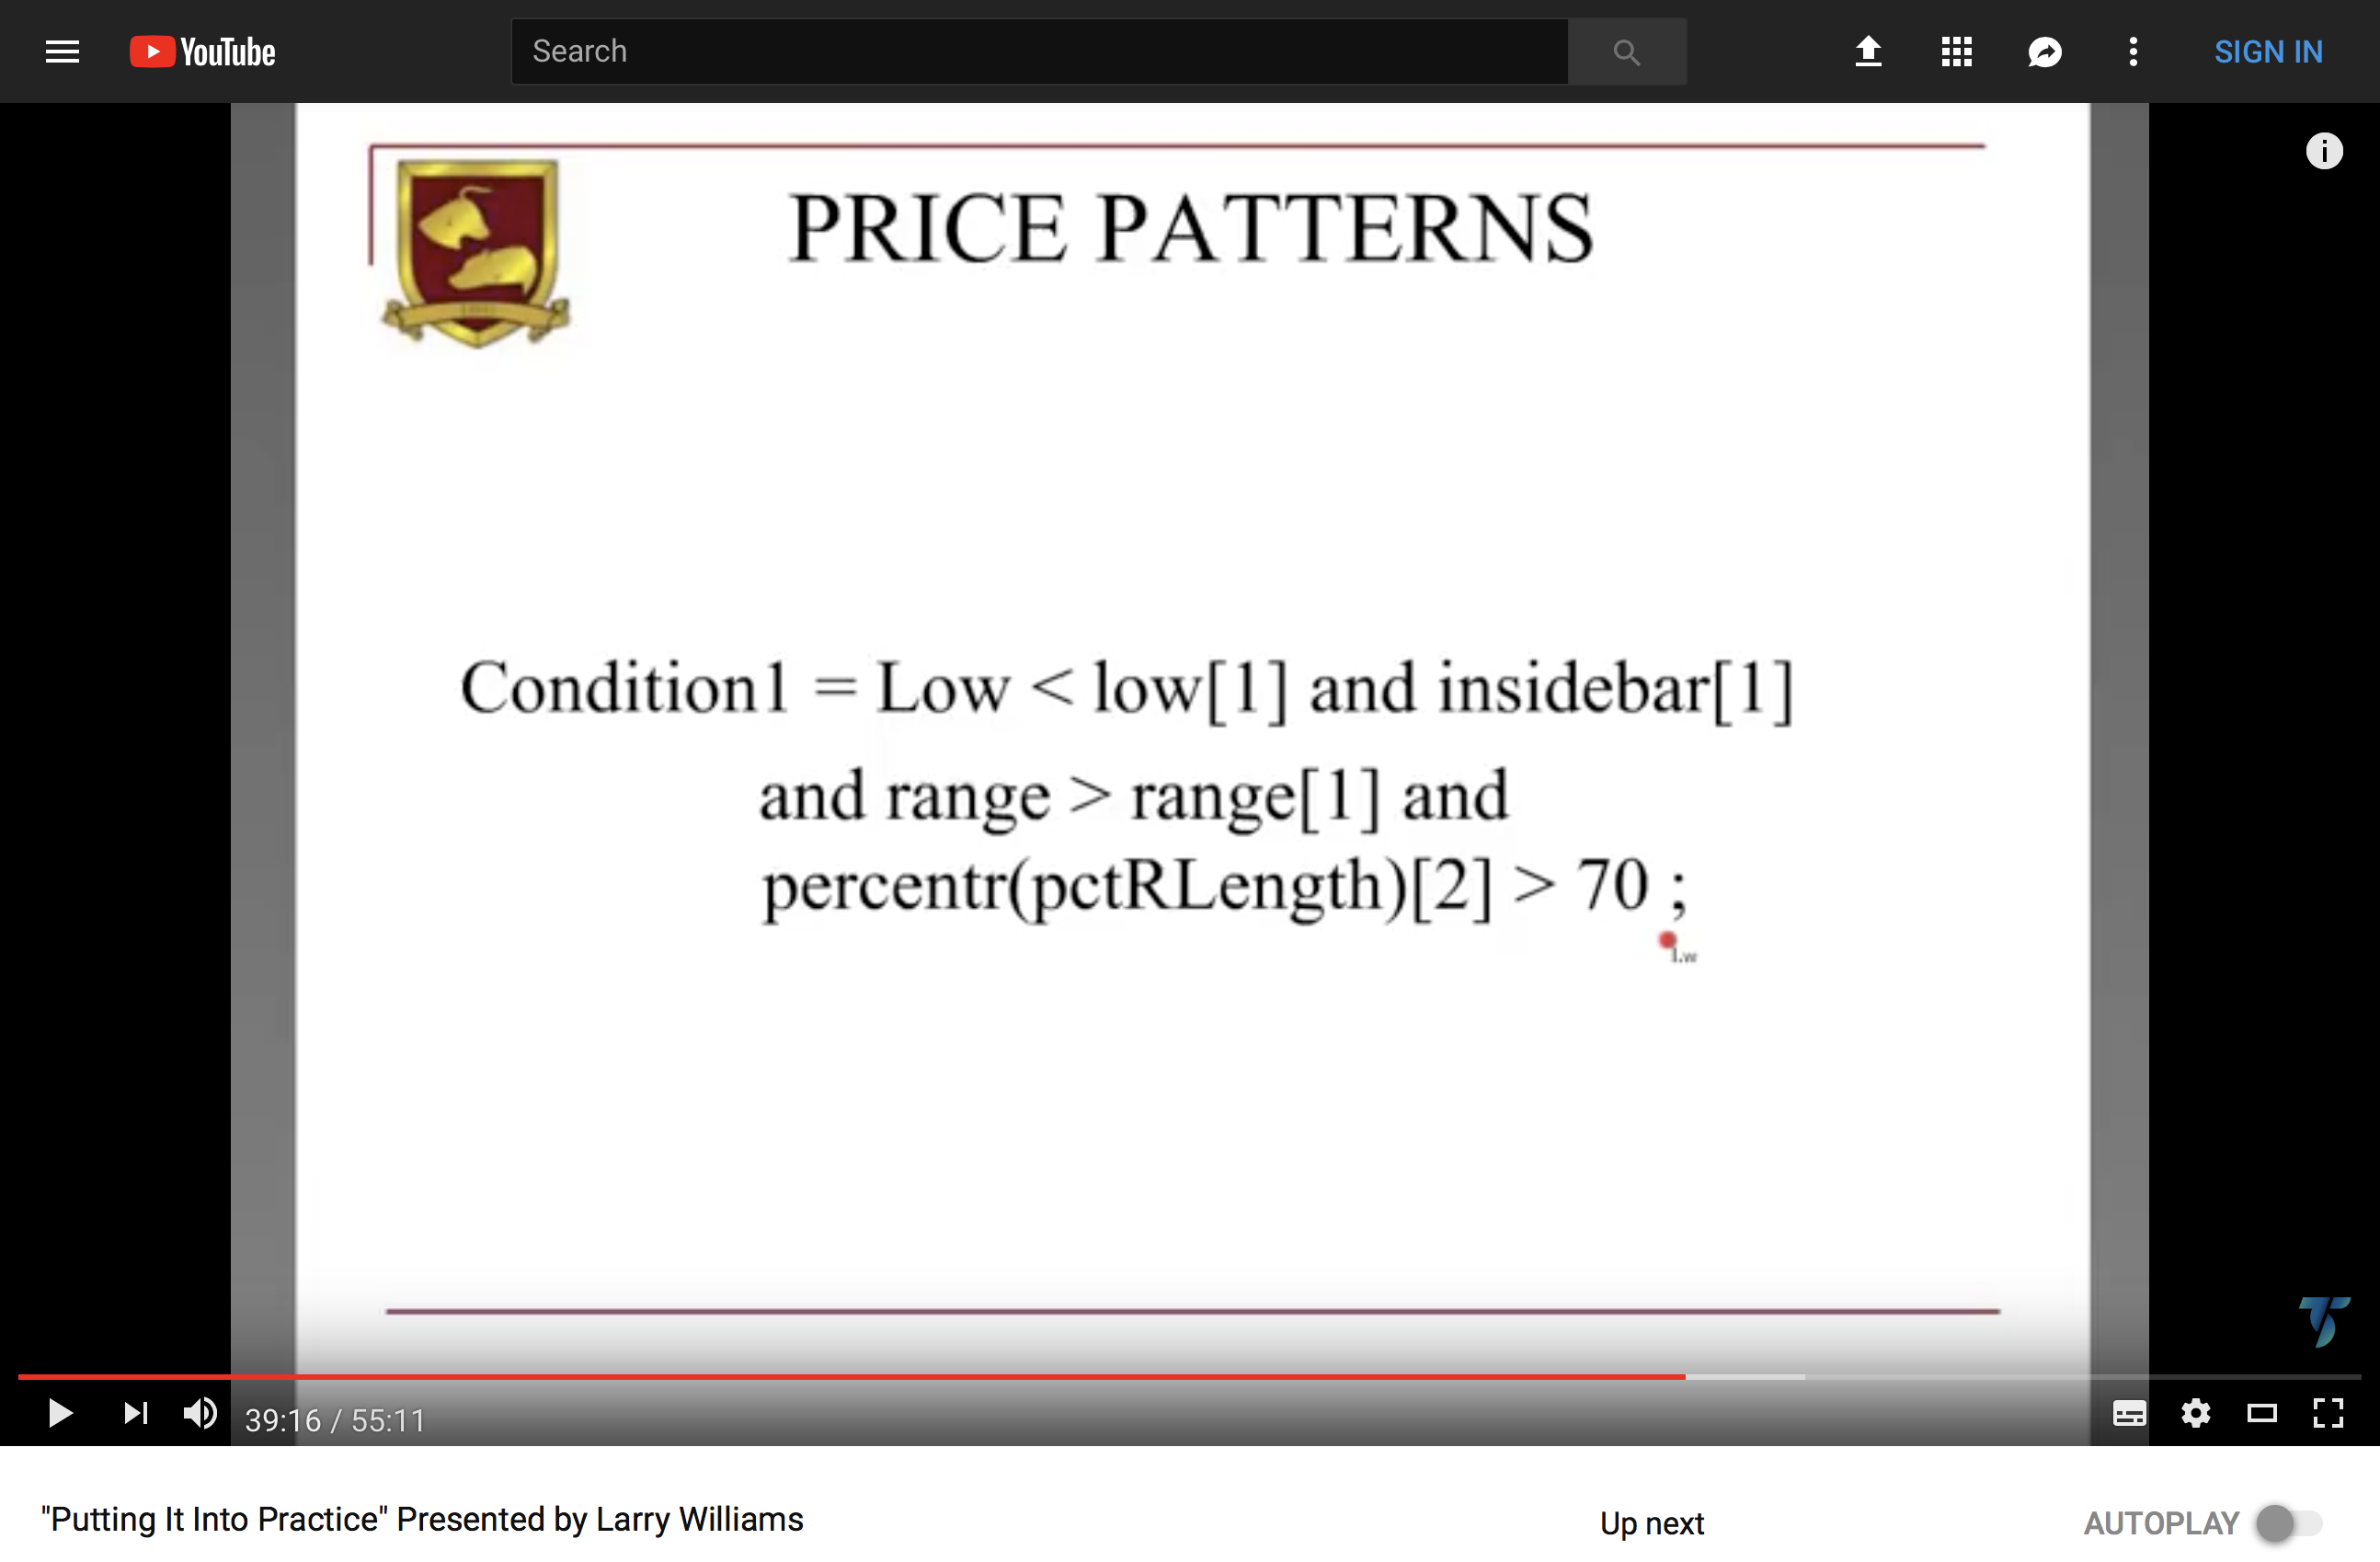
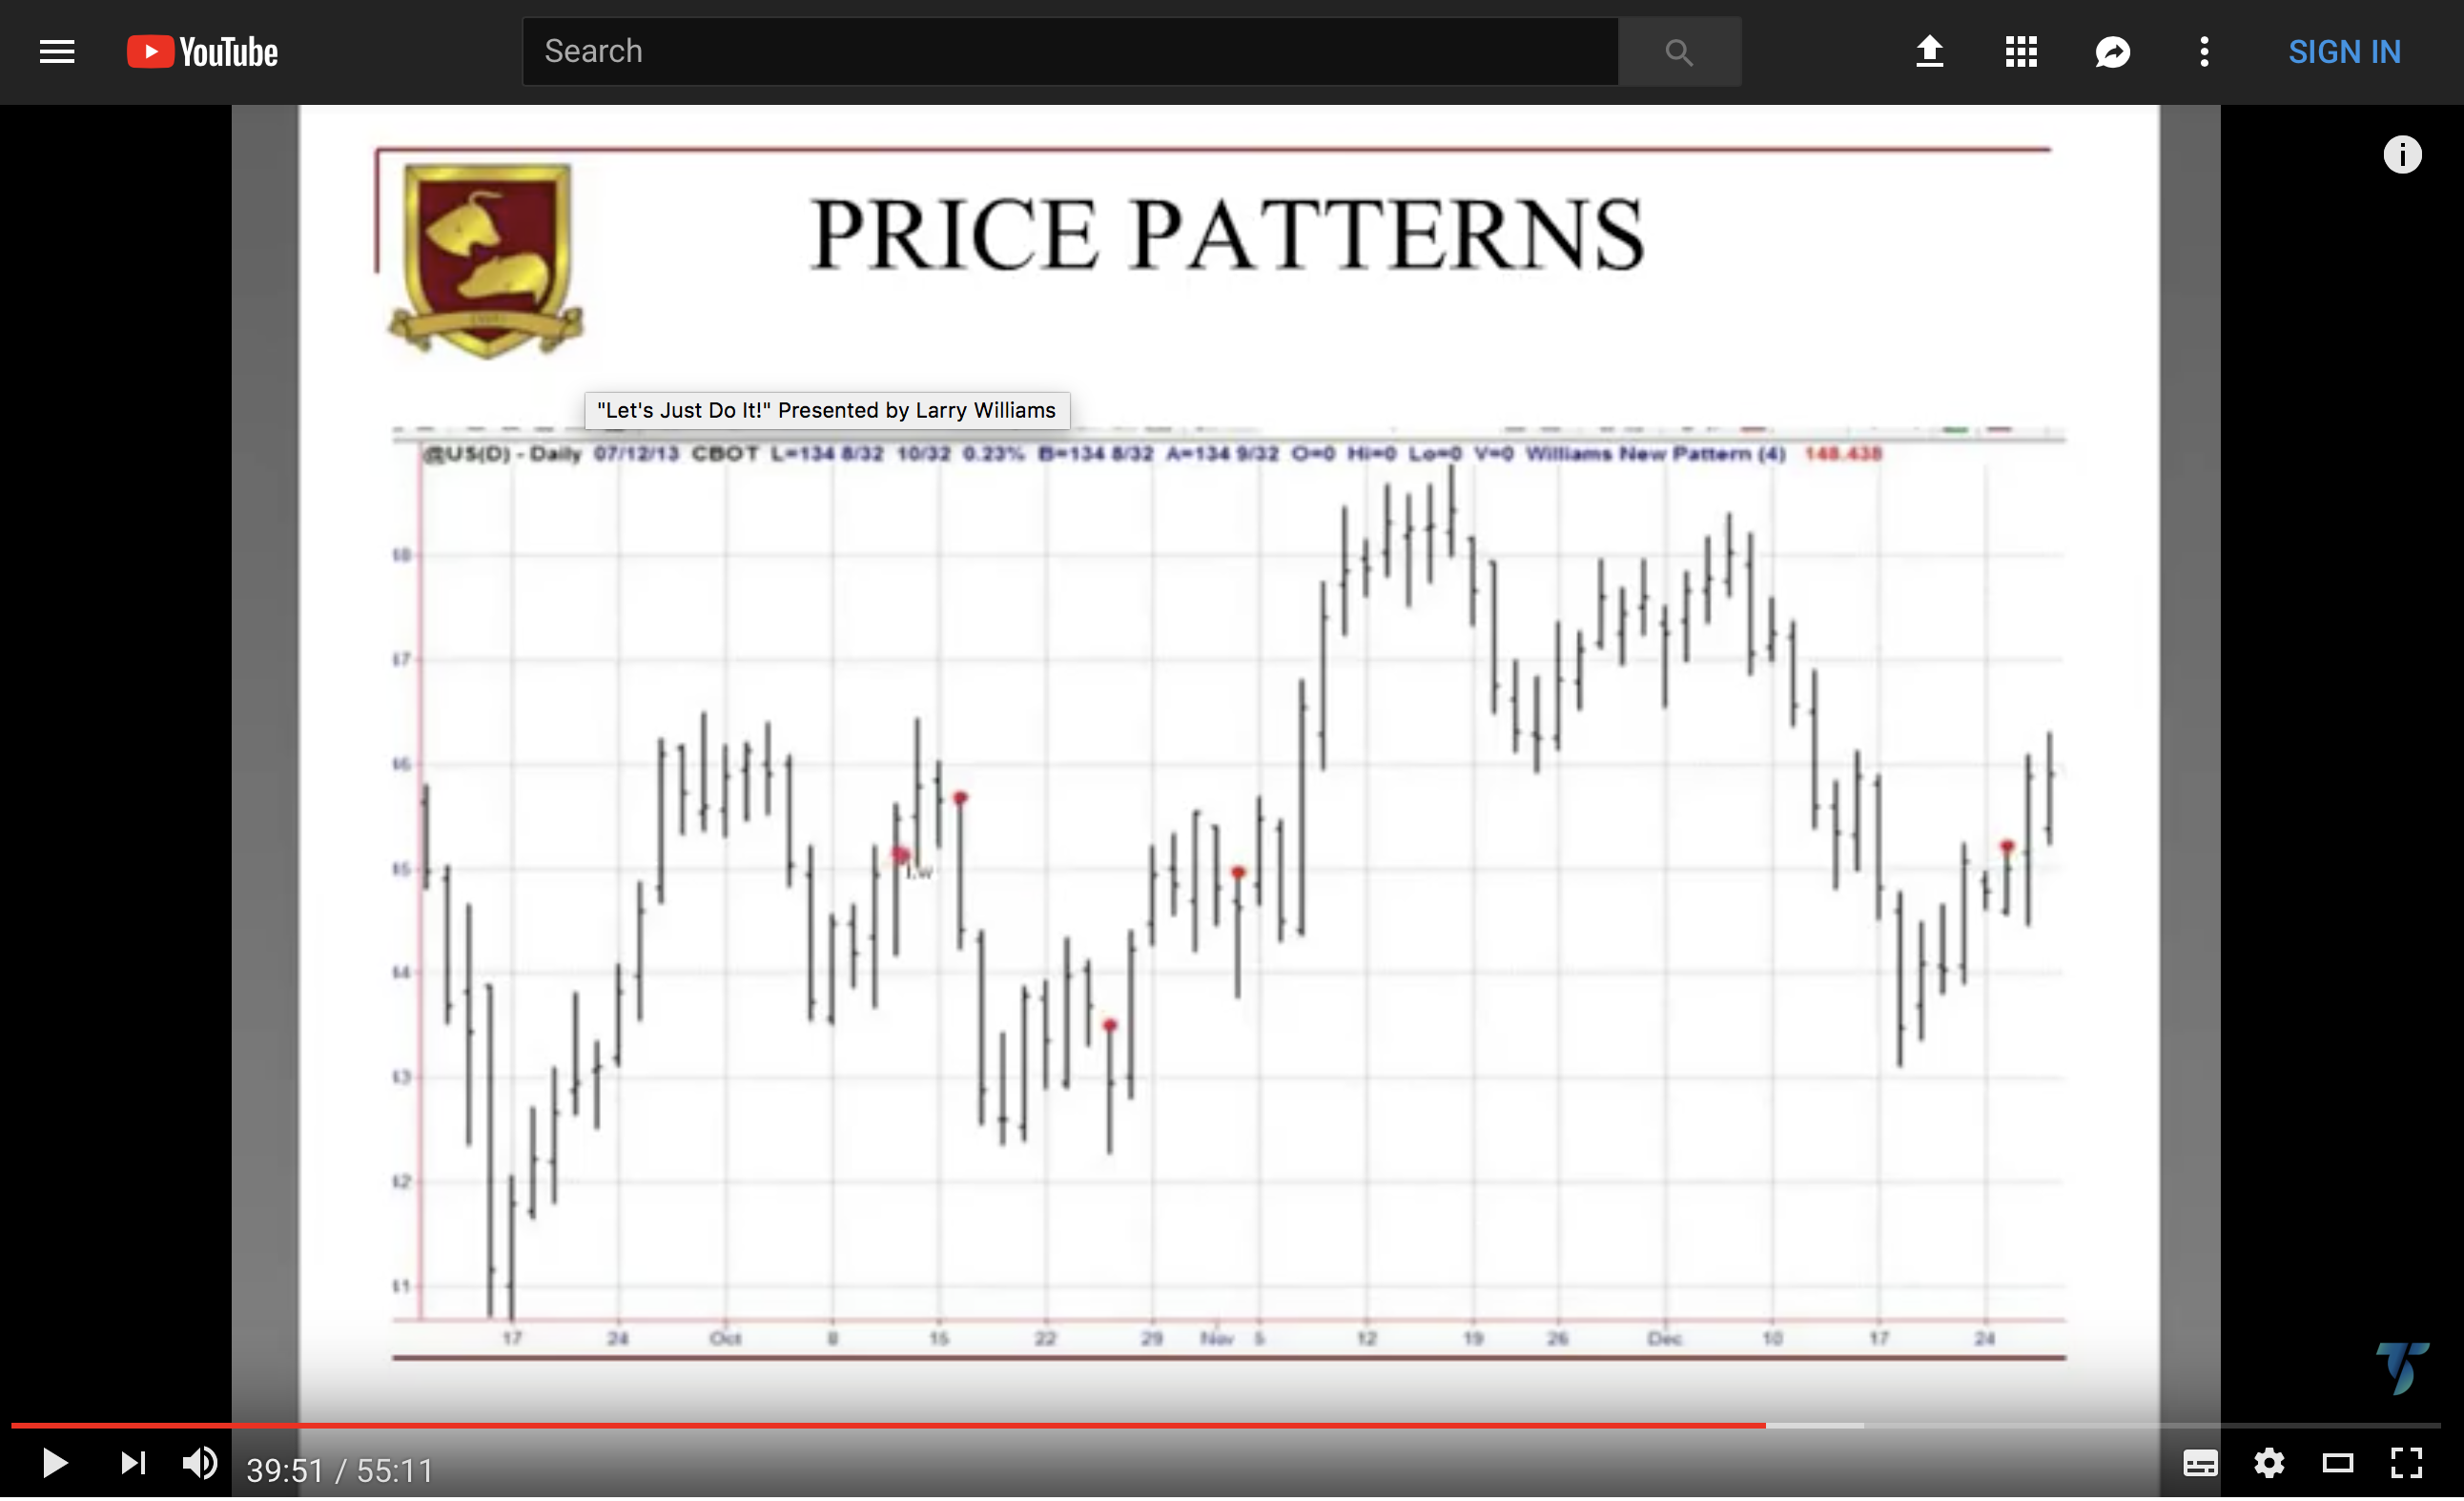
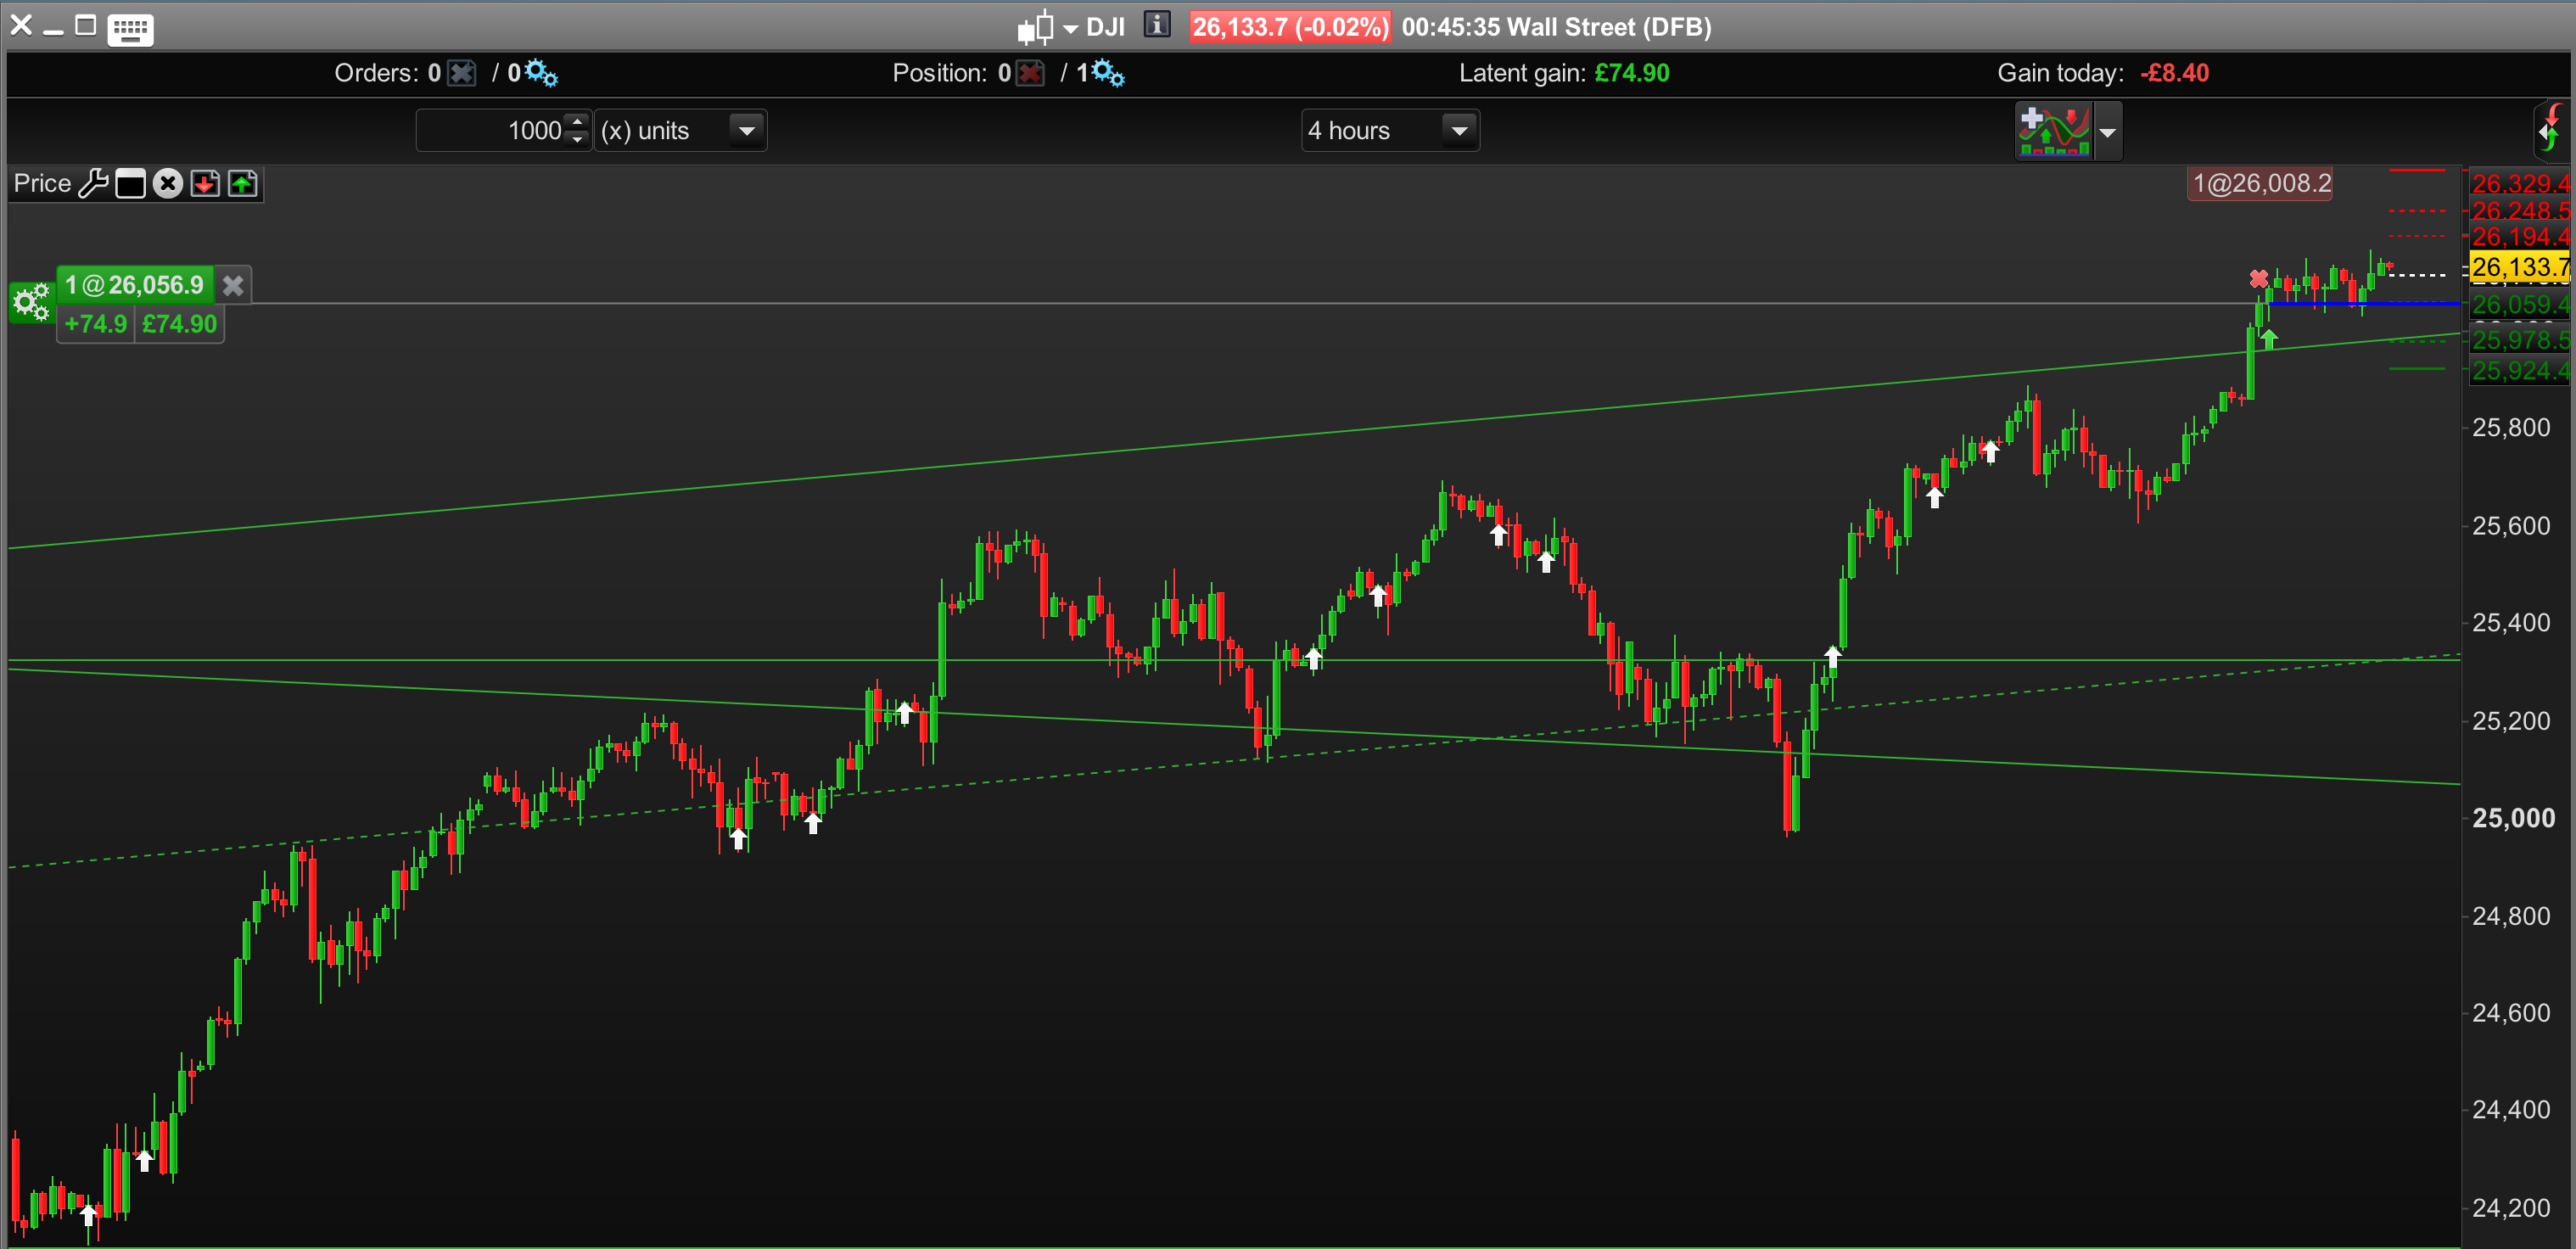
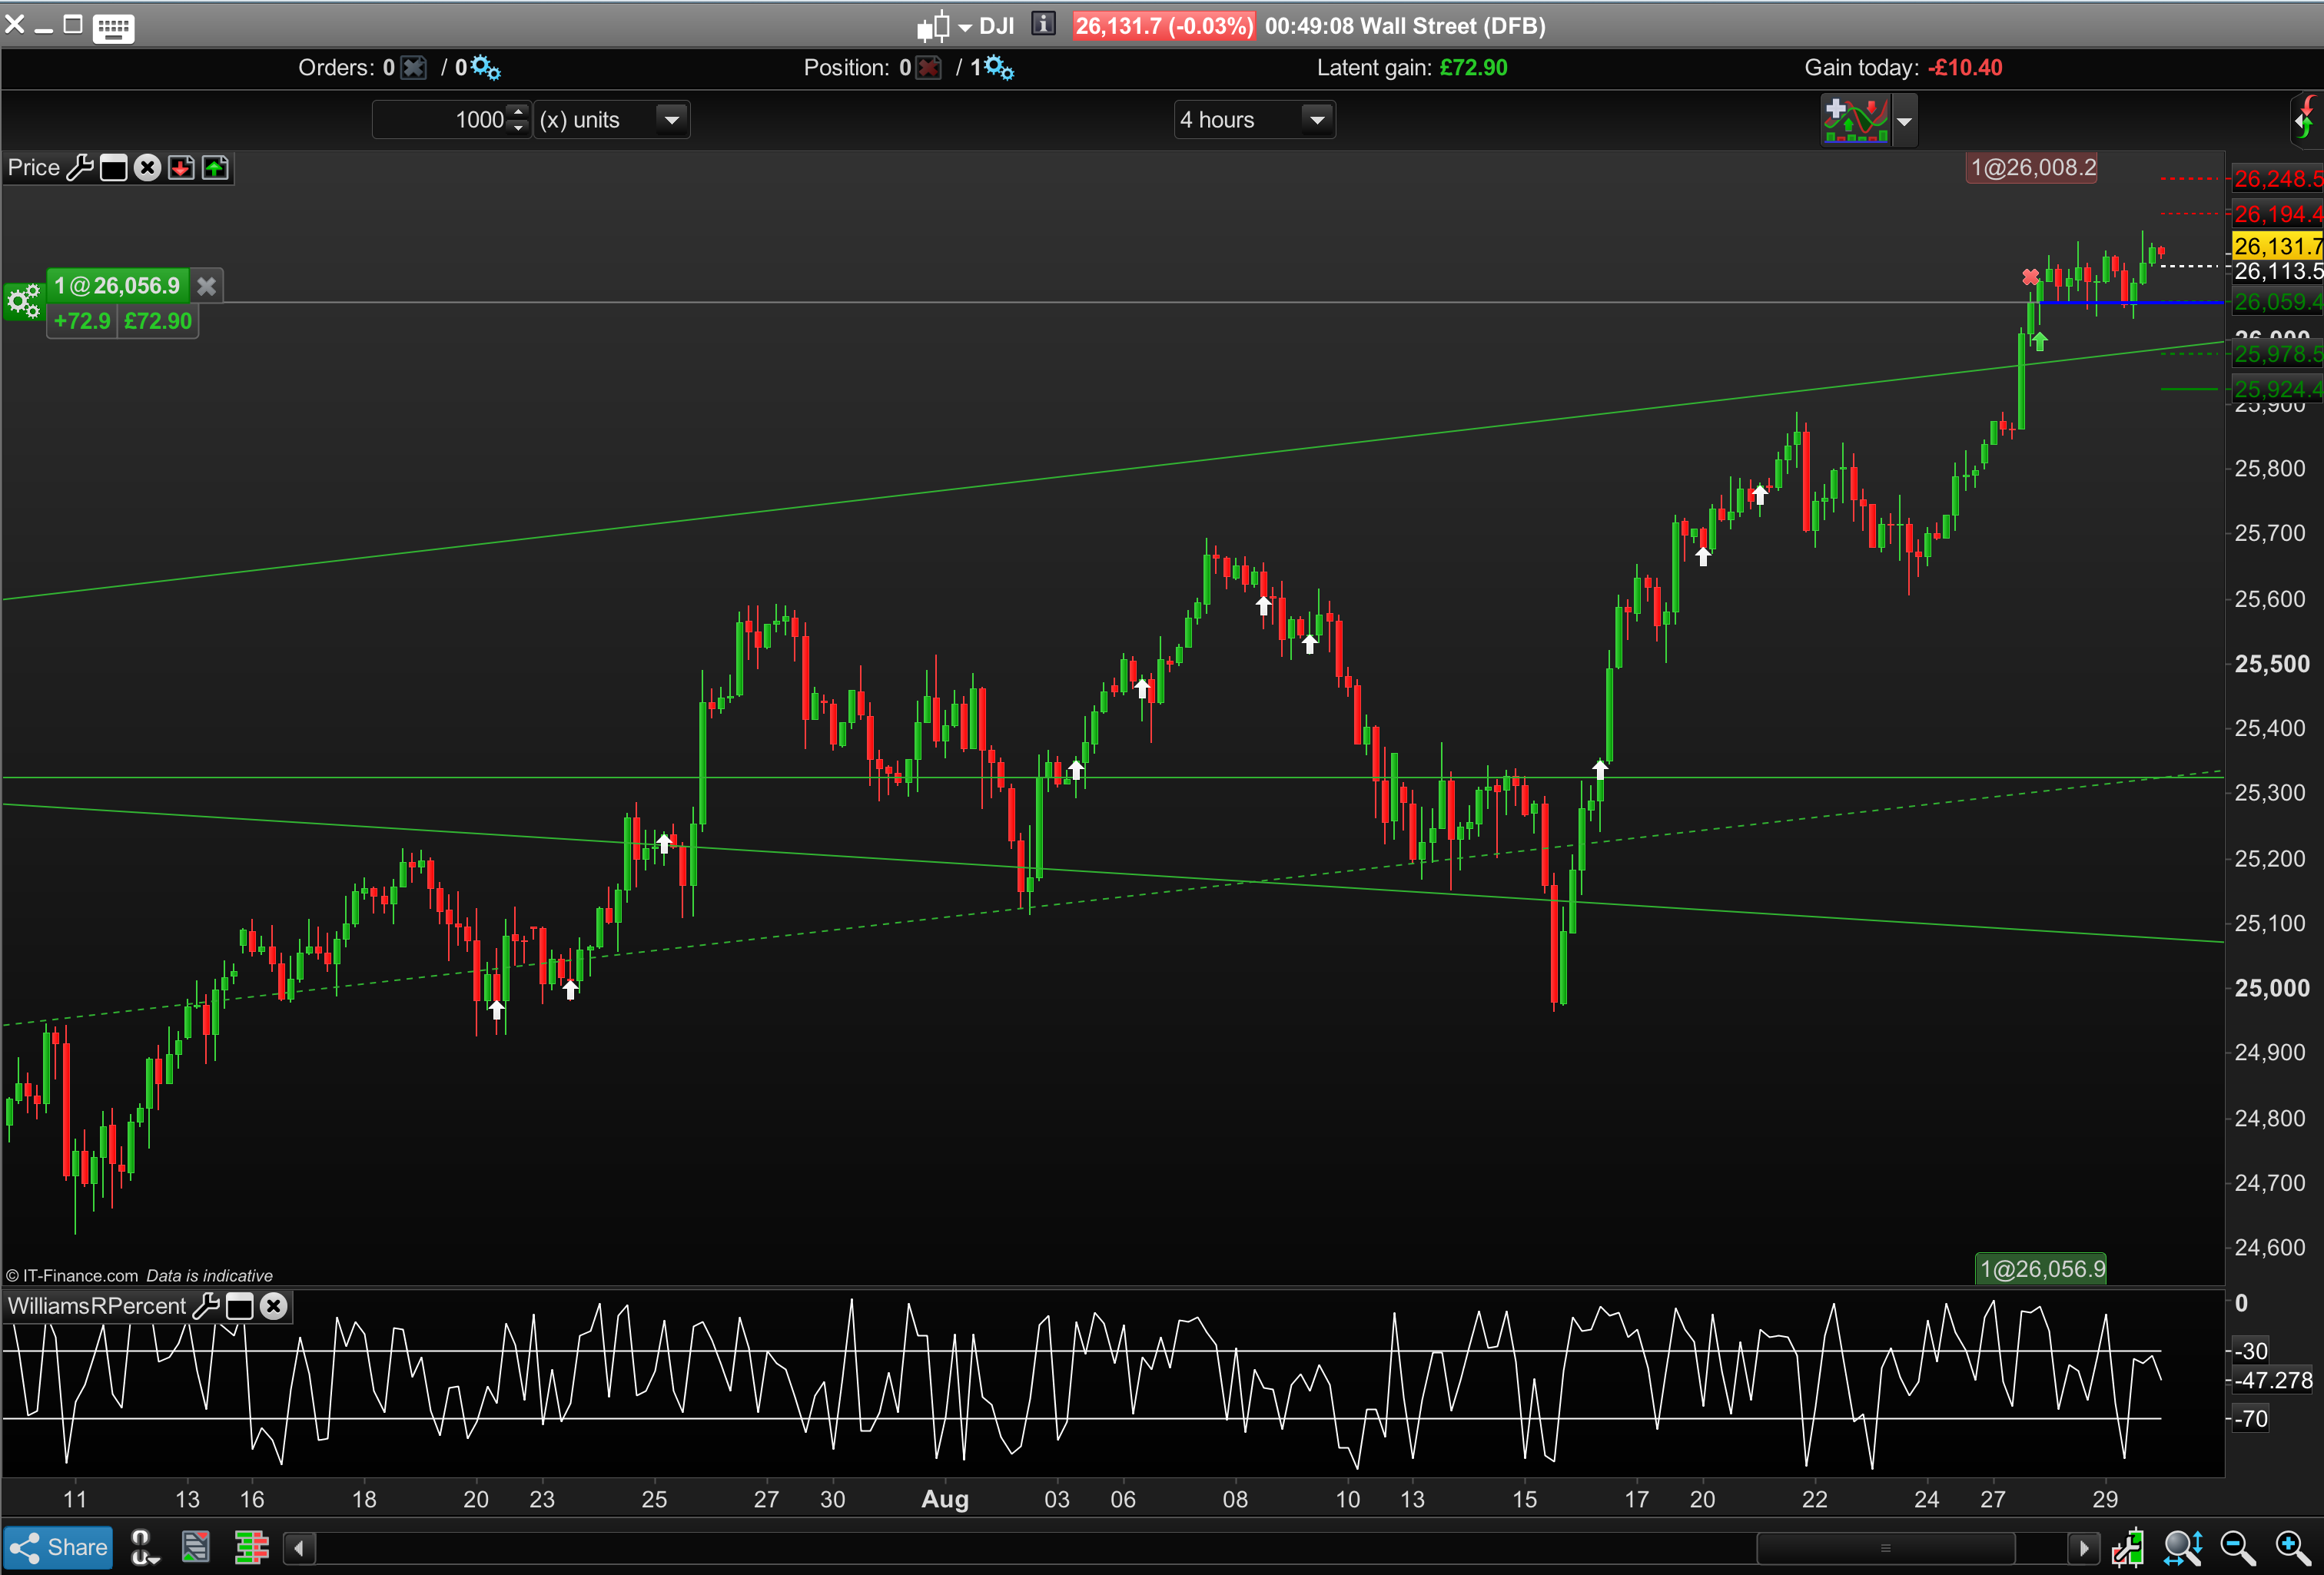
BardParticipant
Master
Hi
I was creating a Screener I wanted to add to the library based on a Larry Williams’ Buy Price Pattern, but despite looking at the PRT Manual, the forums and the DrawArrowUp Documentation, I’m still unsure how to get the last line of code to work below and get an up arrow onto the price / screener charts.
The presentation Williams gives is very interesting: “Putting it into Practice.”
You can always learn new ideas when the presentations given by someone as knowledgeable as Williams.
https://www.youtube.com/watch?v=CqA9ho39TUg
The actual “buy code” is at @39mins 13 secs and instructions of how to use it follow on.
Ps/ I think the buy pattern code is correct below and represents the code in Williams’ presentation. The Williams R Percent code is on the forum and reproduced here:
//PRC_WilliamsRpercent
//01.09.2016
//Nicolas @ www.prorealcode.com
//Sharing ProRealTime knowledge
period = 2 // Default =14
hh = highest[period](high)
ll = lowest[period](low)
Wp = ((hh-close)/(hh-ll))*-100
return Wp as "Williams R percent", -30 as "-30 level", -70 as "-70 level" //Default -20 and -80
Thanks in advance,
Cheers
Bard
c1 = (High[1] < High[2]) //Inside Bar
c2 = (Low[1] > Low[2]) //Inside Bar
c3 = (Low < Low[1])
c4 = ((High - Low) > (High[1] - Low[1])) //Range
indicator1, ignored, indicator2 = CALL WilliamsRPercent
c5 = (indicator1 > indicator2) // 2 Day WilliamsRPercent > 70
SCREENER[c1 AND c2 AND c3 AND C4 AND C5] (Variation AS "%Chg prev bar")
if c1 AND c2 AND c3 AND C4 AND C5 then DRAWARROWUP COLOURED(10,255,10)
endif
Screener can’t plot anything on chart, remove the lines 15 and 16 and you’re good. (I did not verify the logic of the conditions).
BardParticipant
Master
Cheers @nicolas, it would be great if the Screener did draw arrows. So the Screener will show an instrument if the condition(s) has just occurred in the last bar(s)? So you would only know that the 5 conditions have been actually fulfilled and visible on the chart by having to look for each individual condition that makes up the whole pattern for the screener?
Just from looking at Williams Buy Price Pattern rules (screenshot a) it seems he’s referring to a > 70 on his “Williams R Percent” but the indicator here on PRC, like everywhere else, has a negative scale so I’m wondering do you think he is referring to > -70 (i.e. buy it when it’s leaving over sold territory)?
Lastly once I tried coding that buy pattern signal into a system I could not get it to buy only after the 5 conditions have occurred (along with the added condition that the next bar’s high must be greater than the high of the bar with 5 conditions (denoted by orange dots in screenshot b)). Basically it just bought every bar because I am unsure how to get it to trade on the nextbaropen only, (nextbaropen is a redundant signal according to a comment you made elsewhere)
// Conditions to enter long positions
indicator1 = CALL "Williams' Buy Price Pattern"
c1 = (DHigh(0) > indicator1)
IF c1 THEN
BUY 10 PERPOINT AT MARKET
ENDIF
I can put the indicator up into the forum once I’m sure about the > 70 part. I think it looks okay in screenshot d (pls ignore screenshot c – I couldn’t delete it).
Thanks again,
Remove the minus symbol and you’ll get the same. The scale is not important for a bounded oscillator.
Wp = ((hh-close)/(hh-ll))*100